Exhibit 99.1
Investor Presentation November 2019
Forward - Looking Statements 1 This presentation is for informational purposes only and does not constitute an offer to sell, or a solicitation of offers to purchase, Global Medical REIT Inc . ’s (the “Company”, or “GMRE”) securities . The information contained in this presentation does not purport to be complete and should not be relied upon as a basis for making an investment decision in the Company’s securities . This presentation also contains statements that, to the extent they are not recitations of historical fact, constitute “forward - looking statements . ” Forward - looking statements are typically identified by the use of terms such as “may,” “should,” “expect,” “could,” “intend,” “plan,” “anticipate,” “estimate,” “believe,” “continue,” “predict,” “potential” or the negative of such terms and other comparable terminology . The forward - looking statements included herein are based upon the Company’s current expectations, plans, estimates, assumptions and beliefs that involve numerous risks and uncertainties . Assumptions relating to the foregoing involve judgments with respect to, among other things, future economic, competitive and market conditions and future business decisions, all of which are difficult or impossible to predict accurately and many of which are beyond the Company’s control . Although the Company believes that the expectations reflected in such forward - looking statements are based on reasonable assumptions, the Company’s actual results and performance could differ materially from those set forth in the forward - looking statements due to the impact of many factors including, but not limited to, those discussed under “Risk Factors” in the Company’s Annual Report on Form 10 - K and Quarterly Reports on Form 10 - Q and any prospectus or prospectus supplement filed with the Securities and Exchange Commission . The Company undertakes no obligation to update or revise any such information for any reason after the date of this presentation, unless required by law . This presentation includes information regarding certain of our tenants, which are not subject to SEC reporting requirements . The information related to our tenants contained in this report was provided to us by such tenants or was derived from publicly available information . We have not independently investigated or verified this information . We have no reason to believe that this information is inaccurate in any material respect, but we cannot provide any assurance of its accuracy . We are providing this data for informational purposes only .
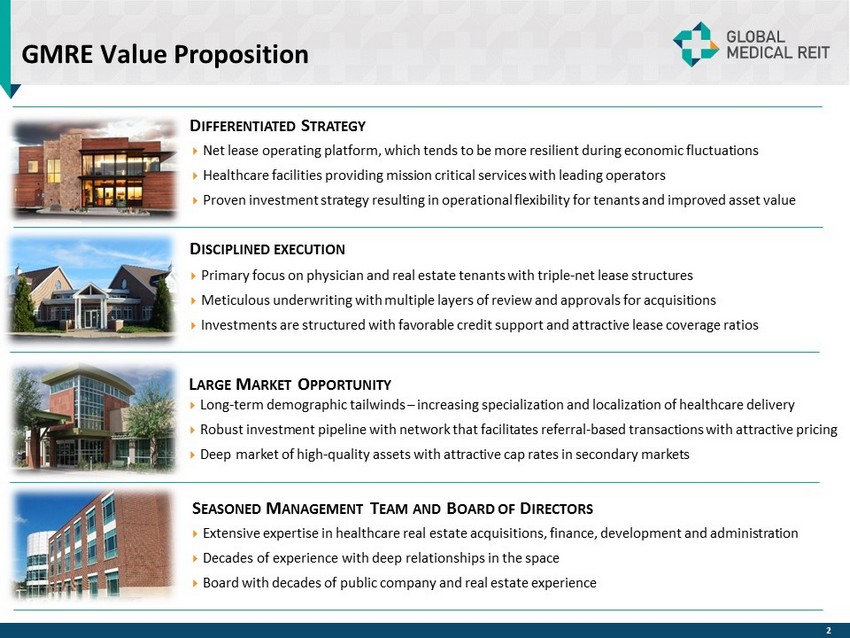
GMRE Value Proposition Net lease operating platform, which tends to be more resilient during economic fluctuations Healthcare facilities providing mission critical services with leading operators Proven investment strategy resulting in operational flexibility for tenants and improved asset value D IFFERENTIATED S TRATEGY Primary focus on physician and real estate tenants with triple - net lease structures Meticulous underwriting with multiple layers of review and approvals for acquisitions Investments are structured with favorable credit support and attractive lease coverage ratios Long - term demographic tailwinds – increasing specialization and localization of healthcare delivery Robust investment pipeline with network that facilitates referral - based transactions with attractive pricing Deep market of high - quality assets with attractive cap rates in secondary markets Extensive expertise in healthcare real estate acquisitions, finance, development and administration Decades of experience with deep relationships in the space Board with decades of public company and real estate experience D ISCIPLINED EXECUTION L ARGE M ARKET O PPORTUNITY S EASONED M ANAGEMENT T EAM AND B OARD OF D IRECTORS 2
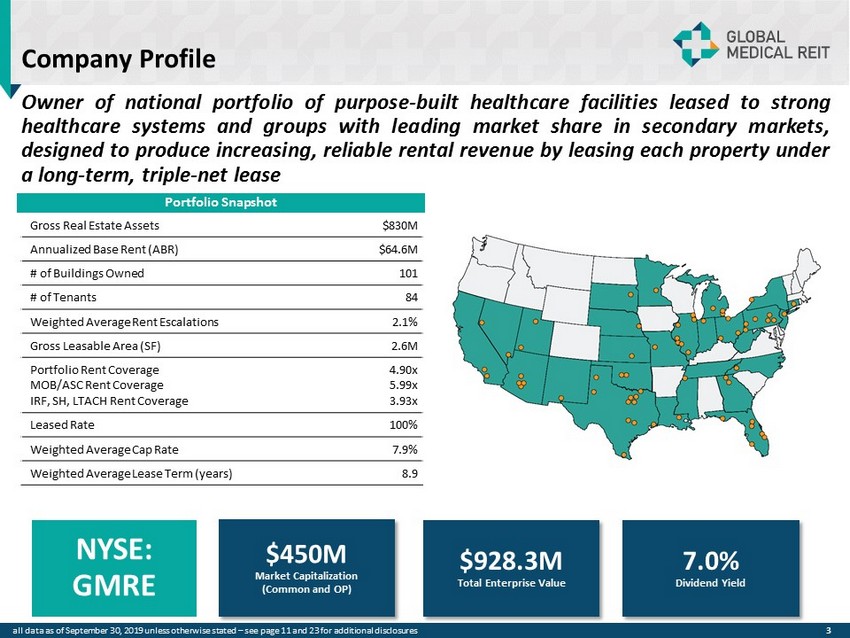
Company Profile 3 Owner of national portfolio of purpose - built healthcare facilities leased to strong healthcare systems and groups with leading market share in secondary markets, designed to produce increasing, reliable rental revenue by leasing each property under a long - term, triple - net lease $450M Market Capitalization (Common and OP) NYSE: GMRE 7.0% Dividend Yield $928.3M Total Enterprise Value Gross Real Estate Assets $830M Annualized Base Rent (ABR) $64.6M # of Buildings Owned 101 # of Tenants 84 Weighted Average Rent Escalations 2.1% Gross Leasable Area (SF) 2.6M Portfolio Rent Coverage MOB/ASC Rent Coverage IRF, SH, LTACH Rent Coverage 4.90x 5.99x 3.93x Leased Rate 100% Weighted Average Cap Rate 7.9% Weighted Average Lease Term (years) 8.9 Portfolio Snapshot all data as of September 30, 2019 unless otherwise stated – see page 11 and 23 for additional disclosures
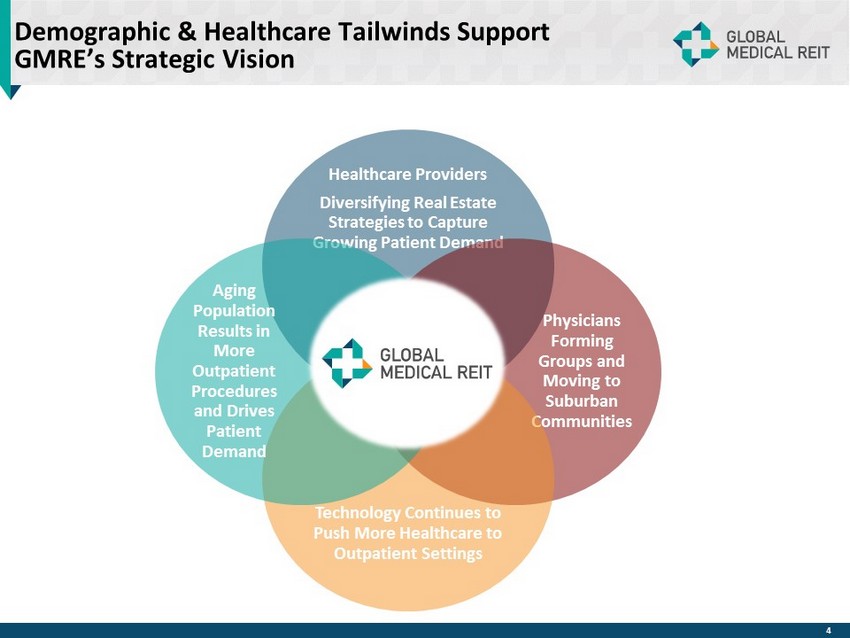
Demographic & Healthcare Tailwinds Support GMRE’s Strategic Vision Healthcare Providers Diversifying Real Estate Strategies to Capture Growing Patient Demand Physicians Forming Groups and Moving to Suburban Communities Technology Continues to Push More Healthcare to Outpatient Settings Aging Population Results in More Outpatient Procedures and Drives Patient Demand 4
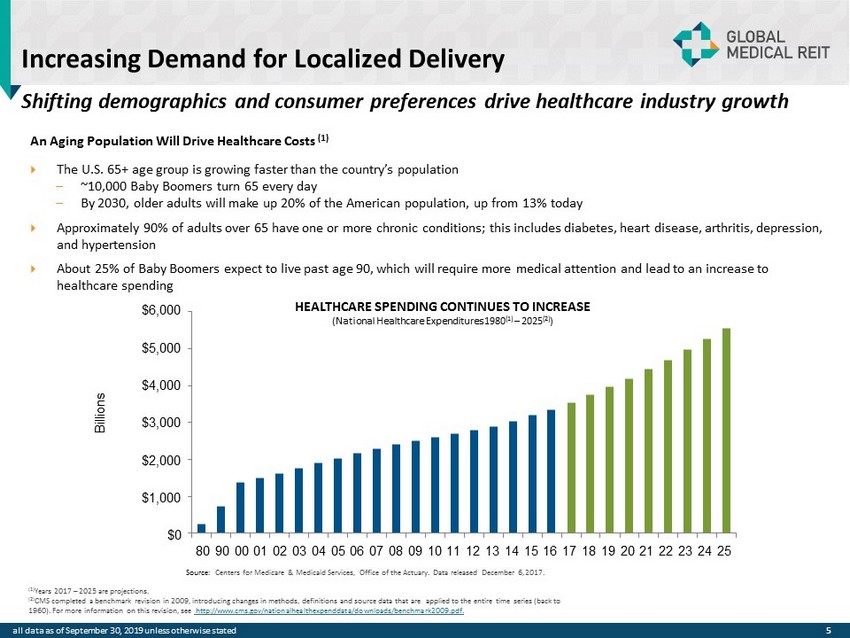
$6,000 $5,000 $4,000 $3,000 $2,000 $1,000 $0 80 90 00 01 02 03 04 05 06 07 08 09 10 11 12 13 14 15 16 17 18 19 20 21 22 23 24 25 Increasing Demand for Localized Delivery An Aging Population Will Drive Healthcare Costs (1) The U.S. 65+ age group is growing faster than the country’s population – ~10,000 Baby Boomers turn 65 every day – By 2030, older adults will make up 20% of the American population, up from 13% today Approximately 90% of adults over 65 have one or more chronic conditions; this includes diabetes, heart disease, arthritis, de pre ssion, and hypertension About 25% of Baby Boomers expect to live past age 90, which will require more medical attention and lead to an increase to healthcare spending 5 Source: Centers for Medicare & Medicaid Services, Office of the Actuary. Data released December 6, 2017. HEALTHCARE SPENDING CONTINUES TO INCREASE (National Healthcare Expenditures 1980 (1) – 2025 (2) ) Shifting demographics and consumer preferences drive healthcare industry growth all data as of September 30, 2019 unless otherwise stated (1) Years 2017 – 2025 are projections. (2) CMS completed a benchmark revision in 2009, introducing changes in methods, definitions and source data that are applied to the entire time series (back to 1960). For more information on this revision, see http://www.cms.gov/nationalhealthexpenddata/downloads/benchmark2009.pdf. B illi o n s
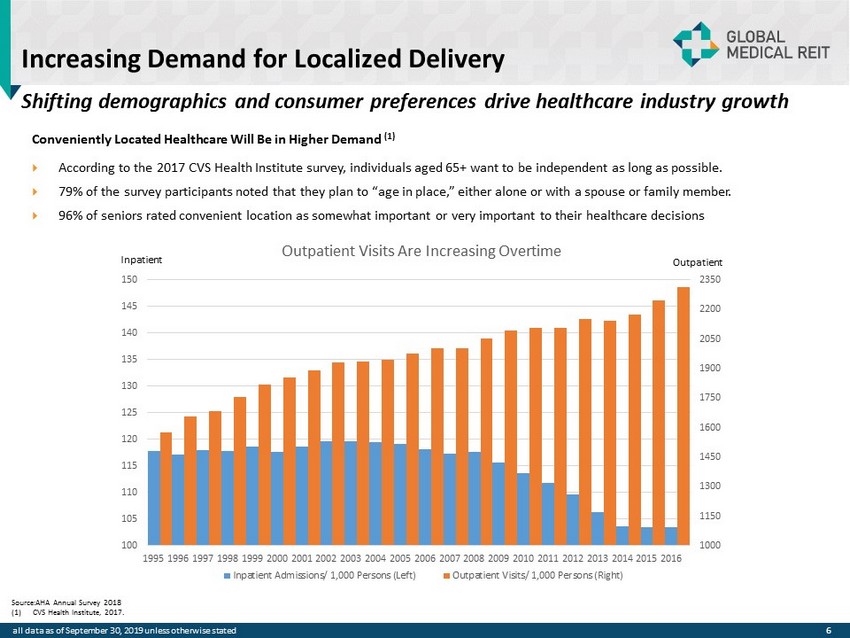
Increasing Demand for Localized Delivery Source:AHA Annual Survey 2018 (1) CVS Health Institute, 2017. Conveniently Located Healthcare Will Be in Higher Demand (1) According to the 2017 CVS Health Institute survey, individuals aged 65+ want to be independent as long as possible. 79% of the survey participants noted that they plan to “age in place,” either alone or with a spouse or family member. 96% of seniors rated convenient location as somewhat important or very important to their healthcare decisions 6 Shifting demographics and consumer preferences drive healthcare industry growth all data as of September 30, 2019 unless otherwise stated 1000 1150 1300 1450 1600 1750 1900 2050 2200 2350 100 105 110 115 120 125 130 135 140 145 150 1995 1996 1997 1998 1999 2000 2001 2002 2003 2004 2005 2006 2007 2008 2009 2010 2011 2012 2013 2014 2015 2016 Outpatient Visits Are Increasing Overtime Inpatient Admissions/ 1,000 Persons (Left) Outpatient Visits/ 1,000 Persons (Right) Inpatient Outpatient
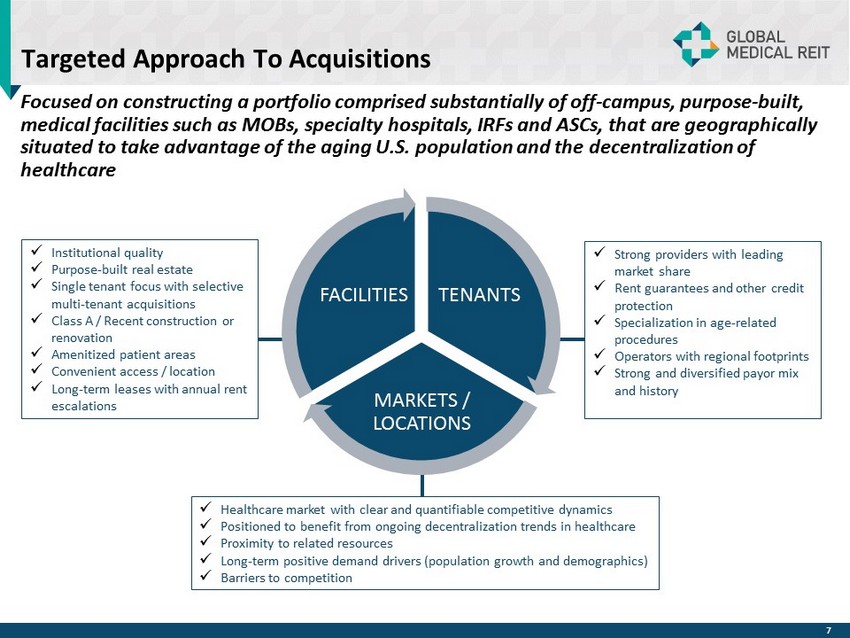
Targeted Approach To Acquisitions Focused on constructing a portfolio comprised substantially of off - campus, purpose - built, medical facilities such as MOBs, specialty hospitals, IRFs and ASCs, that are geographically situated to take advantage of the aging U.S. population and the decentralization of healthcare TENANTS MARKETS / LOCATIONS FACILITIES x Strong providers with leading market share x Rent guarantees and other credit protection x Specialization in age - related procedures x Operators with regional footprints x Strong and diversified payor mix and history x Institutional quality x Purpose - built real estate x Single tenant focus with selective multi - tenant acquisitions x Class A / Recent construction or renovation x Amenitized patient areas x Convenient access / location x Long - term leases with annual rent escalations x Healthcare market with clear and quantifiable competitive dynamics x Positioned to benefit from ongoing decentralization trends in healthcare x Proximity to related resources x Long - term positive demand drivers (population growth and demographics) x Barriers to competition 7
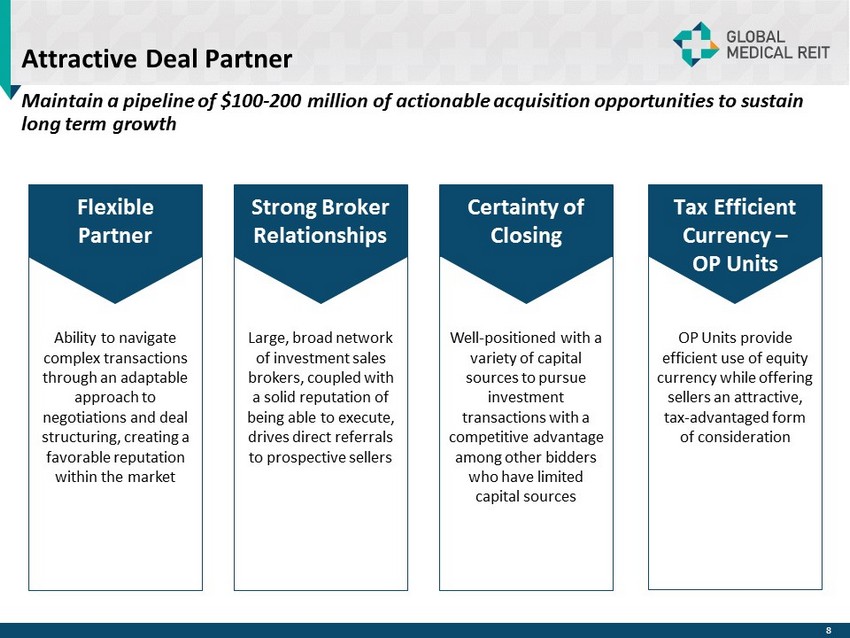
Attractive Deal Partner Maintain a pipeline of $100 - 200 million of actionable acquisition opportunities to sustain long term growth Ability to navigate complex transactions through an adaptable approach to negotiations and deal structuring, creating a favorable reputation within the market Large, broad network of investment sales brokers, coupled with a solid reputation of being able to execute, drives direct referrals to prospective sellers Well - positioned with a variety of capital sources to pursue investment transactions with a competitive advantage among other bidders who have limited capital sources OP Units provide efficient use of equity currency while offering sellers an attractive, tax - advantaged form of consideration 8 Flexible Partner Strong Broker Relationships Certainty of Closing Tax Efficient Currency – OP Units
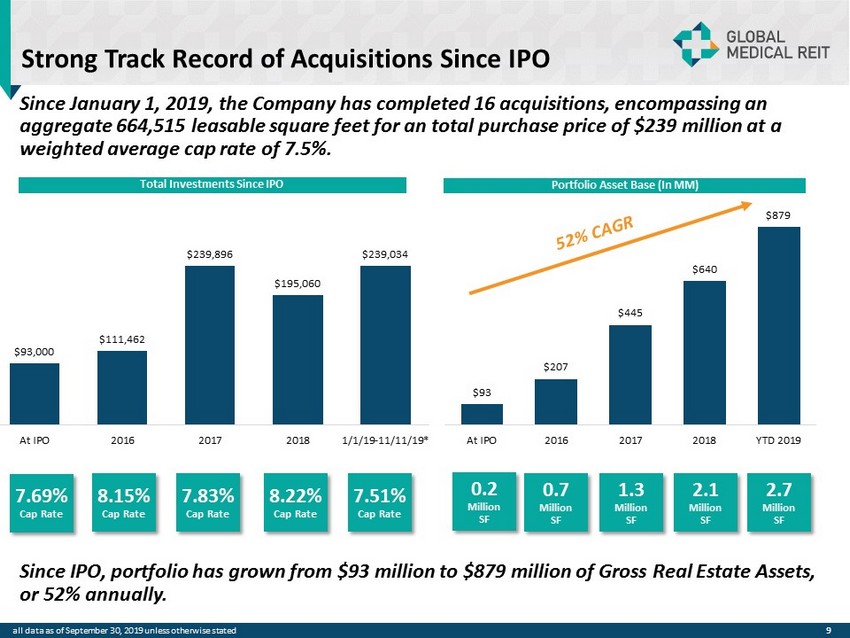
Strong Track Record of Acquisitions Since IPO Total Investments Since IPO Portfolio Asset Base (In MM) Since IPO, portfolio has grown from $93 million to $879 million of Gross Real Estate Assets, or 52% annually. 8.15% Cap Rate 7.83% Cap Rate 8.22% Cap Rate 7.51% Cap Rate 0.7 Million SF 1.3 Million SF 2.1 Million SF 2.7 Million SF Since January 1, 2019, the Company has completed 16 acquisitions, encompassing an aggregate 664,515 leasable square feet for an total purchase price of $239 million at a weighted average cap rate of 7.5%. 9 all data as of September 30, 2019 unless otherwise stated $93,000 $111,462 $239,896 $195,060 $239,034 At IPO 2016 2017 2018 1/1/19-11/11/19* 7.69% Cap Rate $93 $207 $445 $640 $879 At IPO 2016 2017 2018 YTD 2019 0.2 Million SF
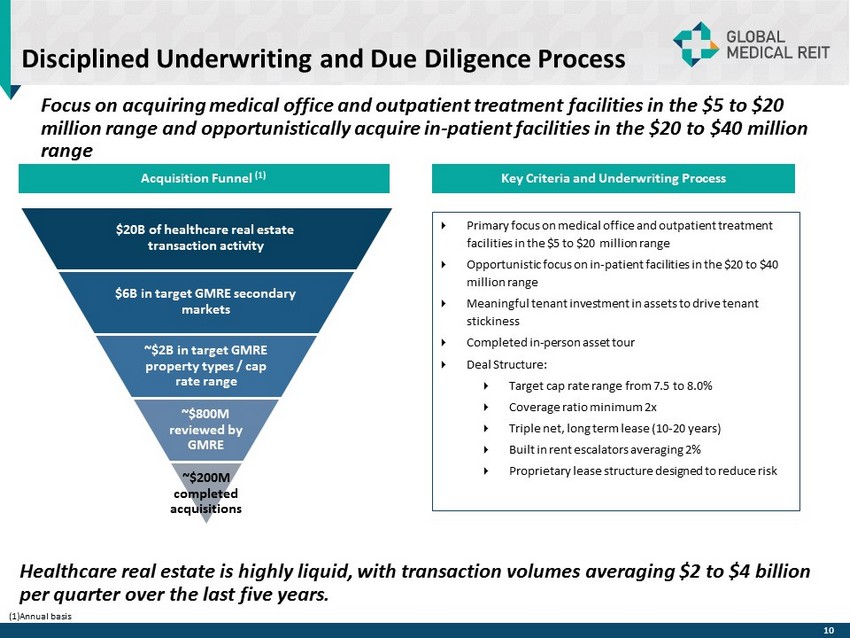
Disciplined Underwriting and Due Diligence Process Acquisition Funnel (1) Healthcare real estate is highly liquid, with transaction volumes averaging $2 to $4 billion per quarter over the last five years. Focus on acquiring medical office and outpatient treatment facilities in the $5 to $20 million range and opportunistically acquire in - patient facilities in the $20 to $40 million range 10 $20B of healthcare real estate transaction activity $6B in target GMRE secondary markets ~$2B in target GMRE property types / cap rate range ~$800M reviewed by GMRE ~$200M completed acquisitions Key Criteria and Underwriting Process Primary focus on medical office and outpatient treatment facilities in the $5 to $20 million range Opportunistic focus on in - patient facilities in the $20 to $40 million range Meaningful tenant investment in assets to drive tenant stickiness Completed in - person asset tour Deal Structure: Target cap rate range from 7.5 to 8.0% Coverage ratio minimum 2x Triple net, long term lease (10 - 20 years) Built in rent escalators averaging 2% Proprietary lease structure designed to reduce risk (1) Annual basis
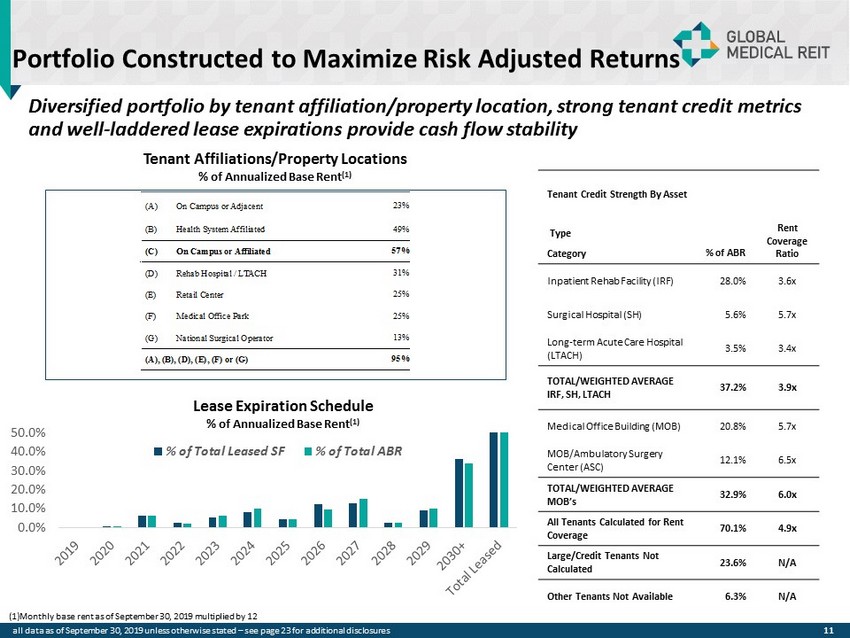
Portfolio Constructed to Maximize Risk Adjusted Returns 11 Tenant Credit Strength By Asset Type Category % of ABR Rent Coverage Ratio Inpatient Rehab Facility (IRF) 28.0% 3.6x Surgical Hospital (SH) 5.6% 5.7x Long - term Acute Care Hospital (LTACH) 3.5% 3.4x TOTAL/WEIGHTED AVERAGE IRF, SH, LTACH 37.2% 3.9x Medical Office Building (MOB) 20.8% 5.7x MOB/Ambulatory Surgery Center (ASC) 12.1% 6.5x TOTAL/WEIGHTED AVERAGE MOB’s 32.9% 6.0x All Tenants Calculated for Rent Coverage 70.1% 4.9x Large/Credit Tenants Not Calculated 23.6% N/A Other Tenants Not Available 6.3% N/A all data as of September 30, 2019 unless otherwise stated – see page 23 for additional disclosures Diversified portfolio by tenant affiliation/property location, strong tenant credit metrics and well - laddered lease expirations provide cash flow stability 0.0% 10.0% 20.0% 30.0% 40.0% 50.0% % of Total Leased SF % of Total ABR Tenant Affiliation or Property Location Category By Rent (A) On Campus or Adjacent 23% (B) Health System Affiliated 49% (C) On Campus or Affiliated 57% (D) Rehab Hospital / LTACH 31% (E) Retail Center 25% (F) Medical Office Park 25% (G) National Surgical Operator 13% (A), (B), (D), (E), (F) or (G) 95% Tenant Affiliations/Property Locations % of Annualized Base Rent (1) Lease Expiration Schedule % of Annualized Base Rent (1) (1) Monthly base rent as of September 30, 2019 multiplied by 12
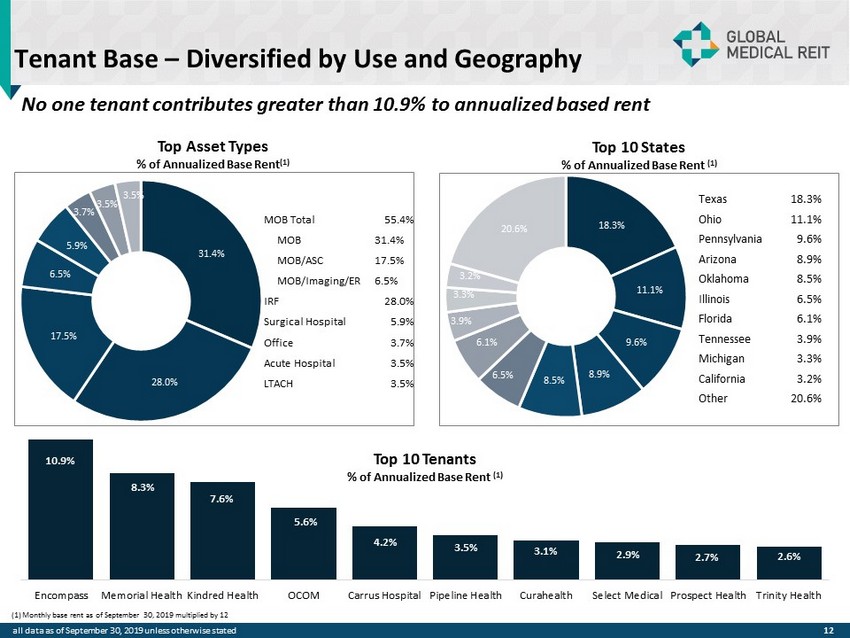
Tenant Base – Diversified by Use and Geography No one tenant contributes greater than 10.9% to annualized based rent 12 Top 10 States % of Annualized Base Rent (1) 31.4% 28.0% 17.5% 6.5% 5.9% 3.7% 3.5% 3.5% MOB Total 55.4% MOB 31.4% MOB/ASC 17.5% MOB/Imaging/ER 6.5% IRF 28.0% Surgical Hospital 5.9% Office 3.7% Acute Hospital 3.5% LTACH 3.5% Texas 18.3% Ohio 11.1% Pennsylvania 9.6% Arizona 8.9% Oklahoma 8.5% Illinois 6.5% Florida 6.1% Tennessee 3.9% Michigan 3.3% California 3.2% Other 20.6% (1) Monthly base rent as of September 30, 2019 multiplied by 12 Top 10 Tenants % of Annualized Base Rent (1) all data as of September 30, 2019 unless otherwise stated Top Asset Types % of Annualized Base Rent (1) 18.3% 11.1% 9.6% 8.9% 8.5% 6.5% 6.1% 3.9% 3.3% 3.2% 20.6% 10.9% 8.3% 7.6% 5.6% 4.2% 3.5% 3.1% 2.9% 2.7% 2.6% Encompass Memorial Health Kindred Health OCOM Carrus Hospital Pipeline Health Curahealth Select Medical Prospect Health Trinity Health
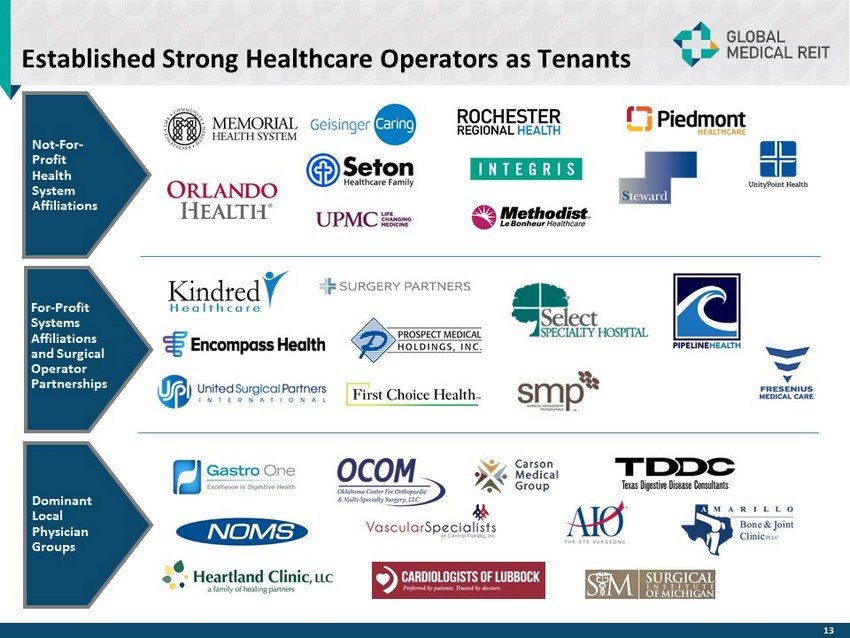
Established Strong Healthcare Operators as Tenants Not - For - Profit Health System Affiliations For - Profit Systems Affiliations and Surgical Operator Partnerships Dominant Local Physician Groups 13
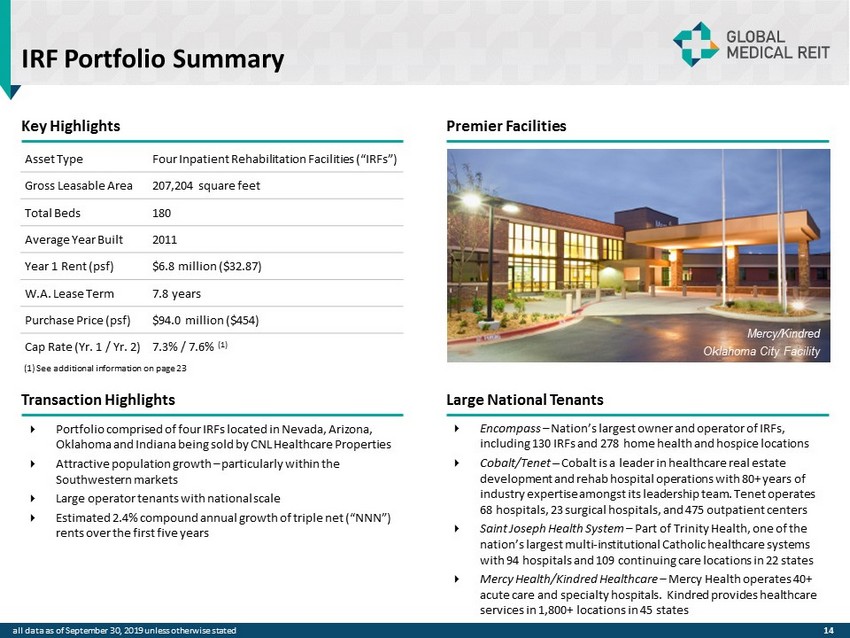
IRF Portfolio Summary Key Highlights Premier Facilities Transaction Highlights Large National Tenants Portfolio comprised of four IRFs located in Nevada, Arizona, Oklahoma and Indiana being sold by CNL Healthcare Properties Attractive population growth – particularly within the Southwestern markets Large operator tenants with national scale Estimated 2.4% compound annual growth of triple net (“NNN”) rents over the first five years Encompass – Nation’s largest owner and operator of IRFs, including 130 IRFs and 278 home health and hospice locations Cobalt/Tenet – Cobalt is a leader in healthcare real estate development and rehab hospital operations with 80+ years of industry expertise amongst its leadership team. Tenet operates 68 hospitals, 23 surgical hospitals, and 475 outpatient centers Saint Joseph Health System – Part of Trinity Health, one of the nation’s largest multi - institutional Catholic healthcare systems with 94 hospitals and 109 continuing care locations in 22 states Mercy Health/Kindred Healthcare – Mercy Health operates 40+ acute care and specialty hospitals. Kindred provides healthcare services in 1,800+ locations in 45 states Asset Type Four Inpatient Rehabilitation Facilities (“IRFs”) Gross Leasable Area 207,204 square feet Total Beds 180 Average Year Built 2011 Year 1 Rent (psf) $6.8 million ($32.87) W.A. Lease Term 7.8 years Purchase Price (psf) $94.0 million ($454) Cap Rate (Yr. 1 / Yr. 2) 7.3% / 7.6% (1) Mercy/Kindred Oklahoma City Facility 14 (1) See additional information on page 23 all data as of September 30, 2019 unless otherwise stated
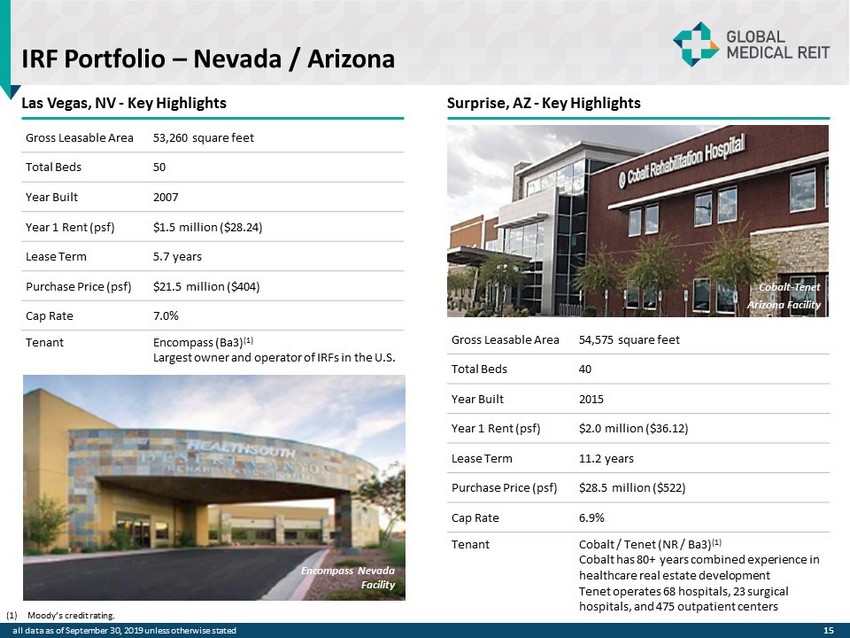
Las Vegas, NV - Key Highlights Surprise, AZ - Key Highlights Gross Leasable Area 53,260 square feet Total Beds 50 Year Built 2007 Year 1 Rent (psf) $1.5 million ($28.24) Lease Term 5.7 years Purchase Price (psf) $21.5 million ($404) Cap Rate 7.0% Tenant Encompass (Ba3) (1) Largest owner and operator of IRFs in the U.S. Gross Leasable Area 54,575 square feet Total Beds 40 Year Built 2015 Year 1 Rent (psf) $2.0 million ($36.12) Lease Term 11.2 years Purchase Price (psf) $28.5 million ($522) Cap Rate 6.9% Tenant Cobalt / Tenet (NR / Ba3) (1) Cobalt has 80+ years combined experience in healthcare real estate development Tenet operates 68 hospitals, 23 surgical hospitals, and 475 outpatient centers (1) Moody’s credit rating. 15 IRF Portfolio – Nevada / Arizona Encompass Nevada Facility Cobalt - Tenet Arizona Facility all data as of September 30, 2019 unless otherwise stated
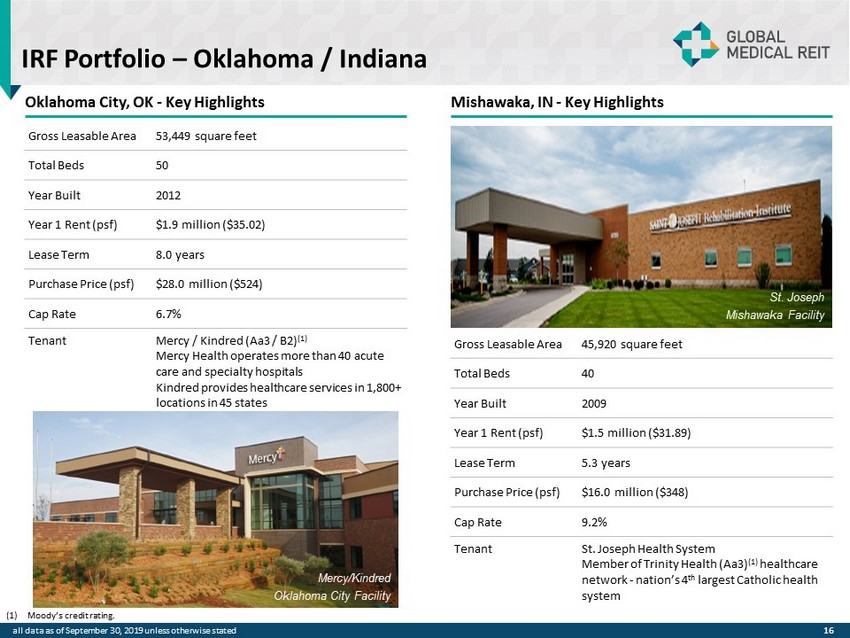
16 Oklahoma City, OK - Key Highlights Mishawaka, IN - Key Highlights Gross Leasable Area 53,449 square feet Total Beds 50 Year Built 2012 Year 1 Rent (psf) $1.9 million ($35.02) Lease Term 8.0 years Purchase Price (psf) $28.0 million ($524) Cap Rate 6.7% Tenant Mercy / Kindred (Aa3 / B2) (1) Mercy Health operates more than 40 acute care and specialty hospitals Kindred provides healthcare services in 1,800+ locations in 45 states Gross Leasable Area 45,920 square feet Total Beds 40 Year Built 2009 Year 1 Rent (psf) $1.5 million ($31.89) Lease Term 5.3 years Purchase Price (psf) $16.0 million ($348) Cap Rate 9.2% Tenant St. Joseph Health System Member of Trinity Health (Aa3) (1) healthcare network - nation’s 4 th largest Catholic health system (1) Moody’s credit rating. IRF Portfolio – Oklahoma / Indiana Mercy/Kindred Oklahoma City Facility St. Joseph Mishawaka Facility all data as of September 30, 2019 unless otherwise stated
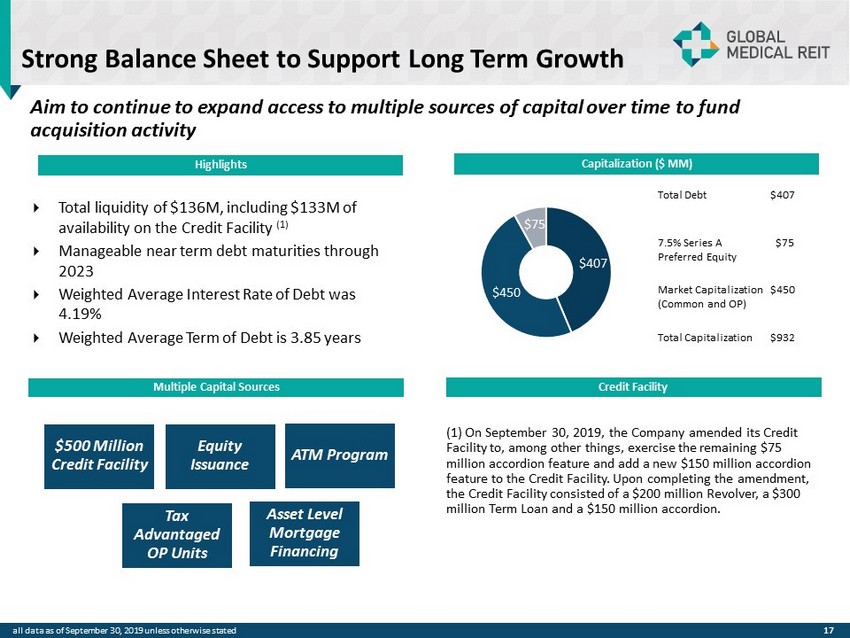
17 Strong Balance Sheet to Support Long Term Growth Mercy/Kindred Oklahoma City Facility Credit Facility Capitalization ($ MM) $407 $450 $75 Highlights Total liquidity of $136M, including $133M of availability on the Credit Facility (1) Manageable near term debt maturities through 2023 Weighted Average Interest Rate of Debt was 4.19% Weighted Average Term of Debt is 3.85 years Multiple Capital Sources Asset Level Mortgage Financing $500 Million Credit Facility Equity Issuance ATM Program Tax Advantaged OP Units Aim to continue to expand access to multiple sources of capital over time to fund acquisition activity Total Debt $407 7.5% Series A Preferred Equity $75 Market Capitalization (Common and OP) $450 Total Capitalization $932 all data as of September 30, 2019 unless otherwise stated (1) On September 30, 2019, the Company amended its Credit Facility to, among other things, exercise the remaining $75 million accordion feature and add a new $150 million accordion feature to the Credit Facility. Upon completing the amendment, the Credit Facility consisted of a $200 million Revolver, a $300 million Term Loan and a $150 million accordion.
Seasoned Leadership JEFFREY BUSCH , Chairman, Chief Executive Officer and President ROBERT KIERNAN , Chief Financial Officer and Treasurer ALFONZO LEON , Chief Investment Officer ▪ 17 + years of experience in real estate finance and has completed $ 3 billion of transactions ▪ Prior experience as principal at investment advisor to pension funds and investment banker representing healthcare systems, d eve lopers and REITs ▪ Healthcare real estate investment banker for Cain Brothers ▪ Acquired $ 800 million in multi - family, office, medical office, and industrial property on behalf of institutional investors while at LaSalle Investment DANICA HOLLEY, Chief Operating Officer ▪ 18 + years of management and business development experience ▪ More than a decade of experience managing multinational teams for complex service delivery across disciplines ▪ More than 8 years in healthcare programs and infrastructure as Executive Director of Safe Blood International ▪ 10+ years of experience with SEC compliance and reporting matters, corporate governance, investment banking and REIT - related ca pital markets ▪ Served as Associate General Counsel of FBR ▪ Prior role as Senior Associate – REIT Capital Markets at Hunton & Williams LLP, where he represented public REITs in conjunction with their SEC compliance requirements, corporate governance matters, offerings of equity and debt securities and merger and acquisition tra nsa ctions ▪ Previously with Sullivan & Cromwell LLP and KPMG JAMIE BARBER, General Counsel and Corporate Secretary ▪ 20+ years of experience in healthcare, real estate development, management and investment ▪ Former assistant to the U.S. Secretary of Housing & Urban Development ▪ United States Special Representative to United Nations in Geneva ▪ Developed a multitude of institutional quality real estate assets spanning several sectors including residential, commercial, ho spitality and retail ▪ 30+ years of experience in financial accounting, reporting and management, with extensive experience in SEC reporting and SOX co mpliance ▪ Served as the Senior Vice President, Controller and Chief Accounting Officer of FBR & Co. (“FBR”)(NASDAQ: FBRC) beginning in Oct ober 2007 ▪ Prior role as Senior Vice President, Controller and Chief Accounting Officer of Arlington Asset Investment Corp. (NYSE: AI) ▪ Previously Senior Manager in the assurance practice at Ernst & Young 18
Independent Directors Majority independent Board with strong backgrounds in healthcare, real estate and capital markets Henry Cole ▪ President of Global Development International, providing development support and oversight for initiatives in medical and hea lth care programs (e.g. Instant Labs Medical Diagnostics, MedPharm & MPRC Group) ▪ Former President and Founder of international programs at The Futures Group International, a healthcare consulting firm ▪ Director of International Health and Population Programs for GE’s Center for Advanced Studies ▪ Yale (B.S.); Johns Hopkins (MA) Matthew Cypher, Ph.D. ▪ Director of the Steers Center for Global Real Estate and Atara Kaufman Professor of Real Estate at Georgetown University’s Mc Don ough School of Business ▪ Former director at Invesco Real Estate (NYSE: IVR) where he was responsible for oversight of the Underwriting Group, which ac qui red $10.2 billion worth of institutional real estate ▪ Underwrote $1.5 billion of acquisitions and oversaw the Valuations group, which marked to market Invesco’s more than $13 bill ion North American portfolio ▪ Penn State University (B.S.); Texas A&M University (M.S. and Ph.D.) Lori Wittman ▪ Served as the Chief Financial Officer for Care Capital Properties, Inc . (NYSE : CCP) (“Care Capital”), a publicly - traded REIT which was originally formed as a spin - off from Ventas, Inc . (NYSE : VTR) (“Ventas”) and owned over 340 healthcare properties nationwide and had an enterprise value of approximately $ 3 . 5 billion prior to its acquisition by Sabra Healthcare in August 2017 ▪ University of Chicago (M . B . A . , Finance & Accounting) ; University of Pennsylvania (M . C . P . , Housing & Real Estate Finance) Clark University (B . A . ) Ronald Marston ▪ Founder and CEO of Health Care Corporation of America (HCCA) Management Company, originally a subsidiary of Hospital Corporation of America (HCA) ▪ 30 + years in international healthcare focused on healthcare systems with prior experience developing the Twelfth Evacuation Hospital in Vietnam ▪ Tennessee Technological University (B . S . ) ; California Western University (Ph . D . ) ▪ Rear Admiral (Retired) and Chief Veterinary Medical Officer of United States Public Health Service ▪ Former Assistant United States Surgeon General, point person for global development support with a focus on less developed countries ▪ Epidemic Intelligence Service Officer with the U . S . Centers for Disease Control and Prevention (CDC) ▪ Chief epidemiologist with the Centers of Devices and Radiological Health in the US Food and Drug Administration (FDA) ▪ Tuskegee University (B . S . & DVM) ; University in Michigan (M . P . H . ) ; Johns Hopkins University (Ph . D . ) Dr. Roscoe Moore Paula Crowley ▪ Current Chair Emeritus of Anchor Health Properties, previously Chairman of the Board from October 2015 through November 2017 ▪ Co - founder and former CEO of Anchor Health Properties which was sold to Brinkman Management and Development in October 2015 ▪ Prior to Anchor, spent eight year as Development Director with The Rouse Company of Columbia, Maryland ▪ University of Pennsylvania (M.B.A., Masters in City Planning); Middlebury College (B.A.) 19
Non - Independent Directors Jeffrey Busch, Chairman ▪ Over 20 years of experience in healthcare, real estate development, management and investment ▪ Former assistant to the U.S. Secretary of Housing & Urban Development ▪ United States Special Representative to United Nations in Geneva ▪ Developed large - scale residential, commercial, hospitality and retail properties Zhang Jingguo, Director ▪ Approximately 20 years experience in real estate development in China ▪ Serves as President of Henan Real Estate Chamber of Commerce ▪ Co - founder of Henan Zensun Real Estate, one of the top 100 property development companies in China ▪ Honored with many awards as an outstanding developer and contributor to the Henan real estate industry ▪ Supervisor for Henan Hongguang Real Estate Limited, a company engaged in property development in China ▪ Supervisor for Henan Zensun Corporate Development Company Limited, a company engaged in construction and management in China ▪ University College London (B . S) ; Beijing Forestry University (B . S) ; University of Leicester (MA) ; Zhang Huiqi, Director 20
APPENDIX
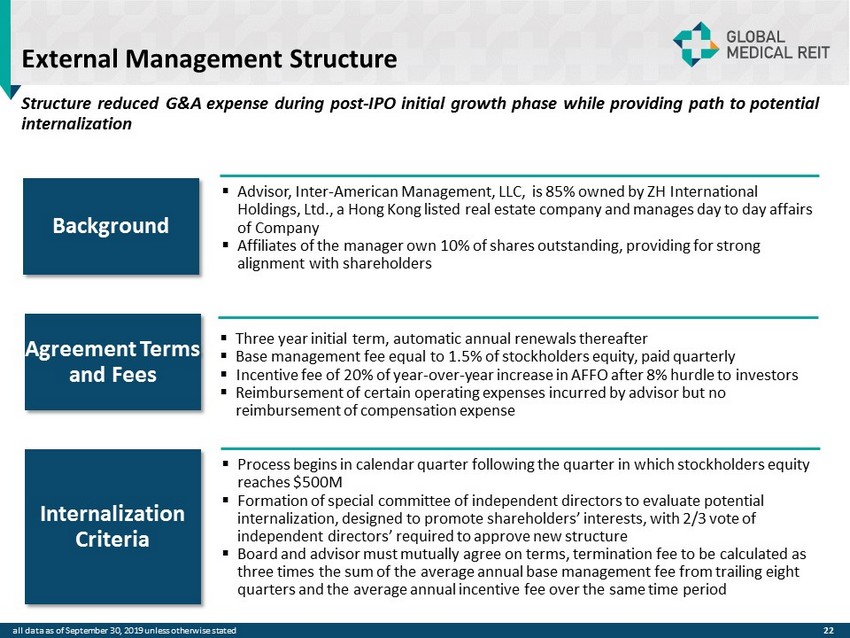
External Management Structure Structure reduced G&A expense during post - IPO initial growth phase while providing path to potential internalization ▪ Advisor, Inter - American Management, LLC, is 85% owned by ZH International Holdings, Ltd., a Hong Kong listed real estate company and manages day to day affairs of Company ▪ Affiliates of the manager own 10% of shares outstanding, providing for strong alignment with shareholders 22 Background Agreement Terms and Fees ▪ Three year initial term, automatic annual renewals thereafter ▪ Base management fee equal to 1.5% of stockholders equity, paid quarterly ▪ Incentive fee of 20% of year - over - year increase in AFFO after 8% hurdle to investors ▪ Reimbursement of certain operating expenses incurred by advisor but no reimbursement of compensation expense Internalization Criteria ▪ Process begins in calendar quarter following the quarter in which stockholders equity reaches $500M ▪ Formation of special committee of independent directors to evaluate potential internalization, designed to promote shareholders’ interests, with 2/3 vote of independent directors’ required to approve new structure ▪ Board and advisor must mutually agree on terms, termination fee to be calculated as three times the sum of the average annual base management fee from trailing eight quarters and the average annual incentive fee over the same time period all data as of September 30, 2019 unless otherwise stated all data as of September 30, 2019 unless otherwise stated
Disclosures 23 Portfolio Snapshot (see page 3 ) Annualized Base Rent (ABR) represents monthly base rent at September 30, 2019 (or estimated NOI for cCare , East Lansing, Bannockburn, and Mission Health properties) multiplied by 12 . Accordingly, this methodology produces an annualized amount as of a point in time but does not take into account future contractual rental rate increases. Rent Coverage Ratio (see pages 3 and 11 ) For purposes of calculating our portfolio weighted - average EBITDARM coverage ratio (“Rent Coverage Ratio”), we excluded medical office buildings and other non - hospital tenants that are themselves credit rated or are subsidiaries of credit - rated health systems . These ratios are based on latest available information only, some of which may be more than one year old . Most tenant financial statements are unaudited and we have not independently verified any tenant financial information (audited or unaudited) and, therefore, we cannot assure you that such information is accurate or complete . Certain tenants (approximately 6 % of our portfolio) are excluded from the calculation due to lack of available financial information or, with respect to the City Hospital at White Rock and Star Medical Center properties, a lack of relevant operating history with a new tenant operator . Additionally, certain components of our Rent Coverage Ratio include management assumptions to adjust for differences in tenant businesses, accounting and reporting practices, including, but not limited to, adjustments (i) for non - cash charges, (ii) for physician distributions and compensation, (iii) for differences in fiscal year, (iv) for changes in financial statement presentation and (v) for straight - line rent . Management believes that all adjustments are reasonable and necessary . IRF Portfolio Summary Year 2 Cap . Rate (see pages 15 and 16 ) Calculated by dividing the year two annualized base rent (total of monthly base rent during month of contractual rent increase at each property times 12 ) by the allocated price of each IRF, for an aggregate of $ 94 million . The rent escalation terms for each of the facilities is as follows : (i) 2 . 0 % annual increase effective January 1 , 2020 for the South Bend facility ; (ii) 2 . 5 % annual increase effective October 1 , 2019 for the Oklahoma City facility ; (iii) annual increase effective January 1 , 2020 of the greater of (a) 2 % or (b) the CPI Index, not to exceed 3 % , for the Surprise facility (assumed CPI of 2 . 5 % in 2020 for purposes of the table above) ; (iv) increase effective June 1 , 2020 equal to the lesser of (a) the percentage increase in the CPI - U (All Urban Consumers) during the preceding 5 - year period (May 2015 and May 2020 ), or (b) 15 % (assumed CPI of 1 . 5 % and 2 . 5 % in 2019 and 2020 , respectively, for purposes of the table above) for the Las Vegas facility . The rent escalation at the Las Vegas facility occurs every five years during the lease term . all data as of September 30, 2019 unless otherwise stated
Evelyn Infurna Evelyn.Infurna@icrinc.com 203.682.8265 Kara Smith Kara.Smith@icrinc.com 646 - 277 - 1211 INVESTOR RELATIONS