Exhibit 99.2
First Quarter 2020 Earnings Supplemental Three Months Ended March 31, 2020 www.globalmedicalreit.com NYSE: GMRE
Corporate Information and Analyst Coverage Executive Team Jeffrey Busch Chief Executive Officer, Chairman and President Alfonzo Leon Chief Investment Officer Danica Holley Chief Operating Officer Bob Kiernan Chief Financial Officer and Treasurer Jamie Barber General Counsel and Corporate Secretary Allen Webb Senior VP, SEC Reporting and Technical Accounting Board of Directors Jeffrey Busch Chief Executive Officer, Chairman and President Henry Cole Lead Independent Director and Compensation Committee Chair Paula Crowley Director Matthew Cypher, Ph.D. Investment Committee Chair Zhang Huiqi Director Zhang Jingguo Director Ronald Marston Nominating and Corporate Governance Committee Chair Dr. Roscoe Moore Director Lori Wittman Audit Committee Chair Sell - Side Analyst Coverage Firm Name Email Phone B. Riley FBR Bryan Maher bmaher@brileyfbr.com 646.885.5423 Compass Point Merrill Ross mross@compasspointllc.com 202.534.1392 D.A. Davidson Barry Oxford Jr., CFA boxford@dadco.com 212.240.9871 Janney Robert Stevenson robstevenson@janney.com 646.448.3028 National Securities Gaurav Mehta gmehta@yournational.com 212.417.8008 2 1Q - 2020| Earnings Supplemental Corporate Information Corporate Headquarters Stock Exchange Listing Transfer Agent Investor Relations 2 Bethesda Metro Center, Suite 440 New York Stock Exchange American Stock Transfer & Trust Company Evelyn Infurna – Evelyn.Infurna@icrinc.com ; 203.682.8265 Bethesda, MD 20814 Ticker: GMRE 800.937.5449
Select Quarterly Financial Data (unaudited, and in thousands, except per share and unit amounts) 3 1Q - 2020| Earnings Supplemental * See Page 8 for a reconciliation of non - GAAP financial measures for Funds from Operations (FFO) and Adjusted Funds from Operations (AFFO). March 31, December 31, September 30, June 30, March 31, As of Period End (unless otherwise specified) 2020 2019 2019 2019 2019 Market capitalization (common and OP) $ 475,346 $ 621,135 $ 449,536 $ 396,858 $ 370,194 Market price per share - common $ 10.12 $ 13.23 $ 11.40 $ 10.50 $ 9.82 Common stock and OP units outstanding 46,971 46,949 39,433 37,796 37,698 Preferred equity $ 74,959 $ 74,959 $ 74,959 $ 74,959 $ 74,959 Common equity $ 340,642 $ 355,311 $ 266,029 $ 256,217 $ 265,261 Noncontrolling interest $ 23,189 $ 30,083 $ 30,455 $ 30,427 $ 30,342 Total stockholders' equity $ 438,790 $ 460,353 $ 371,443 $ 361,603 $ 370,562 Investment in real estate, gross $ 974,688 $ 905,529 $ 830,446 $ 763,601 $ 668,931 Borrowings: Credit Facility - revolver, gross $ 129,450 $ 51,350 $ 67,225 $ 144,475 $ 123,675 Credit Facility - term loan, gross $ 300,000 $ 300,000 $ 300,000 $ 175,000 $ 100,000 Notes payable, gross $ 39,282 $ 39,317 $ 39,352 $ 39,385 $ 39,418 Weighted average interest rate for quarter 3.81% 3.87% 4.21% 4.27% 4.67% Debt Covenants (as defined in Credit Facility): Leverage ratio (up to 60% allowed) 47.7% 43.0% 48.8% 46.7% 39.2% Fixed charge coverage ratio (1.50x minimum allowed) 2.38 2.22 2.09 2.01 1.94 Three Months Ended Rental revenue $ 21,533 $ 20,385 $ 18,117 $ 16,835 $ 15,141 Interest expense $ 4,378 $ 4,765 $ 4,549 $ 4,132 $ 4,025 Management fees - related party $ 2,002 $ 1,727 $ 1,621 $ 1,584 $ 1,334 G&A expenses $ 1,839 $ 1,608 $ 1,681 $ 1,640 $ 1,606 Depreciation and amortization expenses $ 7,757 $ 7,397 $ 6,506 $ 5,863 $ 4,869 Operating expenses $ 2,303 $ 2,132 $ 1,362 $ 1,143 $ 1,323 Total expenses $ 18,832 $ 17,677 $ 15,887 $ 14,418 $ 13,157 Net income attributable to common stockholders $ 1,255 $ 1,212 $ 770 $ 904 $ 528 Net income per share $ 0.03 $ 0.03 $ 0.02 $ 0.03 $ 0.02 Wtd . avg. basic and diluted common shares (GAAP) 44,182 37,876 35,512 34,559 27,380 FFO * $ 9,119 $ 8,717 $ 7,359 $ 6,870 $ 5,457 FFO per share and unit * $ 0.19 $ 0.21 $ 0.19 $ 0.18 $ 0.17 AFFO* $ 9,599 $ 8,675 $ 7,498 $ 6,836 $ 5,394 AFFO per share and unit* $ 0.20 $ 0.21 $ 0.19 $ 0.18 $ 0.17 Wtd . avg. common shares, OP and LTIP units 47,874 41,794 39,449 38,487 31,206
First Quarter Highlights 4 1Q - 2020| Earnings Supplemental OPERATING HIGHLIGHTS • First quarter 2020 total revenue of $ 21 . 6 million, increased 42 . 4 % compared to the prior year period . • Quarterly net income per share of $ 0 . 03 on a diluted basis . • Funds from Operations (“FFO ”) of $ 0.19 per share and unit for the first quarter of 2020, as compared to $ 0.17 per share and unit for the prior year period. • Adjusted Funds from Operations (“AFFO”) of $ 0.20 per share and unit for the first quarter of 2020, as compared to $ 0.17 per share and unit in the prior year period. COMMON AND PREFERRED DIVIDENDS • On March 3 , 20 20 , the Board of Directors declared: • $0.20 per share cash dividend to common stockholders of record as of March 2 5 , 20 20 , which was paid on April 9 , 20 20 . • $0.46875 per share cash dividend to holders of record as of April 15, 20 20 of its Series A Preferred Stock, which was paid on April 3 0 , 20 20 . ACQUISITION ACTIVITY • During the first quarter of 2020 , the Company completed four acquisitions, encompassing an aggregate 341 , 731 leasable square feet, for an aggregate purchase price of $ 67 . 6 million with a weighted average cap rate of 8 . 3 % . • From April 1 , 2020 through May 6 , 2020 , the Company acquired one additional property, encompassing 99 , 718 leasable square feet, for a price of $ 19 . 3 million with a weighted average cap . rate of 8 . 8 % . CAPITAL MARKETS AND DEBT ACTIVITY • In connection with the acquisition completed subsequent to April 1 , 2020 , the Company assumed a $ 12 . 1 million CMBS loan with an interest rate of 4 . 62 % and term of four years . COVID - 19 UPDATE • As of May 6 , 2020 , the Company collected 96 % of April rent and 76 % of May rent . • Due to the COVID - 19 pandemic, we have entered into, or expect to enter into, rent deferment agreements with certain tenants . Currently , we estimate that $ 2 million of rent that ordinarily would have been collected over the months of April through July will be deferred and is now expected to be collected primarily over the period from July through December 2020 . • We also have entered into, or expect to enter into, other agreements with certain tenants whereby we have either (i) agreed to short - term rent reductions in exchange for extended lease terms or (ii) agreed to apply certain deposits or committed tenant improvement funds towards rent, the net effect of which is immaterial to our financial results . • Because the extent of the impact of COVID - 19 on the Company’s tenants will depend on future developments, there can be no assurance that our tenants will be able meet the requirements of these agreements, or that these tenants, or other tenants, may not seek additional relief in the future . FIRST QUARTER 2020 AND SUBSEQUENT PERIOD HIGHLIGHTS
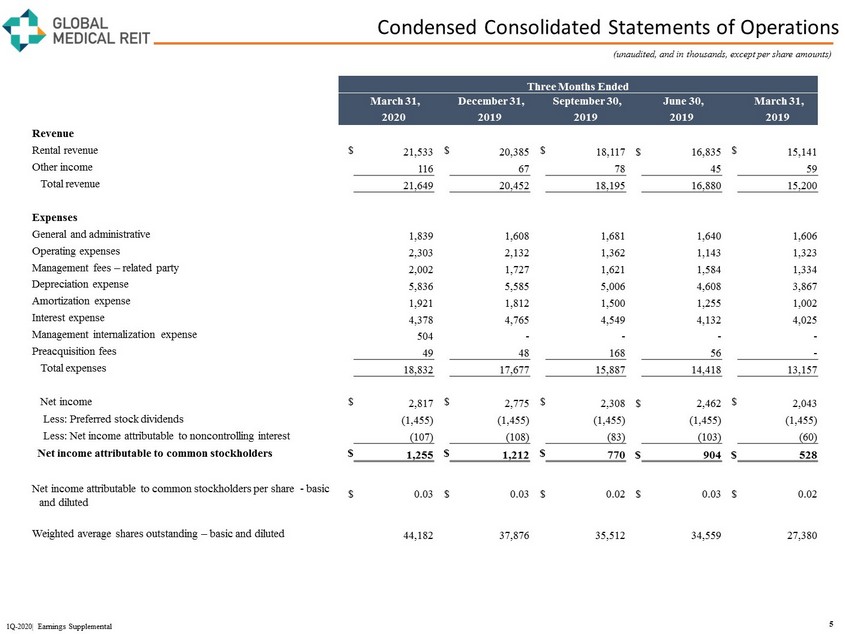
Condensed Consolidated Statements of Operations 5 Three Months Ended March 31, December 31, September 30, June 30, March 31, 2020 2019 2019 2019 2019 Revenue Rental revenue $ 21,533 $ 20,385 $ 18,117 $ 16,835 $ 15,141 Other income 116 67 78 45 59 Total revenue 21,649 20,452 18,195 16,880 15,200 Expenses General and administrative 1,839 1,608 1,681 1,640 1,606 Operating expenses 2,303 2,132 1,362 1,143 1,323 Management fees – related party 2,002 1,727 1,621 1,584 1,334 Depreciation expense 5,836 5,585 5,006 4,608 3,867 Amortization expense 1,921 1,812 1,500 1,255 1,002 Interest expense 4,378 4,765 4,549 4,132 4,025 Management internalization expense 504 - - - - Preacquisition fees 49 48 168 56 - Total expenses 18,832 17,677 15,887 14,418 13,157 Net income $ 2,817 $ 2,775 $ 2,308 $ 2,462 $ 2,043 Less: Preferred stock dividends ( 1,455) (1,455) (1,455) (1,455) (1,455) Less: Net income attributable to noncontrolling interest ( 107) (108) (83) (103) (60) Net income attributable to common stockholders $ 1,255 $ 1,212 $ 770 $ 904 $ 528 Net income attributable to common stockholders per share - basic and diluted $ 0.03 $ 0.03 $ 0.02 $ 0.03 $ 0.02 Weighted average shares outstanding – basic and diluted 44,182 37,876 35,512 34,559 27,380 1Q - 2020| Earnings Supplemental (unaudited, and in thousands, except per share amounts)
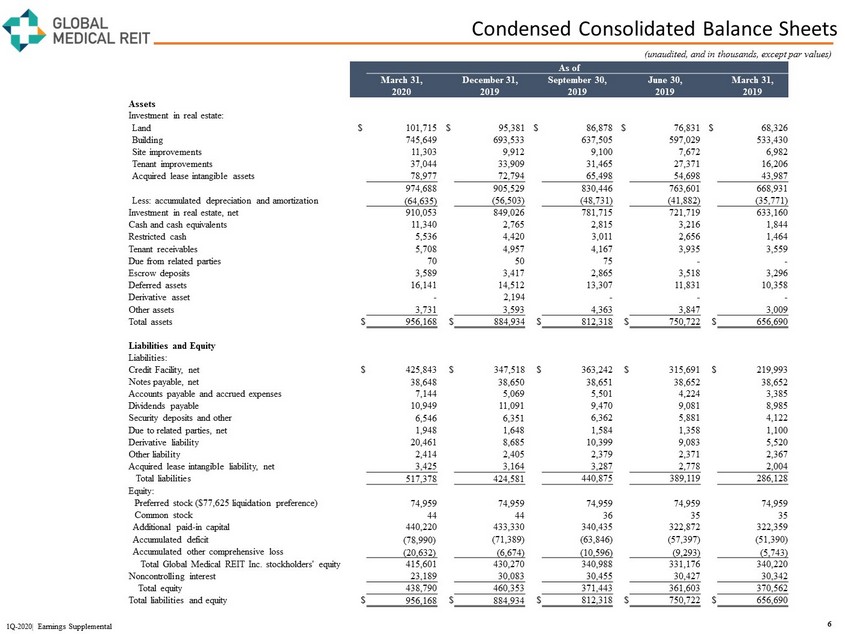
Condensed Consolidated Balance Sheets 6 1Q - 2020| Earnings Supplemental As of March 31, December 31, September 30, June 30, March 31, 2020 2019 2019 2019 2019 Assets Investment in real estate: Land $ 101,715 $ 95,381 $ 86,878 $ 76,831 $ 68,326 Building 745,649 693,533 637,505 597,029 533,430 Site improvements 11,303 9,912 9,100 7,672 6,982 Tenant improvements 37,044 33,909 31,465 27,371 16,206 Acquired lease intangible assets 78,977 72,794 65,498 54,698 43,987 974,688 905,529 830,446 763,601 668,931 Less: accumulated depreciation and amortization ( 64,635) (56,503) (48,731) (41,882) (35,771) Investment in real estate, net 910,053 849,026 781,715 721,719 633,160 Cash and cash equivalents 11,340 2,765 2,815 3,216 1,844 Restricted cash 5,536 4,420 3,011 2,656 1,464 Tenant receivables 5,708 4,957 4,167 3,935 3,559 Due from related parties 70 50 75 - - Escrow deposits 3,589 3,417 2,865 3,518 3,296 Deferred assets 16,141 14,512 13,307 11,831 10,358 Derivative asset - 2,194 - - - Other assets 3,731 3,593 4,363 3,847 3,009 Total assets $ 956,168 $ 884,934 $ 812,318 $ 750,722 $ 656,690 Liabilities and Equity Liabilities: Credit Facility , net $ 425,843 $ 347,518 $ 363,242 $ 315,691 $ 219,993 Notes payable, net 38,648 38,650 38,651 38,652 38,652 Accounts payable and accrued expenses 7,144 5,069 5,501 4,224 3,385 Dividends payable 10,949 11,091 9,470 9,081 8,985 Security deposits and other 6,546 6,351 6,362 5,881 4,122 Due to related parties, net 1,948 1,648 1,584 1,358 1,100 Derivative liability 20,461 8,685 10,399 9,083 5,520 Other liability 2,414 2,405 2,379 2,371 2,367 Acquired lease intangible liability, net 3,425 3,164 3,287 2,778 2,004 Total liabilities 517,378 424,581 440,875 389,119 286,128 Equity : Preferred stock ($77,625 liquidation preference) 74,959 74,959 74,959 74,959 74,959 Common stock 44 44 36 35 35 Additional paid - in capital 440,220 433,330 340,435 322,872 322,359 Accumulated deficit ( 78,990) (71,389) (63,846) (57,397) (51,390) Accumulated other comprehensive loss ( 20,632) ( 6,674) ( 10,596) ( 9,293) ( 5,743) Total Global Medical REIT Inc. stockholders' equity 415,601 430,270 340,988 331,176 340,220 Noncontrolling interest 23,189 30,083 30,455 30,427 30,342 Total equity 438,790 460,353 371,443 361,603 370,562 Total liabilities and equity $ 956,168 $ 884,934 $ 812,318 $ 750,722 $ 656,690 (unaudited, and in thousands, except par values)
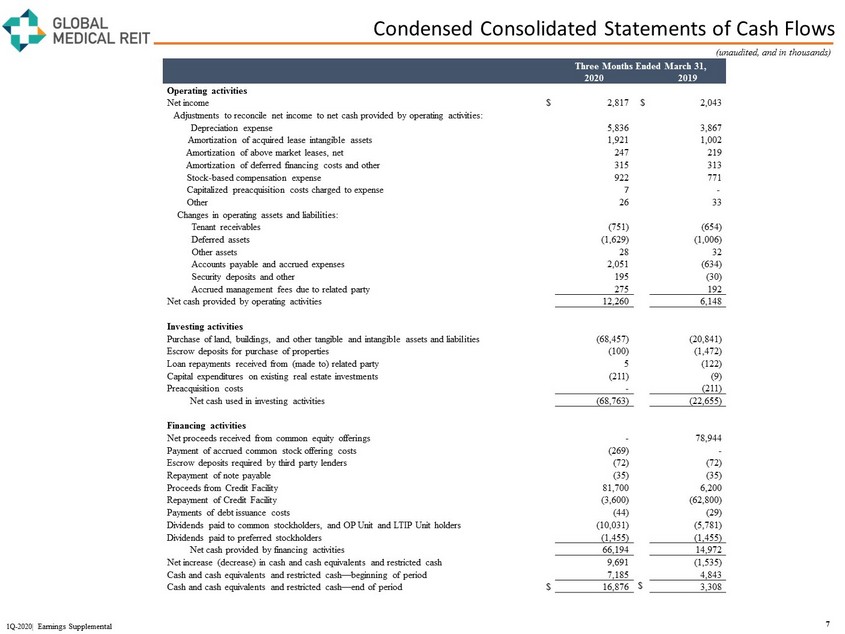
Condensed Consolidated Statements of Cash Flows 7 1Q - 2020| Earnings Supplemental Three Months Ended March 31, 2020 2019 Operating activities Net income $ 2,817 $ 2,043 Adjustments to reconcile net income to net cash provided by operating activities: Depreciation expense 5,836 3,867 Amortization of acquired lease intangible assets 1,921 1,002 Amortization of above market leases, net 247 219 Amortization of deferred financing costs and other 315 313 Stock - based compensation expense 922 771 Capitalized preacquisition costs charged to expense 7 - Other 26 33 Changes in operating assets and liabilities: Tenant receivables (751) (654) Deferred assets (1,629) (1,006) Other assets 28 32 Accounts payable and accrued expenses 2,051 (634) Security deposits and other 195 (30) Accrued management fees due to related party 275 192 Net cash provided by operating activities 12,260 6,148 Investing activities Purchase of land, buildings, and other tangible and intangible assets and liabilities ( 68,457) (20,841) Escrow deposits for purchase of properties (100) (1,472) Loan repayments received from (made to) related party 5 (122) Capital expenditures on existing real estate investments (211) (9) Preacquisition costs - (211) Net cash used in investing activities ( 68,763) (22,655) Financing activities Net proceeds received from common equity offerings - 78,944 Payment of accrued common stock offering costs (269) - Escrow deposits required by third party lenders (72) (72) Repayment of note payable (35) (35) Proceeds from Credit Facility 81,700 6,200 Repayment of Credit Facility (3,600) (62,800) Payments of debt issuance costs (44) (29) Dividends paid to common stockholders, and OP Unit and LTIP Unit holders (10,031) (5,781) Dividends paid to preferred stockholders (1,455) (1,455) Net cash provided by financing activities 66,194 14,972 Net increase (decrease) in cash and cash equivalents and restricted cash 9,691 (1,535) Cash and cash equivalents and restricted cash — beginning of period 7,185 4,843 Cash and cash equivalents and restricted cash — end of period $ 16,876 $ 3,308 (unaudited, and in thousands)
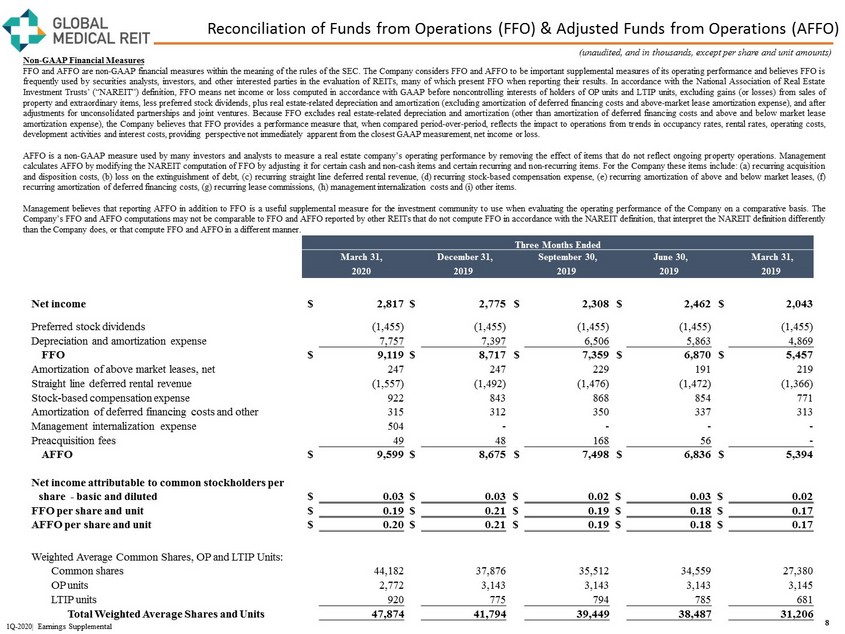
Reconciliation of Funds from Operations (FFO) & Adjusted Funds from Operations (AFFO) Non - GAAP Financial Measures FFO and AFFO are non - GAAP financial measures within the meaning of the rules of the SEC . The Company considers FFO and AFFO to be important supplemental measures of its operating performance and believes FFO is frequently used by securities analysts, investors, and other interested parties in the evaluation of REITs, many of which present FFO when reporting their results . In accordance with the National Association of Real Estate Investment Trusts’ (“NAREIT”) definition, FFO means net income or loss computed in accordance with GAAP before noncontrolling interests of holders of OP units and LTIP units, excluding gains (or losses) from sales of property and extraordinary items, less preferred stock dividends, plus real estate - related depreciation and amortization (excluding amortization of deferred financing costs and above - market lease amortization expense), and after adjustments for unconsolidated partnerships and joint ventures . Because FFO excludes real estate - related depreciation and amortization (other than amortization of deferred financing costs and above and below market lease amortization expense), the Company believes that FFO provides a performance measure that, when compared period - over - period, reflects the impact to operations from trends in occupancy rates, rental rates, operating costs, development activities and interest costs, providing perspective not immediately apparent from the closest GAAP measurement, net income or loss . AFFO is a non - GAAP measure used by many investors and analysts to measure a real estate company’s operating performance by removing the effect of items that do not reflect ongoing property operations . Management calculates AFFO by modifying the NAREIT computation of FFO by adjusting it for certain cash and non - cash items and certain recurring and non - recurring items . For the Company these items include : (a) recurring acquisition and disposition costs, (b) loss on the extinguishment of debt, (c) recurring straight line deferred rental revenue, (d) recurring stock - based compensation expense, (e) recurring amortization of above and below market leases, (f) recurring amortization of deferred financing costs, (g) recurring lease commissions, (h) management internalization costs and (i) other items . Management believes that reporting AFFO in addition to FFO is a useful supplemental measure for the investment community to use when evaluating the operating performance of the Company on a comparative basis . The Company’s FFO and AFFO computations may not be comparable to FFO and AFFO reported by other REITs that do not compute FFO in accordance with the NAREIT definition, that interpret the NAREIT definition differently than the Company does, or that compute FFO and AFFO in a different manner . 8 1Q - 2020| Earnings Supplemental Three Months Ended March 31, December 31, September 30, June 30, March 31, 2020 2019 2019 2019 2019 Net income $ 2,817 $ 2,775 $ 2,308 $ 2,462 $ 2,043 Preferred stock dividends (1,455) (1,455) (1,455) (1,455) (1,455) Depreciation and amortization expense 7,757 7,397 6,506 5,863 4,869 FFO $ 9,119 $ 8,717 $ 7,359 $ 6,870 $ 5,457 Amortization of above market leases, net 247 247 229 191 219 Straight line deferred rental revenue (1,557) (1,492) (1,476) (1,472) (1,366) Stock - based compensation expense 922 843 868 854 771 Amortization of deferred financing costs and other 315 312 350 337 313 Management internalization expense 504 - - - - Preacquisition fees 49 48 168 56 - AFFO $ 9,599 $ 8,675 $ 7,498 $ 6,836 $ 5,394 Net income attributable to common stockholders per share - basic and diluted $ 0.03 $ 0.03 $ 0.02 $ 0.03 $ 0.02 FFO per share and unit $ 0.19 $ 0.21 $ 0.19 $ 0.18 $ 0.17 AFFO per share and unit $ 0.20 $ 0.21 $ 0.19 $ 0.18 $ 0.17 Weighted Average Common Shares, OP and LTIP Units: Common shares 44,182 37,876 35,512 34,559 27,380 OP units 2,772 3,143 3,143 3,143 3,145 LTIP units 920 775 794 785 681 Total Weighted Average Shares and Units 47,874 41,794 39,449 38,487 31,206 (unaudited, and in thousands, except per share and unit amounts)
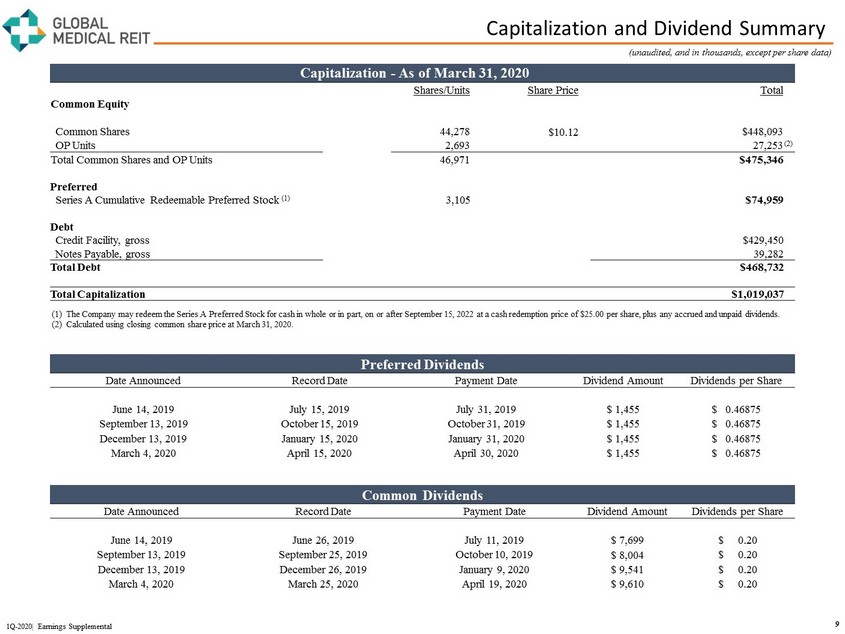
Capitalization and Dividend Summary 9 1Q - 2020| Earnings Supplemental Capitalization - As of March 31, 2020 Shares/Units Share Price Total Common Equity Common Shares 44,278 $10.12 $448,093 OP Units 2,693 27,253 (2) Total Common Shares and OP Units 46,971 $475,346 Preferred Series A Cumulative Redeemable Preferred Stock (1) 3,105 $74,959 Debt Credit Facility, gross $429,450 Notes Payable, gross 39,282 Total Debt $468,732 Total Capitalization $1,019,037 (1) The Company may redeem the Series A Preferred Stock for cash in whole or in part, on or after September 15, 2022 at a cash redemp tio n price of $25.00 per share, plus any accrued and unpaid dividends . (2) Calculated using closing common share price at March 31, 2020. (unaudited, and in thousands, except per share data) Preferred Dividends Date Announced Record Date Payment Date Dividend Amount Dividends per Share June 14, 2019 July 15, 2019 July 31, 2019 $ 1,455 $ 0.46875 September 13, 2019 October 15, 2019 October 31, 2019 $ 1,455 $ 0.46875 December 13, 2019 January 15, 2020 January 31, 2020 $ 1,455 $ 0.46875 March 4, 2020 April 15, 2020 April 30, 2020 $ 1,455 $ 0.46875 Common Dividends Date Announced Record Date Payment Date Dividend Amount Dividends per Share June 14, 2019 June 26, 2019 July 11, 2019 $ 7,699 $ 0.20 September 13, 2019 September 25, 2019 October 10, 2019 $ 8,004 $ 0.20 December 13, 2019 December 26, 2019 January 9, 2020 $ 9,541 $ 0.20 March 4, 2020 March 25, 2020 April 19, 2020 $ 9,610 $ 0.20
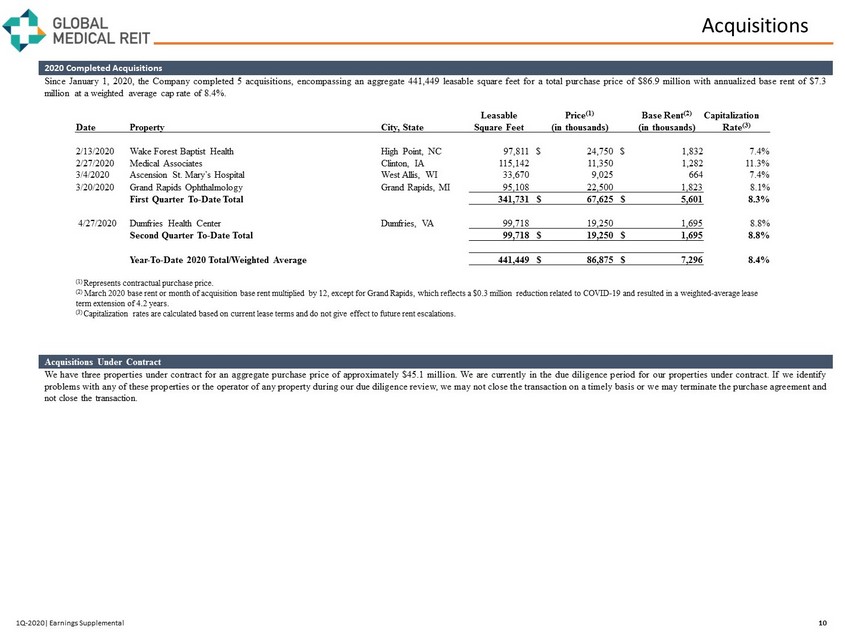
Acquisitions 2020 Completed Acquisitions Since January 1 , 2020 , the Company completed 5 acquisitions, encompassing an aggregate 441 , 449 leasable square feet for a total purchase price of $ 86 . 9 million with annualized base rent of $ 7 . 3 million at a weighted average cap rate of 8 . 4 % . 10 1Q - 2020| Earnings Supplemental Leasable Price (1) Base Rent (2) Capitalization Date Property City, State Square Feet (in thousands) (in thousands) Rate (3) 2/13/2020 Wake Forest Baptist Health High Point, NC 97,811 $ 24,750 $ 1,832 7.4% 2/27/2020 Medical Associates Clinton, IA 115,142 11,350 1,282 11.3% 3/4/2020 Ascension St. Mary’s Hospital West Allis, WI 33,670 9,025 664 7.4% 3/20/2020 Grand Rapids Ophthalmology Grand Rapids, MI 95,108 22,500 1,823 8.1% First Quarter To - Date Total 341,731 $ 67,625 $ 5,601 8.3% 4/27/2020 Dumfries Health Center Dumfries, VA 99,718 19,250 1,695 8.8% Second Quarter To - Date Total 99,718 $ 19,250 $ 1,695 8.8% Year - To - Date 2020 Total/Weighted Average 441,449 $ 86,875 $ 7,296 8.4% (1) Represents contractual purchase price. (2) March 2020 base rent or month of acquisition base rent multiplied by 12, except for Grand Rapids, which reflects a $0.3 million reduction related to COVID - 19 and resulted in a weighted - average lease term extension of 4.2 years. (3) Capitalization rates are calculated based on current lease terms and do not give effect to future rent escalations. Acquisitions Under Contract We have three properties under contract for an aggregate purchase price of approximately $ 45 . 1 million . We are currently in the due diligence period for our properties under contract . If we identify problems with any of these properties or the operator of any property during our due diligence review, we may not close the transaction on a timely basis or we may terminate the purchase agreement and not close the transaction .
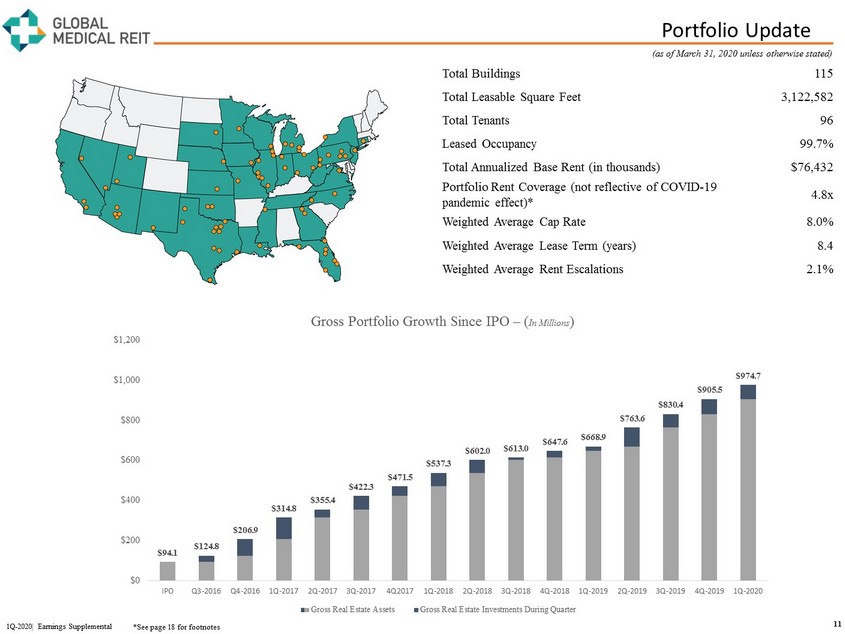
$94.1 $124.8 $206.9 $314.8 $355.4 $422.3 $471.5 $537.3 $602.0 $613.0 $647.6 $668.9 $763.6 $830.4 $905.5 $974.7 $0 $200 $400 $600 $800 $1,000 $1,200 IPO Q3-2016 Q4-2016 1Q-2017 2Q-2017 3Q-2017 4Q2017 1Q-2018 2Q-2018 3Q-2018 4Q-2018 1Q-2019 2Q-2019 3Q-2019 4Q-2019 1Q-2020 Gross Portfolio Growth Since IPO – ( In Millions ) Gross Real Estate Assets Gross Real Estate Investments During Quarter Portfolio Update 11 Total Buildings 115 Total Leasable Square Feet 3,122,582 Total Tenants 96 Leased Occupancy 99.7% Total Annualized Base Rent (in thousands) $76,432 Portfolio Rent Coverage (not reflective of COVID - 19 pandemic effect )* 4.8x Weighted Average Cap Rate 8.0% Weighted Average Lease Term (years) 8.4 Weighted Average Rent Escalations 2.1% (as of March 31, 2020 unless otherwise stated) 1Q - 2020| Earnings Supplemental *See page 18 for footnotes
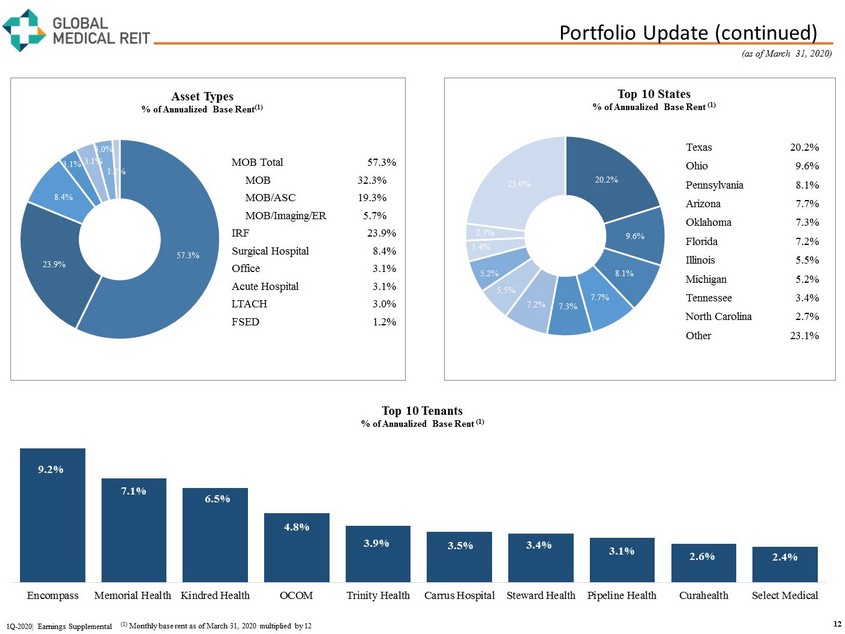
Portfolio Update ( continued) 12 1Q - 2020| Earnings Supplemental Top 10 Tenants % of Annualized Base Rent (1) (1) Monthly base rent as of March 31, 2020 multiplied by 12 9.2% 7.1% 6.5% 4.8% 3.9% 3.5% 3.4% 3.1% 2.6% 2.4% Encompass Memorial Health Kindred Health OCOM Trinity Health Carrus Hospital Steward Health Pipeline Health Curahealth Select Medical 57.3% 23.9% 8.4% 3.1% 3.1% 3.0% 1.2% MOB Total 57.3% MOB 32.3% MOB/ASC 19.3% MOB/Imaging/ER 5.7% IRF 23.9% Surgical Hospital 8.4% Office 3.1% Acute Hospital 3.1% LTACH 3.0% FSED 1.2% Texas 20.2% Ohio 9.6% Pennsylvania 8.1% Arizona 7.7% Oklahoma 7.3% Florida 7.2% Illinois 5.5% Michigan 5.2% Tennessee 3.4% North Carolina 2.7% Other 23.1% 20.2% 9.6% 8.1% 7.7% 7.3% 7.2% 5.5% 5.2% 3.4% 2.7% 23.0% Top 10 States % of Annualized Base Rent (1) Asset Types % of Annualized Base Rent (1) (as of March 31 , 2020)
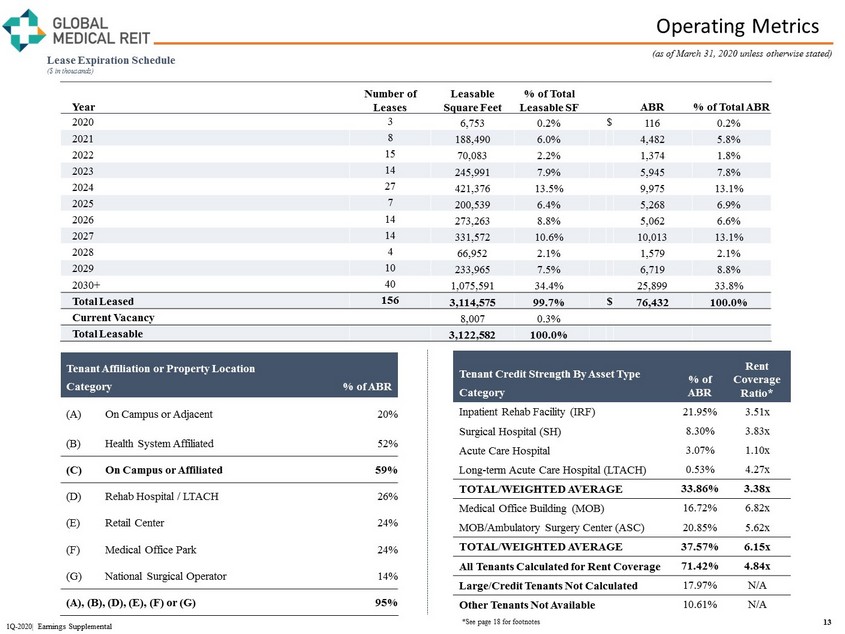
Operating Metrics Tenant Affiliation or Property Location Category % of ABR (A) On Campus or Adjacent 20% (B) Health System Affiliated 52% (C) On Campus or Affiliated 59% (D) Rehab Hospital / LTACH 26% (E) Retail Center 24% (F) Medical Office Park 24% (G) National Surgical Operator 14% (A), (B), (D), (E ), ( F ) or (G) 95% Year Number of Leases Leasable Square Feet % of Total Leasable SF ABR % of Total ABR 2020 3 6,753 0.2% $ 116 0.2% 2021 8 188,490 6.0% 4,482 5.8% 2022 15 70,083 2.2% 1,374 1.8% 2023 14 245,991 7.9% 5,945 7.8% 2024 27 421,376 13.5% 9,975 13.1% 2025 7 200,539 6.4% 5,268 6.9% 2026 14 273,263 8.8% 5,062 6.6% 2027 14 331,572 10.6% 10,013 13.1% 2028 4 66,952 2.1% 1,579 2.1% 2029 10 233,965 7.5% 6,719 8.8% 2030+ 40 1,075,591 34.4% 25,899 33.8% Total Leased 156 3,114,575 99.7% $ 76,432 100.0% Current Vacancy 8,007 0.3% Total Leasable 3,122,582 100.0% 13 Lease Expiration Schedule ($ in thousands) 1Q - 2020| Earnings Supplemental (as of March 31 , 2020 unless otherwise stated) *See page 18 for footnotes Tenant Credit Strength By Asset Type Category % of ABR Rent Coverage Ratio* Inpatient Rehab Facility (IRF) 21.95% 3.51x Surgical Hospital (SH) 8.30% 3.83x Acute Care Hospital 3.07% 1.10x Long - term Acute Care Hospital (LTACH) 0.53% 4.27x TOTAL/WEIGHTED AVERAGE 33.86% 3.38x Medical Office Building (MOB) 16.72% 6.82x MOB/Ambulatory Surgery Center (ASC) 20.85% 5.62x TOTAL/WEIGHTED AVERAGE 37.57% 6.15x All Tenants Calculated for Rent Coverage 71.42% 4.84x Large/Credit Tenants Not Calculated 17.97% N/A Other Tenants Not Available 10.61% N/A
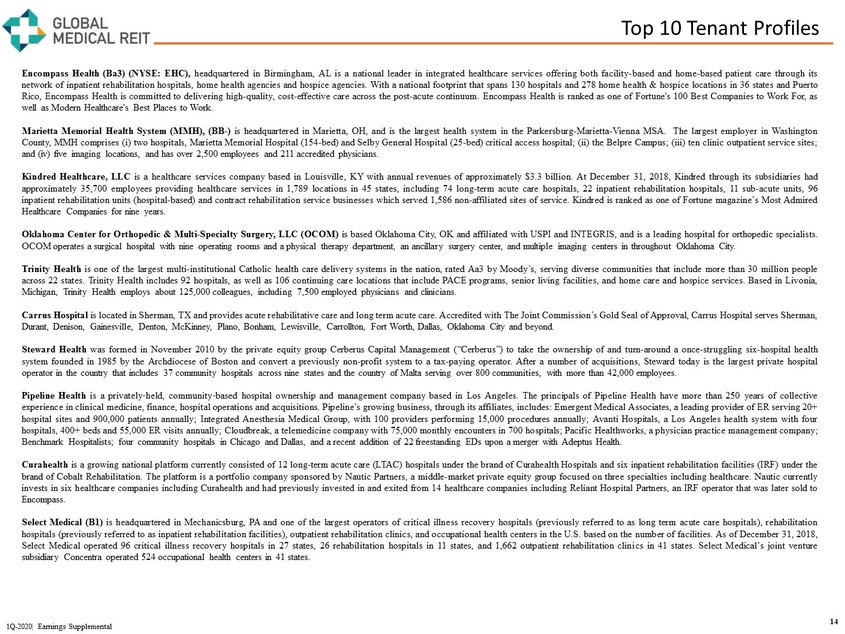
Top 10 Tenant Profiles Encompass Health (Ba 3 ) (NYSE : EHC), headquartered in Birmingham, AL is a national leader in integrated healthcare services offering both facility - based and home - based patient care through its network of inpatient rehabilitation hospitals, home health agencies and hospice agencies . With a national footprint that spans 130 hospitals and 278 home health & hospice locations in 36 states and Puerto Rico, Encompass Health is committed to delivering high - quality, cost - effective care across the post - acute continuum . Encompass Health is ranked as one of Fortune's 100 Best Companies to Work For, as well as Modern Healthcare's Best Places to Work . Marietta Memorial Health System (MMH), (BB - ) is headquartered in Marietta, OH, and is the largest health system in the Parkersburg - Marietta - Vienna MSA . The largest employer in Washington County, MMH comprises (i) two hospitals, Marietta Memorial Hospital ( 154 - bed) and Selby General Hospital ( 25 - bed) critical access hospital ; (ii) the Belpre Campus ; (iii) ten clinic outpatient service sites ; and (iv) five imaging locations, and has over 2 , 500 employees and 211 accredited physicians . Kindred Healthcare, LLC is a healthcare services company based in Louisville, KY with annual revenues of approximately $ 3 . 3 billion . At December 31 , 2018 , Kindred through its subsidiaries had approximately 35 , 700 employees providing healthcare services in 1 , 789 locations in 45 states, including 74 long - term acute care hospitals, 22 inpatient rehabilitation hospitals, 11 sub - acute units, 96 inpatient rehabilitation units (hospital - based) and contract rehabilitation service businesses which served 1 , 586 non - affiliated sites of service . Kindred is ranked as one of Fortune magazine’s Most Admired Healthcare Companies for nine years . Oklahoma Center for Orthopedic & Multi - Specialty Surgery, LLC (OCOM) is based Oklahoma City, OK and affiliated with USPI and INTEGRIS, and is a leading hospital for orthopedic specialists . OCOM operates a surgical hospital with nine operating rooms and a physical therapy department, an ancillary surgery center, and multiple imaging centers in throughout Oklahoma City . Trinity Health is one of the largest multi - institutional Catholic health care delivery systems in the nation, rated Aa 3 by Moody’s, serving diverse communities that include more than 30 million people across 22 states . Trinity Health includes 92 hospitals, as well as 106 continuing care locations that include PACE programs, senior living facilities, and home care and hospice services . Based in Livonia, Michigan, Trinity Health employs about 125 , 000 colleagues, including 7 , 500 employed physicians and clinicians . Carrus Hospital is located in Sherman, TX and provides acute rehabilitative care and long term acute care . Accredited with The Joint Commission’s Gold Seal of Approval, Carrus Hospital serves Sherman, Durant, Denison, Gainesville, Denton, McKinney, Plano, Bonham, Lewisville, Carrollton, Fort Worth, Dallas, Oklahoma City and beyond . Steward Health was formed in November 2010 by the private equity group Cerberus Capital Management (“Cerberus”) to take the ownership of and turn - around a once - struggling six - hospital health system founded in 1985 by the Archdiocese of Boston and convert a previously non - profit system to a tax - paying operator . After a number of acquisitions, Steward today is the largest private hospital operator in the country that includes 37 community hospitals across nine states and the country of Malta serving over 800 communities, with more than 42 , 000 employees . Pipeline Health is a privately - held, community - based hospital ownership and management company based in Los Angeles . The principals of Pipeline Health have more than 250 years of collective experience in clinical medicine, finance, hospital operations and acquisitions . Pipeline’s growing business, through its affiliates, includes : Emergent Medical Associates, a leading provider of ER serving 20 + hospital sites and 900 , 000 patients annually ; Integrated Anesthesia Medical Group, with 100 providers performing 15 , 000 procedures annually ; Avanti Hospitals, a Los Angeles health system with four hospitals, 400 + beds and 55 , 000 ER visits annually ; Cloudbreak, a telemedicine company with 75 , 000 monthly encounters in 700 hospitals ; Pacific Healthworks, a physician practice management company ; Benchmark Hospitalists ; four community hospitals in Chicago and Dallas, and a recent addition of 22 freestanding EDs upon a merger with Adeptus Health . Curahealth is a growing national platform currently consisted of 12 long - term acute care (LTAC) hospitals under the brand of Curahealth Hospitals and six inpatient rehabilitation facilities (IRF) under the brand of Cobalt Rehabilitation . The platform is a portfolio company sponsored by Nautic Partners, a middle - market private equity group focused on three specialties including healthcare . Nautic currently invests in six healthcare companies including Curahealth and had previously invested in and exited from 14 healthcare companies including Reliant Hospital Partners, an IRF operator that was later sold to Encompass . Select Medical (B 1 ) is headquartered in Mechanicsburg, PA and one of the largest operators of critical illness recovery hospitals (previously referred to as long term acute care hospitals), rehabilitation hospitals (previously referred to as inpatient rehabilitation facilities), outpatient rehabilitation clinics, and occupational health centers in the U . S . based on the number of facilities . As of December 31 , 2018 , Select Medical operated 96 critical illness recovery hospitals in 27 states, 26 rehabilitation hospitals in 11 states, and 1 , 662 outpatient rehabilitation clinics in 41 states . Select Medical’s joint venture subsidiary Concentra operated 524 occupational health centers in 41 states . 14 1Q - 2020| Earnings Supplemental
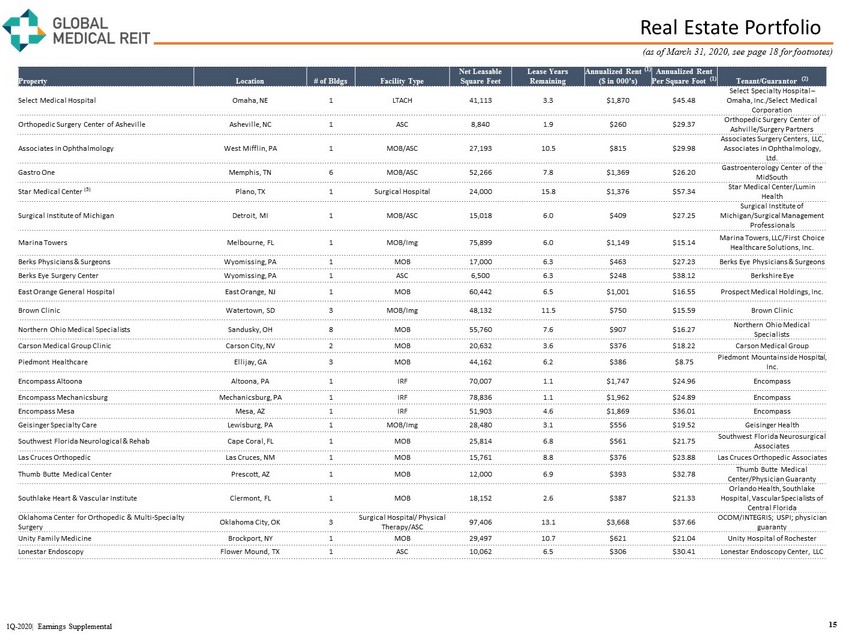
Real Estate Portfolio 15 Property Location # of Bldgs Facility Type Net Leasable Square Feet Lease Years Remaining Annualized Rent (1) ($ in 000’s) Annualized Rent Per Square Foot (1) Tenant/Guarantor (2) Select Medical Hospital Omaha, NE 1 LTACH 41,113 3.3 $1,870 $45.48 Select Specialty Hospital – Omaha, Inc./Select Medical Corporation Orthopedic Surgery Center of Asheville Asheville, NC 1 ASC 8,840 1.9 $260 $29.37 Orthopedic Surgery Center of Ashville/Surgery Partners Associates in Ophthalmology West Mifflin, PA 1 MOB/ASC 27,193 10.5 $815 $29.98 Associates Surgery Centers, LLC, Associates in Ophthalmology, Ltd. Gastro One Memphis, TN 6 MOB/ASC 52,266 7.8 $1,369 $26.20 Gastroenterology Center of the MidSouth Star Medical Center (3) Plano, TX 1 Surgical Hospital 24,000 15.8 $1,376 $57.34 Star Medical Center/Lumin Health Surgical Institute of Michigan Detroit, MI 1 MOB/ASC 15,018 6.0 $409 $27.25 Surgical Institute of Michigan/Surgical Management Professionals Marina Towers Melbourne, FL 1 MOB/Img 75,899 6.0 $1,149 $15.14 Marina Towers, LLC/First Choice Healthcare Solutions, Inc. Berks Physicians & Surgeons Wyomissing, PA 1 MOB 17,000 6.3 $463 $27.23 Berks Eye Physicians & Surgeons Berks Eye Surgery Center Wyomissing, PA 1 ASC 6,500 6.3 $248 $38.12 Berkshire Eye East Orange General Hospital East Orange, NJ 1 MOB 60,442 6.5 $1,001 $16.55 Prospect Medical Holdings, Inc. Brown Clinic Watertown, SD 3 MOB/Img 48,132 11.5 $750 $15.59 Brown Clinic Northern Ohio Medical Specialists Sandusky, OH 8 MOB 55,760 7.6 $907 $16.27 Northern Ohio Medical Specialists Carson Medical Group Clinic Carson City, NV 2 MOB 20,632 3.6 $376 $18.22 Carson Medical Group Piedmont Healthcare Ellijay, GA 3 MOB 44,162 6.2 $386 $8.75 Piedmont Mountainside Hospital, Inc. Encompass Altoona Altoona, PA 1 IRF 70,007 1.1 $1,747 $24.96 Encompass Encompass Mechanicsburg Mechanicsburg, PA 1 IRF 78,836 1.1 $1,962 $24.89 Encompass Encompass Mesa Mesa, AZ 1 IRF 51,903 4.6 $1,869 $36.01 Encompass Geisinger Specialty Care Lewisburg, PA 1 MOB/Img 28,480 3.1 $556 $19.52 Geisinger Health Southwest Florida Neurological & Rehab Cape Coral, FL 1 MOB 25,814 6.8 $561 $21.75 Southwest Florida Neurosurgical Associates Las Cruces Orthopedic Las Cruces, NM 1 MOB 15,761 8.8 $376 $23.88 Las Cruces Orthopedic Associates Thumb Butte Medical Center Prescott, AZ 1 MOB 12,000 6.9 $393 $32.78 Thumb Butte Medical Center/Physician Guaranty Southlake Heart & Vascular Institute Clermont, FL 1 MOB 18,152 2.6 $387 $21.33 Orlando Health, Southlake Hospital, Vascular Specialists of Central Florida Oklahoma Center for Orthopedic & Multi - Specialty Surgery Oklahoma City, OK 3 Surgical Hospital/ Physical Therapy/ASC 97,406 13.1 $3,668 $37.66 OCOM/INTEGRIS; USPI; physician guaranty Unity Family Medicine Brockport, NY 1 MOB 29,497 10.7 $621 $21.04 Unity Hospital of Rochester Lonestar Endoscopy Flower Mound, TX 1 ASC 10,062 6.5 $306 $30.41 Lonestar Endoscopy Center, LLC 1Q - 2020| Earnings Supplemental (as of March 31, 2020, see page 18 for footnotes)
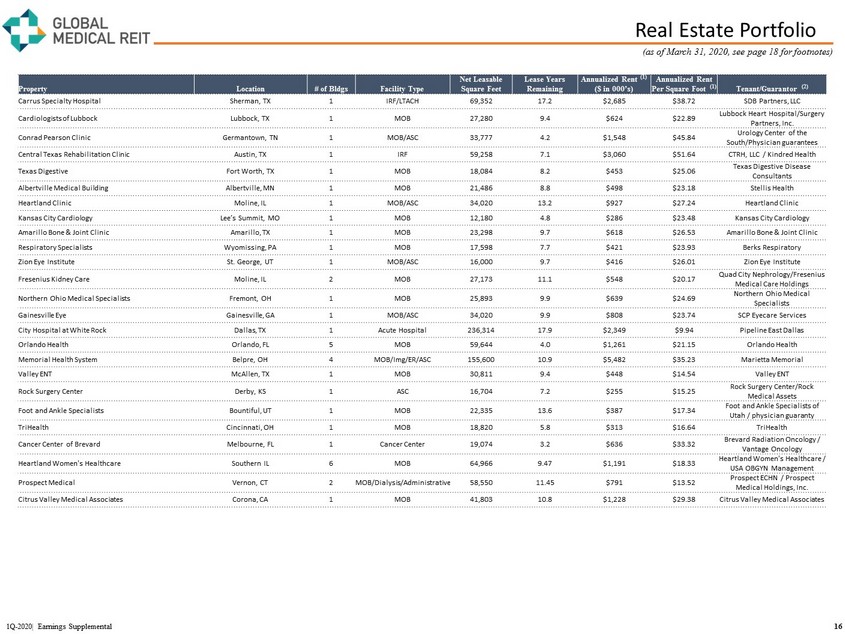
Real Estate Portfolio 16 Property Location # of Bldgs Facility Type Net Leasable Square Feet Lease Years Remaining Annualized Rent (1) ($ in 000’s) Annualized Rent Per Square Foot (1) Tenant/Guarantor (2) Carrus Specialty Hospital Sherman, TX 1 IRF/LTACH 69,352 17.2 $2,685 $38.72 SDB Partners, LLC Cardiologists of Lubbock Lubbock, TX 1 MOB 27,280 9.4 $624 $22.89 Lubbock Heart Hospital/Surgery Partners, Inc. Conrad Pearson Clinic Germantown, TN 1 MOB/ASC 33,777 4.2 $1,548 $45.84 Urology Center of the South/Physician guarantees Central Texas Rehabilitation Clinic Austin, TX 1 IRF 59,258 7.1 $3,060 $51.64 CTRH, LLC / Kindred Health Texas Digestive Fort Worth, TX 1 MOB 18,084 8.2 $453 $25.06 Texas Digestive Disease Consultants Albertville Medical Building Albertville, MN 1 MOB 21,486 8.8 $498 $23.18 Stellis Health Heartland Clinic Moline, IL 1 MOB/ASC 34,020 13.2 $927 $27.24 Heartland Clinic Kansas City Cardiology Lee’s Summit, MO 1 MOB 12,180 4.8 $286 $23.48 Kansas City Cardiology Amarillo Bone & Joint Clinic Amarillo, TX 1 MOB 23,298 9.7 $618 $26.53 Amarillo Bone & Joint Clinic Respiratory Specialists Wyomissing, PA 1 MOB 17,598 7.7 $421 $23.93 Berks Respiratory Zion Eye Institute St. George, UT 1 MOB/ASC 16,000 9.7 $416 $26.01 Zion Eye Institute Fresenius Kidney Care Moline, IL 2 MOB 27,173 11.1 $548 $20.17 Quad City Nephrology/Fresenius Medical Care Holdings Northern Ohio Medical Specialists Fremont, OH 1 MOB 25,893 9.9 $639 $24.69 Northern Ohio Medical Specialists Gainesville Eye Gainesville, GA 1 MOB/ASC 34,020 9.9 $808 $23.74 SCP Eyecare Services City Hospital at White Rock Dallas, TX 1 Acute Hospital 236,314 17.9 $2,349 $9.94 Pipeline East Dallas Orlando Health Orlando, FL 5 MOB 59,644 4.0 $1,261 $21.15 Orlando Health Memorial Health System Belpre, OH 4 MOB/Img/ER/ASC 155,600 10.9 $5,482 $35.23 Marietta Memorial Valley ENT McAllen, TX 1 MOB 30,811 9.4 $448 $14.54 Valley ENT Rock Surgery Center Derby, KS 1 ASC 16,704 7.2 $255 $15.25 Rock Surgery Center/Rock Medical Assets Foot and Ankle Specialists Bountiful, UT 1 MOB 22,335 13.6 $387 $17.34 Foot and Ankle Specialists of Utah / physician guaranty TriHealth Cincinnati, OH 1 MOB 18,820 5.8 $313 $16.64 TriHealth Cancer Center of Brevard Melbourne, FL 1 Cancer Center 19,074 3.2 $636 $33.32 Brevard Radiation Oncology / Vantage Oncology Heartland Women's Healthcare Southern IL 6 MOB 64,966 9.47 $1,191 $18.33 Heartland Women's Healthcare / USA OBGYN Management Prospect Medical Vernon, CT 2 MOB/Dialysis/Administrative 58,550 11.45 $791 $13.52 Prospect ECHN / Prospect Medical Holdings, Inc. Citrus Valley Medical Associates Corona, CA 1 MOB 41,803 10.8 $1,228 $29.38 Citrus Valley Medical Associates 1Q - 2020| Earnings Supplemental (as of March 31, 2020, see page 18 for footnotes)
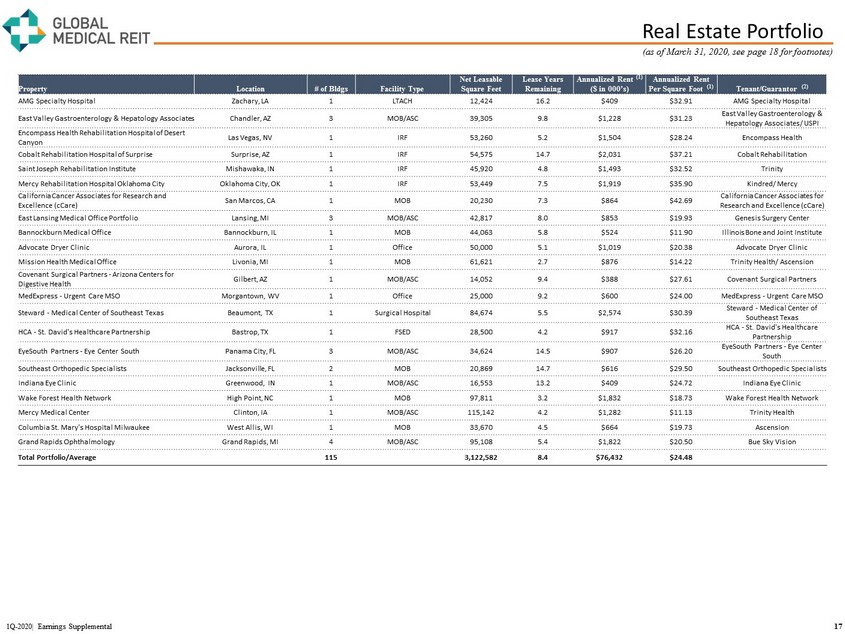
Real Estate Portfolio 17 (as of March 31, 2020, see page 18 for footnotes) Property Location # of Bldgs Facility Type Net Leasable Square Feet Lease Years Remaining Annualized Rent (1) ($ in 000’s) Annualized Rent Per Square Foot (1) Tenant/Guarantor (2) AMG Specialty Hospital Zachary, LA 1 LTACH 12,424 16.2 $409 $32.91 AMG Specialty Hospital East Valley Gastroenterology & Hepatology Associates Chandler, AZ 3 MOB/ASC 39,305 9.8 $1,228 $31.23 East Valley Gastroenterology & Hepatology Associates/ USPI Encompass Health Rehabilitation Hospital of Desert Canyon Las Vegas, NV 1 IRF 53,260 5.2 $1,504 $28.24 Encompass Health Cobalt Rehabilitation Hospital of Surprise Surprise, AZ 1 IRF 54,575 14.7 $2,031 $37.21 Cobalt Rehabilitation Saint Joseph Rehabilitation Institute Mishawaka, IN 1 IRF 45,920 4.8 $1,493 $32.52 Trinity Mercy Rehabilitation Hospital Oklahoma City Oklahoma City, OK 1 IRF 53,449 7.5 $1,919 $35.90 Kindred/ Mercy California Cancer Associates for Research and Excellence (cCare) San Marcos, CA 1 MOB 20,230 7.3 $864 $42.69 California Cancer Associates for Research and Excellence (cCare) East Lansing Medical Office Portfolio Lansing, MI 3 MOB/ASC 42,817 8.0 $853 $19.93 Genesis Surgery Center Bannockburn Medical Office Bannockburn, IL 1 MOB 44,063 5.8 $524 $11.90 Illinois Bone and Joint Institute Advocate Dryer Clinic Aurora, IL 1 Office 50,000 5.1 $1,019 $20.38 Advocate Dryer Clinic Mission Health Medical Office Livonia, MI 1 MOB 61,621 2.7 $876 $14.22 Trinity Health/ Ascension Covenant Surgical Partners - Arizona Centers for Digestive Health Gilbert, AZ 1 MOB/ASC 14,052 9.4 $388 $27.61 Covenant Surgical Partners MedExpress - Urgent Care MSO Morgantown, WV 1 Office 25,000 9.2 $600 $24.00 MedExpress - Urgent Care MSO Steward - Medical Center of Southeast Texas Beaumont, TX 1 Surgical Hospital 84,674 5.5 $2,574 $30.39 Steward - Medical Center of Southeast Texas HCA - St. David's Healthcare Partnership Bastrop, TX 1 FSED 28,500 4.2 $917 $32.16 HCA - St. David's Healthcare Partnership EyeSouth Partners - Eye Center South Panama City, FL 3 MOB/ASC 34,624 14.5 $907 $26.20 EyeSouth Partners - Eye Center South Southeast Orthopedic Specialists Jacksonville, FL 2 MOB 20,869 14.7 $616 $29.50 Southeast Orthopedic Specialists Indiana Eye Clinic Greenwood, IN 1 MOB/ASC 16,553 13.2 $409 $24.72 Indiana Eye Clinic Wake Forest Health Network High Point, NC 1 MOB 97,811 3.2 $1,832 $18.73 Wake Forest Health Network Mercy Medical Center Clinton, IA 1 MOB/ASC 115,142 4.2 $1,282 $11.13 Trinity Health Columbia St. Mary's Hospital Milwaukee West Allis, WI 1 MOB 33,670 4.5 $664 $19.73 Ascension Grand Rapids Ophthalmology Grand Rapids, MI 4 MOB/ASC 95,108 5.4 $1,822 $20.50 Bue Sky Vision Total Portfolio/Average 115 3,122,582 8.4 $76,432 $24.48 1Q - 2020| Earnings Supplemental
Disclosures Rent Coverage Ratio (see pages 11 and 13 ) For purposes of calculating our portfolio weighted - average EBITDARM coverage ratio (“Rent Coverage Ratio”), we excluded credit - rated tenants or their subsidiaries for which financial statements were either not available or not sufficiently detailed . These ratios are based on latest available information only . Most tenant financial statements are unaudited and we have not independently verified any tenant financial information (audited or unaudited) and, therefore, we cannot assure you that such information is accurate or complete . Certain other tenants (approximately 11 % of our portfolio) are excluded from the calculation due to lack of available financial information . Additionally, our Rent Coverage Ratio adds back physician distributions and compensation . Management believes that all adjustments are reasonable and necessary . Our Rent Coverage Ratio as of March 31 , 2020 does not take into account the effects of the COVID - 19 pandemic on our tenants’ businesses . Due to the significant reduction in our tenants’ businesses due to the pandemic, we expect the Rent Coverage Ratio to be materially lower for the remainder of 2020 and possibly longer . Real Estate Portfolio (see pages 15 , 16 and 17 ) Data as of March 31, 2020. (1) Monthly base rent at March 31 , 2020 multiplied by 12 ( or actual NOI for cCare , East Lansing, Bannockburn and Mission Health properties) . In addition, Grand Rapids reflects a $0.3 million reduction related to COVID - 19 and resulted in a weighted - average lease term extension of 4.2 years. Acco rdingly , this methodology produces an annualized amount as of a point in time but does not take into account future contractual rental rate increases . (2) Certain lease guarantees are for less than 100% of the contractual rental payments. (3) Carrus Specialty Hospital does not include 12,000 square feet of shell space . Additional Information The information in this document should be read in conjunction with the Company’s Annual Report on Form 10 - K, Quarterly Reports on Form 10 - Q, Current Reports on Form 8 - K, and other information filed with, or furnished to, the SEC . You can access the Company’s reports and amendments to those reports filed or furnished to the SEC pursuant to Section 13 (a) or 15 (d) of the Exchange Act in the “Investor Relations” section on the Company’s website (www . globalmedicalreit . com) under “SEC Filings” as soon as reasonably practicable after they are filed with, or furnished to, the SEC . The information on or connected to the Company’s website is not, and shall not be deemed to be, a part of, or incorporated into, this Earnings Supplemental . You also can review these SEC filings and other information by accessing the SEC’s website at http : //www . sec . gov . Certain information contained in this package, including, but not limited to, information contained in our Top 10 tenant profiles is derived from publicly - available third - party sources . The Company has not independently verified this information and there can be no assurance that such information is accurate or complete . 18 (as of March 31, 2020) 1Q - 2020| Earnings Supplemental
Evelyn Infurna Evelyn.Infurna@icrinc.com 203.682.8265 www.globalmedicalreit.com NYSE: GMRE INVESTOR RELATIONS