Exhibit 99.1
Investor Presentation June 2020
Forward - Looking Statements 1 This presentation is for informational purposes only and does not constitute an offer to sell, or a solicitation of offers to purchase, Global Medical REIT Inc . ’s (the “Company”, or “GMRE”) securities . The information contained in this presentation does not purport to be complete and should not be relied upon as a basis for making an investment decision in the Company’s securities . This presentation also contains statements that, to the extent they are not recitations of historical fact, constitute “forward - looking statements . ” Forward - looking statements are typically identified by the use of terms such as “may,” “should,” “expect,” “could,” “intend,” “plan,” “anticipate,” “estimate,” “believe,” “continue,” “predict,” “potential” or the negative of such terms and other comparable terminology . The forward - looking statements included herein are based upon the Company’s current expectations, plans, estimates, assumptions and beliefs that involve numerous risks and uncertainties . Assumptions relating to the foregoing involve judgments with respect to, among other things, future economic, competitive and market conditions and future business decisions, all of which are difficult or impossible to predict accurately and many of which are beyond the Company’s control . Although the Company believes that the expectations reflected in such forward - looking statements are based on reasonable assumptions, the Company’s actual results and performance could differ materially from those set forth in the forward - looking statements due to the impact of many factors including, but not limited to, those discussed under “Risk Factors” in the Company’s Annual Report on Form 10 - K and Quarterly Reports on Form 10 - Q and any prospectus or prospectus supplement filed with the Securities and Exchange Commission . The Company undertakes no obligation to update or revise any such information for any reason after the date of this presentation, unless required by law . This presentation includes information regarding certain of our tenants, which are not subject to SEC reporting requirements . The information related to our tenants contained in this report was provided to us by such tenants or was derived from publicly available information . We have not independently investigated or verified this information . We have no reason to believe that this information is inaccurate in any material respect, but we cannot provide any assurance of its accuracy . We are providing this data for informational purposes only .
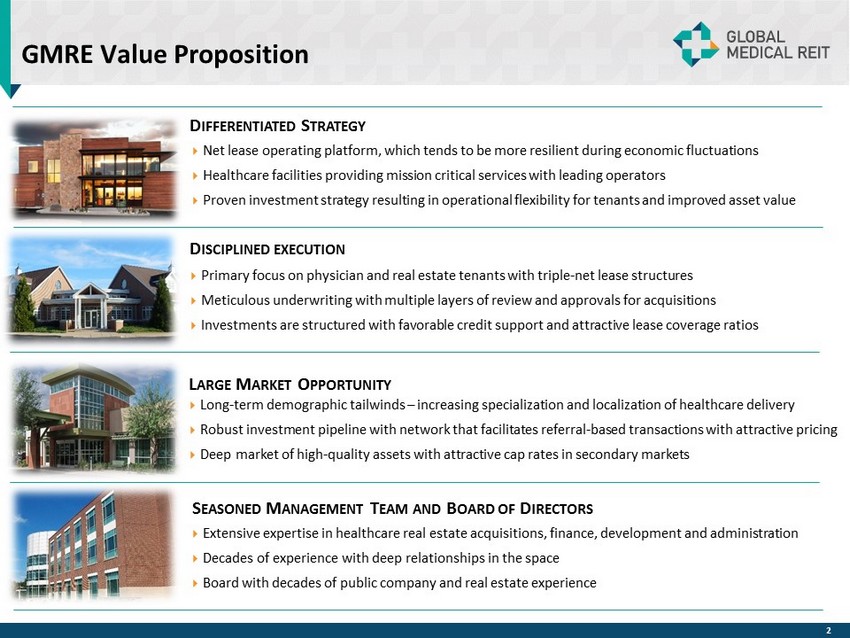
GMRE Value Proposition Net lease operating platform, which tends to be more resilient during economic fluctuations Healthcare facilities providing mission critical services with leading operators Proven investment strategy resulting in operational flexibility for tenants and improved asset value D IFFERENTIATED S TRATEGY Primary focus on physician and real estate tenants with triple - net lease structures Meticulous underwriting with multiple layers of review and approvals for acquisitions Investments are structured with favorable credit support and attractive lease coverage ratios Long - term demographic tailwinds – increasing specialization and localization of healthcare delivery Robust investment pipeline with network that facilitates referral - based transactions with attractive pricing Deep market of high - quality assets with attractive cap rates in secondary markets Extensive expertise in healthcare real estate acquisitions, finance, development and administration Decades of experience with deep relationships in the space Board with decades of public company and real estate experience D ISCIPLINED EXECUTION L ARGE M ARKET O PPORTUNITY S EASONED M ANAGEMENT T EAM AND B OARD OF D IRECTORS 2
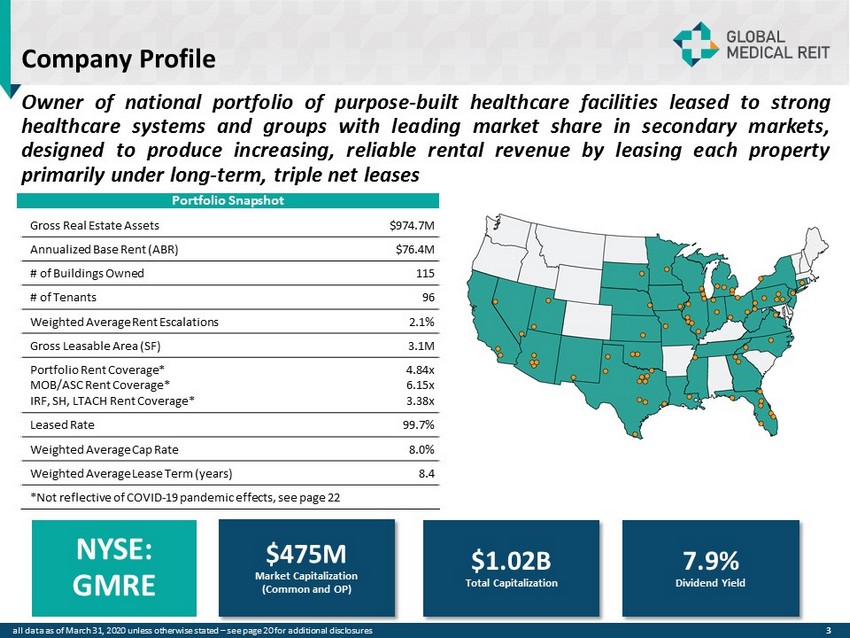
Company Profile 3 Owner of national portfolio of purpose - built healthcare facilities leased to strong healthcare systems and groups with leading market share in secondary markets, designed to produce increasing, reliable rental revenue by leasing each property primarily under long - term , triple net leases $475M Market Capitalization (Common and OP) NYSE: GMRE 7.9% Dividend Yield $1.02B Total Capitalization Gross Real Estate Assets $974.7M Annualized Base Rent (ABR) $76.4M # of Buildings Owned 115 # of Tenants 96 Weighted Average Rent Escalations 2.1% Gross Leasable Area (SF) 3.1M Portfolio Rent Coverage* MOB/ASC Rent Coverage* IRF, SH, LTACH Rent Coverage* 4.84x 6.15x 3.38x Leased Rate 99.7% Weighted Average Cap Rate 8.0% Weighted Average Lease Term (years) 8.4 *Not reflective of COVID - 19 pandemic effects, see page 22 Portfolio Snapshot all data as of March 31, 2020 unless otherwise stated – see page 20 for additional disclosures
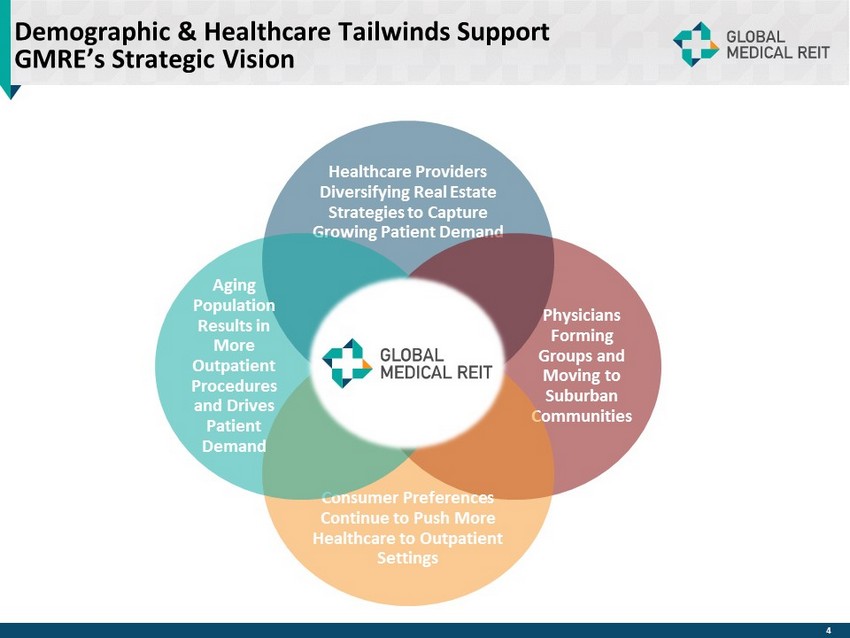
Demographic & Healthcare Tailwinds Support GMRE’s Strategic Vision Healthcare Providers Diversifying Real Estate Strategies to Capture Growing Patient Demand Physicians Forming Groups and Moving to Suburban Communities Consumer Preferences Continue to Push More Healthcare to Outpatient Settings Aging Population Results in More Outpatient Procedures and Drives Patient Demand 4
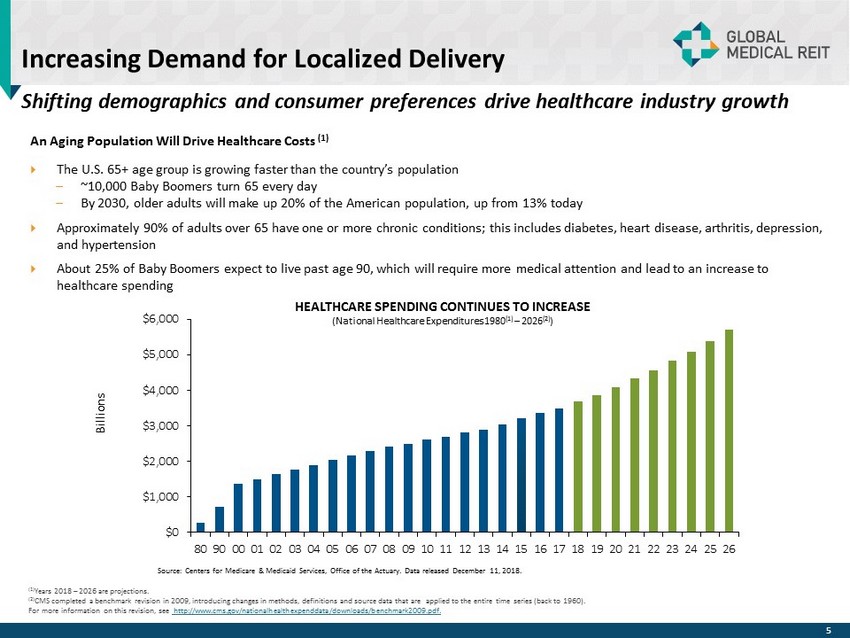
Increasing Demand for Localized Delivery An Aging Population Will Drive Healthcare Costs (1) The U.S. 65+ age group is growing faster than the country’s population – ~10,000 Baby Boomers turn 65 every day – By 2030, older adults will make up 20% of the American population, up from 13% today Approximately 90% of adults over 65 have one or more chronic conditions; this includes diabetes, heart disease, arthritis, de pre ssion, and hypertension About 25% of Baby Boomers expect to live past age 90, which will require more medical attention and lead to an increase to healthcare spending 5 Source: Centers for Medicare & Medicaid Services, Office of the Actuary. Data released December 11, 2018. HEALTHCARE SPENDING CONTINUES TO INCREASE ( National Healthcare Expenditures 1980 (1) – 2026 (2 ) ) Shifting demographics and consumer preferences drive healthcare industry growth (1) Years 2018 – 202 6 are projections. (2) CMS completed a benchmark revision in 2009, introducing changes in methods, definitions and source data that are applied to the entire time series (back to 1960). For more information on this revision, see http://www.cms.gov/nationalhealthexpenddata/downloads/benchmark2009.pdf. B illi o n s $0 $1,000 $2,000 $3,000 $4,000 $5,000 $6,000 80 90 00 01 02 03 04 05 06 07 08 09 10 11 12 13 14 15 16 17 18 19 20 21 22 23 24 25 26
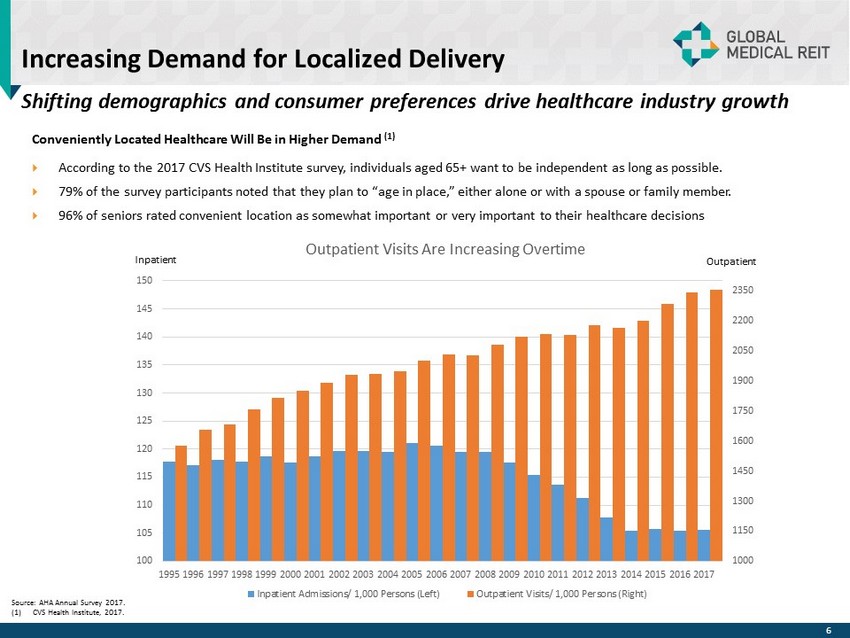
Increasing Demand for Localized Delivery Source : AHA Annual Survey 2017. (1) CVS Health Institute, 2017. Conveniently Located Healthcare Will Be in Higher Demand (1) According to the 2017 CVS Health Institute survey, individuals aged 65+ want to be independent as long as possible. 79% of the survey participants noted that they plan to “age in place,” either alone or with a spouse or family member. 96% of seniors rated convenient location as somewhat important or very important to their healthcare decisions 6 Shifting demographics and consumer preferences drive healthcare industry growth 1000 1150 1300 1450 1600 1750 1900 2050 2200 2350 100 105 110 115 120 125 130 135 140 145 150 1995 1996 1997 1998 1999 2000 2001 2002 2003 2004 2005 2006 2007 2008 2009 2010 2011 2012 2013 2014 2015 2016 2017 Outpatient Visits Are Increasing Overtime Inpatient Admissions/ 1,000 Persons (Left) Outpatient Visits/ 1,000 Persons (Right) Inpatient Outpatient
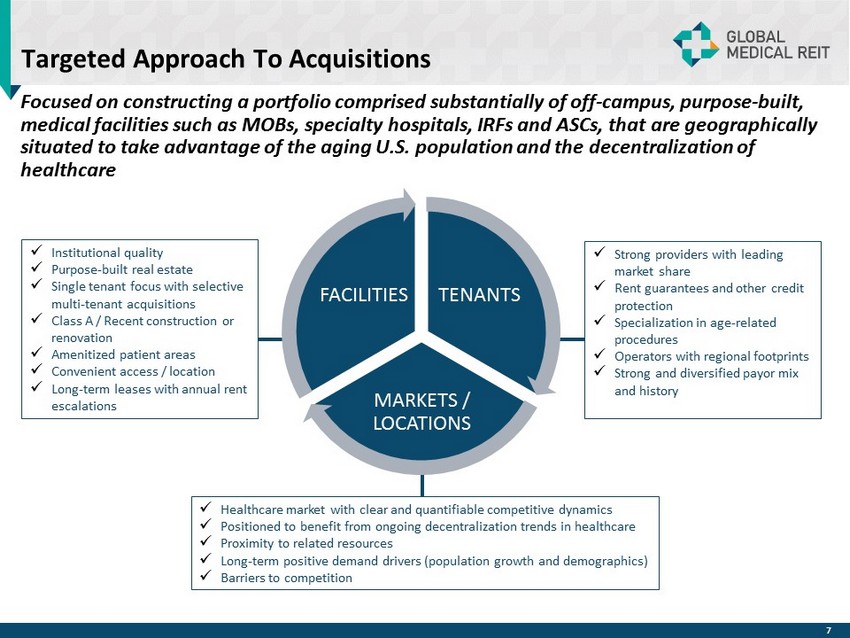
Targeted Approach To Acquisitions Focused on constructing a portfolio comprised substantially of off - campus, purpose - built, medical facilities such as MOBs, specialty hospitals, IRFs and ASCs, that are geographically situated to take advantage of the aging U.S. population and the decentralization of healthcare TENANTS MARKETS / LOCATIONS FACILITIES x Strong providers with leading market share x Rent guarantees and other credit protection x Specialization in age - related procedures x Operators with regional footprints x Strong and diversified payor mix and history x Institutional quality x Purpose - built real estate x Single tenant focus with selective multi - tenant acquisitions x Class A / Recent construction or renovation x Amenitized patient areas x Convenient access / location x Long - term leases with annual rent escalations x Healthcare market with clear and quantifiable competitive dynamics x Positioned to benefit from ongoing decentralization trends in healthcare x Proximity to related resources x Long - term positive demand drivers (population growth and demographics) x Barriers to competition 7
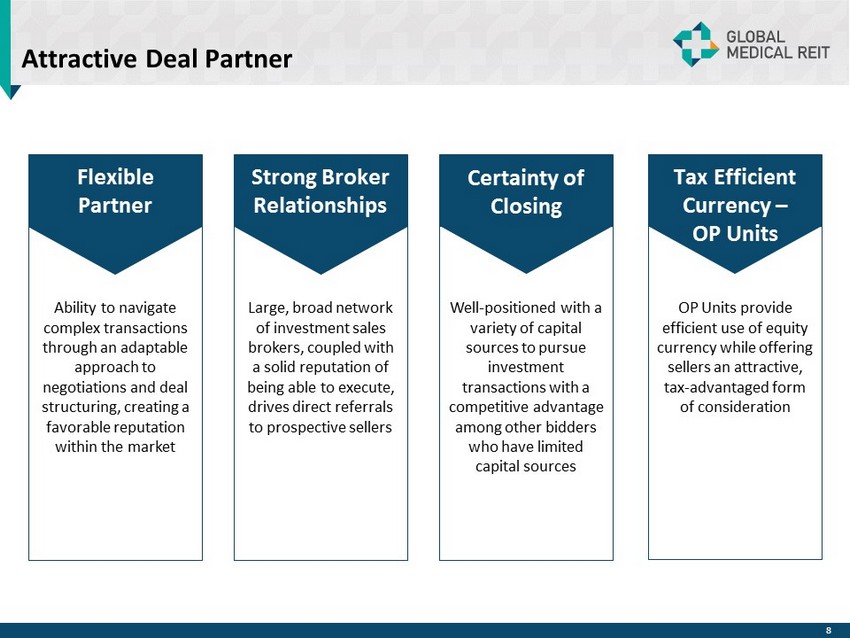
Attractive Deal Partner Ability to navigate complex transactions through an adaptable approach to negotiations and deal structuring, creating a favorable reputation within the market Large, broad network of investment sales brokers, coupled with a solid reputation of being able to execute, drives direct referrals to prospective sellers Well - positioned with a variety of capital sources to pursue investment transactions with a competitive advantage among other bidders who have limited capital sources OP Units provide efficient use of equity currency while offering sellers an attractive, tax - advantaged form of consideration 8 Flexible Partner Strong Broker Relationships Certainty of Closing Tax Efficient Currency – OP Units
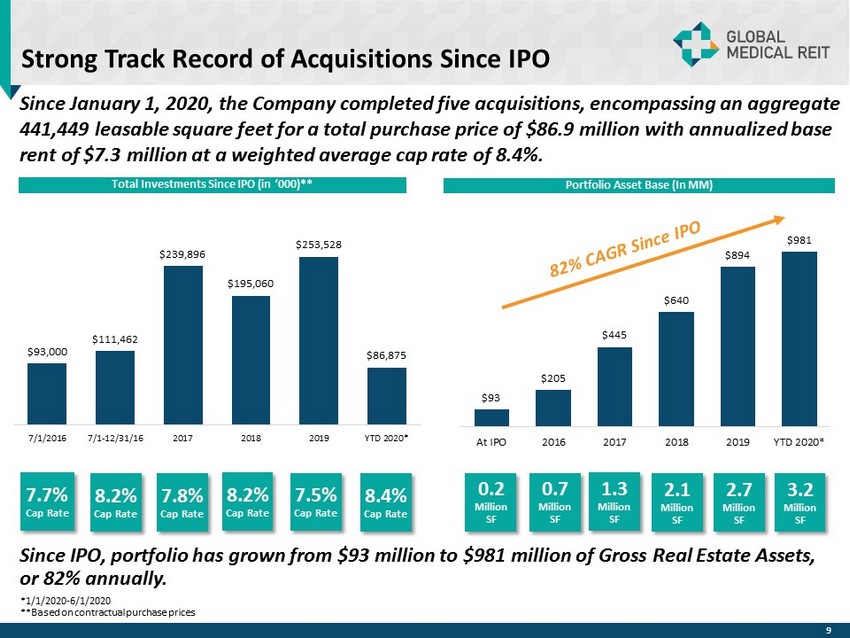
$93 $205 $445 $640 $894 $981 At IPO 2016 2017 2018 2019 YTD 2020* Strong Track Record of Acquisitions Since IPO Total Investments Since IPO (in ‘000)** Portfolio Asset Base (In MM) Since IPO, portfolio has grown from $93 million to $981 million of Gross Real Estate Assets, or 82% annually. 8.2% Cap Rate 7.8% Cap Rate 8.2% Cap Rate 7.5% Cap Rate Since January 1, 2020, the Company completed five acquisitions, encompassing an aggregate 441,449 leasable square feet for a total purchase price of $86.9 million with annualized base rent of $7.3 million at a weighted average cap rate of 8.4%. 9 $93,000 $111,462 $239,896 $195,060 $253,528 $86,875 7/1/2016 7/1-12/31/16 2017 2018 2019 YTD 2020* 8.4% Cap Rate 0.7 Million SF 1.3 Million SF 2.1 Million SF 2.7 Million SF 3.2 Million SF 0.2 Million SF 7.7% Cap Rate *1/1/2020 - 6/1/2020 **Based on contractual purchase prices
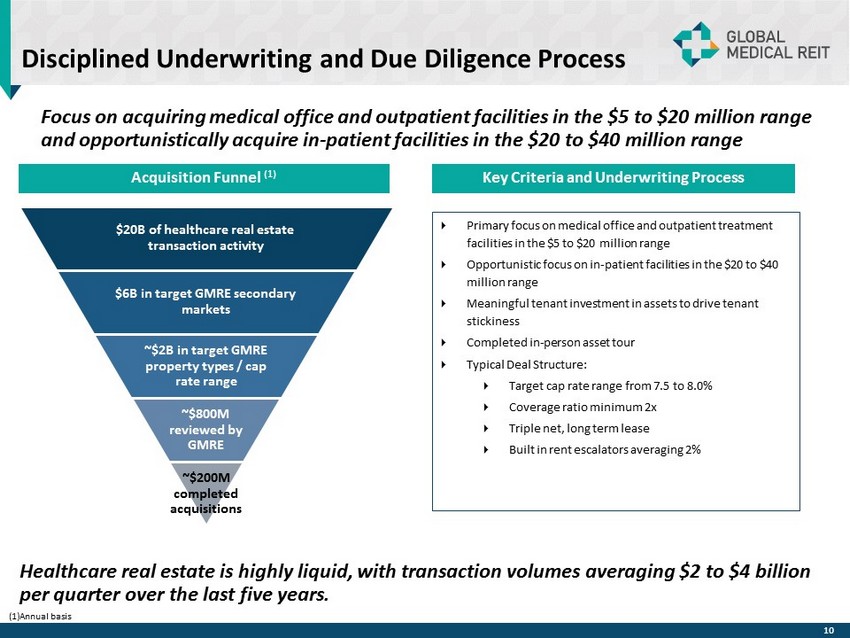
Disciplined Underwriting and Due Diligence Process Acquisition Funnel (1) Healthcare real estate is highly liquid, with transaction volumes averaging $2 to $4 billion per quarter over the last five years. Focus on acquiring medical office and outpatient facilities in the $5 to $20 million range and opportunistically acquire in - patient facilities in the $20 to $40 million range 10 $20B of healthcare real estate transaction activity $6B in target GMRE secondary markets ~$2B in target GMRE property types / cap rate range ~$800M reviewed by GMRE ~$200M completed acquisitions Key Criteria and Underwriting Process Primary focus on medical office and outpatient treatment facilities in the $5 to $20 million range Opportunistic focus on in - patient facilities in the $20 to $40 million range Meaningful tenant investment in assets to drive tenant stickiness Completed in - person asset tour Typical Deal Structure: Target cap rate range from 7.5 to 8.0% Coverage ratio minimum 2x Triple net, long term lease Built in rent escalators averaging 2% (1) Annual basis
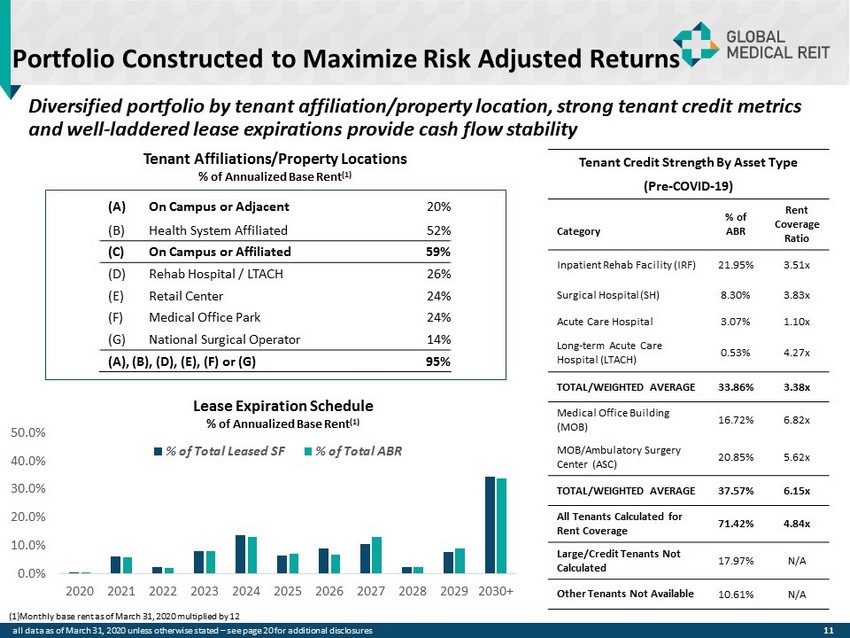
Portfolio Constructed to Maximize Risk Adjusted Returns 11 Tenant Credit Strength By Asset Type (Pre - COVID - 19) Category % of ABR Rent Coverage Ratio Inpatient Rehab Facility (IRF) 21.95% 3.51x Surgical Hospital (SH) 8.30% 3.83x Acute Care Hospital 3.07% 1.10x Long - term Acute Care Hospital (LTACH) 0.53% 4.27x TOTAL/WEIGHTED AVERAGE 33.86% 3.38x Medical Office Building (MOB) 16.72% 6.82x MOB/Ambulatory Surgery Center (ASC) 20.85% 5.62x TOTAL/WEIGHTED AVERAGE 37.57% 6.15x All Tenants Calculated for Rent Coverage 71.42% 4.84x Large/Credit Tenants Not Calculated 17.97% N/A Other Tenants Not Available 10.61% N/A all data as of March 31, 2020 unless otherwise stated – see page 20 for additional disclosures Diversified portfolio by tenant affiliation/property location, strong tenant credit metrics and well - laddered lease expirations provide cash flow stability 0.0% 10.0% 20.0% 30.0% 40.0% 50.0% 2020 2021 2022 2023 2024 2025 2026 2027 2028 2029 2030+ % of Total Leased SF % of Total ABR Tenant Affiliations/Property Locations % of Annualized Base Rent (1) Lease Expiration Schedule % of Annualized Base Rent (1) (1) Monthly base rent as of March 31, 2020 multiplied by 12 (A) On Campus or Adjacent 20% (B) Health System Affiliated 52% (C) On Campus or Affiliated 59% (D) Rehab Hospital / LTACH 26% (E) Retail Center 24% (F) Medical Office Park 24% (G) National Surgical Operator 14% (A), (B), (D), (E ), ( F ) or (G) 95%
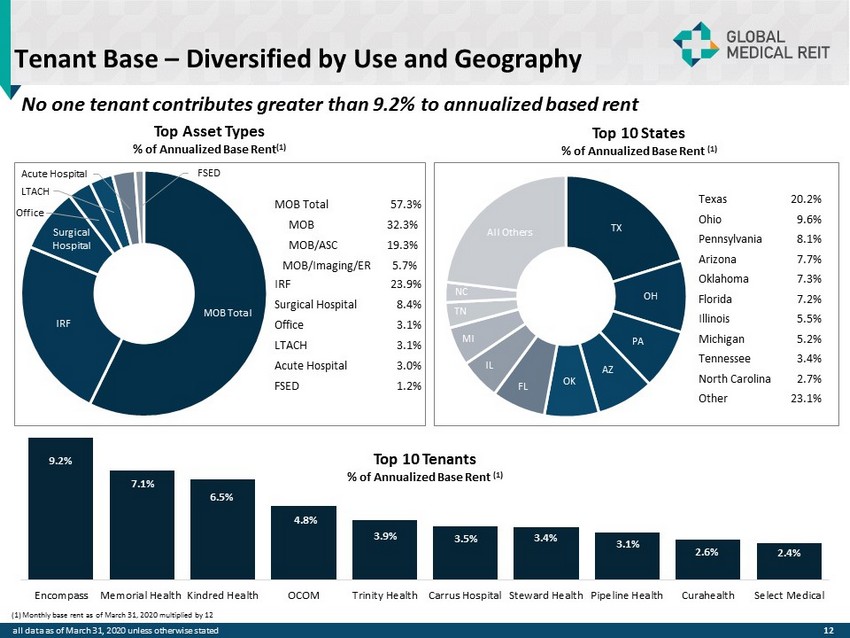
TX OH PA AZ OK FL IL MI TN NC All Others Tenant Base – Diversified by Use and Geography No one tenant contributes greater than 9.2% to annualized based rent 12 Top 10 States % of Annualized Base Rent (1) MOB Total IRF Surgical Hospital Office LTACH Acute Hospital FSED Texas 20.2% Ohio 9.6% Pennsylvania 8.1% Arizona 7.7% Oklahoma 7.3% Florida 7.2% Illinois 5.5% Michigan 5.2% Tennessee 3.4% North Carolina 2.7% Other 23.1% (1) Monthly base rent as of March 31, 2020 multiplied by 12 Top 10 Tenants % of Annualized Base Rent (1) all data as of March 31, 2020 unless otherwise stated Top Asset Types % of Annualized Base Rent (1) 9.2% 7.1% 6.5% 4.8% 3.9% 3.5% 3.4% 3.1% 2.6% 2.4% Encompass Memorial Health Kindred Health OCOM Trinity Health Carrus Hospital Steward Health Pipeline Health Curahealth Select Medical MOB Total 57.3% MOB 32.3% MOB/ASC 19.3% MOB/Imaging/ER 5.7% IRF 23.9% Surgical Hospital 8.4% Office 3.1% LTACH 3.1% Acute Hospital 3.0% FSED 1.2%
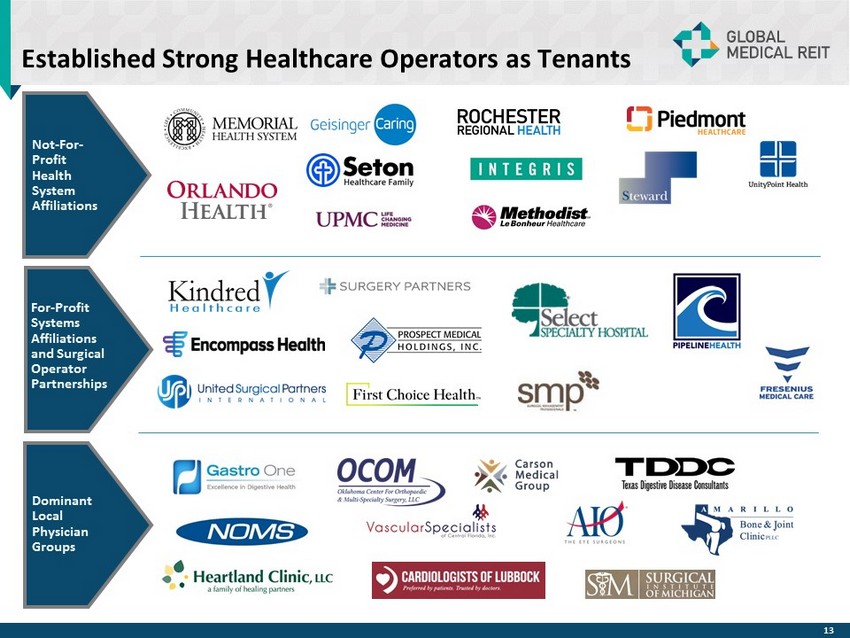
Established Strong Healthcare Operators as Tenants Not - For - Profit Health System Affiliations For - Profit Systems Affiliations and Surgical Operator Partnerships Dominant Local Physician Groups 13
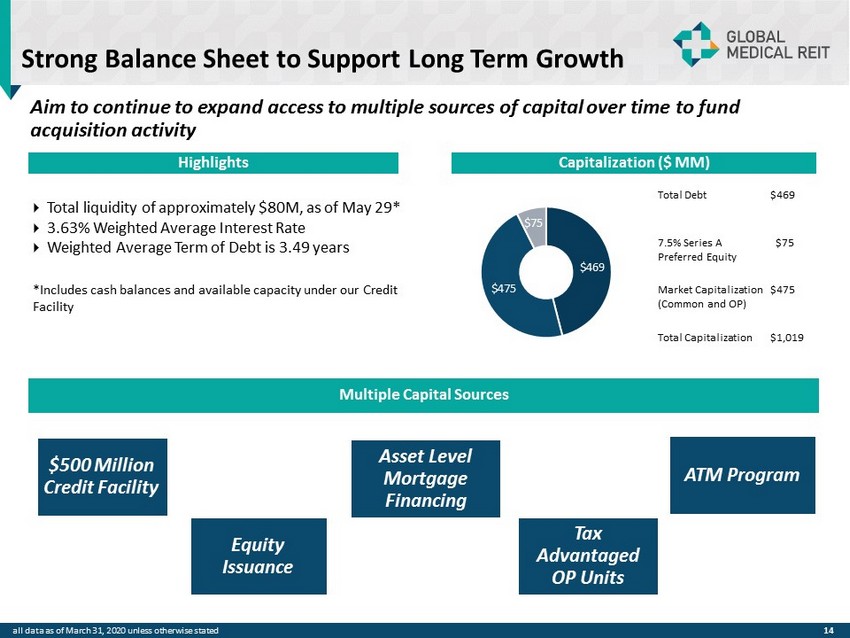
14 Strong Balance Sheet to Support Long Term Growth Mercy/Kindred Oklahoma City Facility Capitalization ($ MM ) $469 $475 $75 Highlights Total liquidity of approximately $80M, as of May 29* 3.63% Weighted Average Interest Rate Weighted Average Term of Debt is 3.49 years *Includes cash balances and available capacity under our Credit F acility Multiple Capital Sources Asset Level Mortgage Financing $500 Million Credit Facility Equity Issuance ATM Program Tax Advantaged OP Units Aim to continue to expand access to multiple sources of capital over time to fund acquisition activity Total Debt $469 7.5% Series A Preferred Equity $75 Market Capitalization (Common and OP) $475 Total Capitalization $1,019 all data as of March 31, 2020 unless otherwise stated
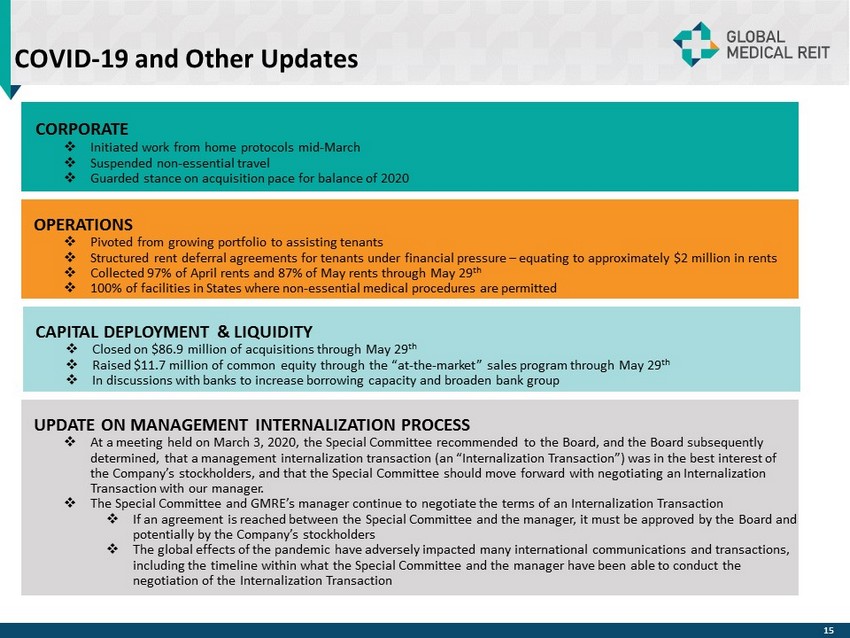
COVID - 19 and Other Updates 15 CORPORATE □ Initiated work from home protocols mid - March □ Suspended non - essential travel □ Guarded stance on acquisition pace for balance of 2020 OPERATIONS □ Pivoted from growing portfolio to assisting tenants □ Structured rent deferral agreements for tenants under financial pressure – equating to approximately $2 million in rents □ Collected 97% of April rents and 87% of May rents through May 29 th □ 100% of facilities in States where non - essential medical procedures are permitted CAPITAL DEPLOYMENT & LIQUIDITY □ Closed on $86.9 million of acquisitions through May 29 th □ Raised $11.7 million of common equity through the “at - the - market” sales program through May 29 th □ In discussions with banks to increase borrowing capacity and broaden bank group UPDATE ON MANAGEMENT INTERNALIZATION PROCESS □ At a meeting held on March 3, 2020, the Special Committee recommended to the Board, and the Board subsequently determined, that a management internalization transaction (an “Internalization Transaction”) was in the best interest of the Company’s stockholders, and that the Special Committee should move forward with negotiating an Internalization Transaction with our manager. □ The Special Committee and GMRE’s manager continue to negotiate the terms of an Internalization Transaction □ If an agreement is reached between the Special Committee and the manager, it must be approved by the Board and potentially by the Company’s stockholders □ The global effects of the pandemic have adversely impacted many international communications and transactions, including the timeline within what the Special Committee and the manager have been able to conduct the negotiation of the Internalization Transaction
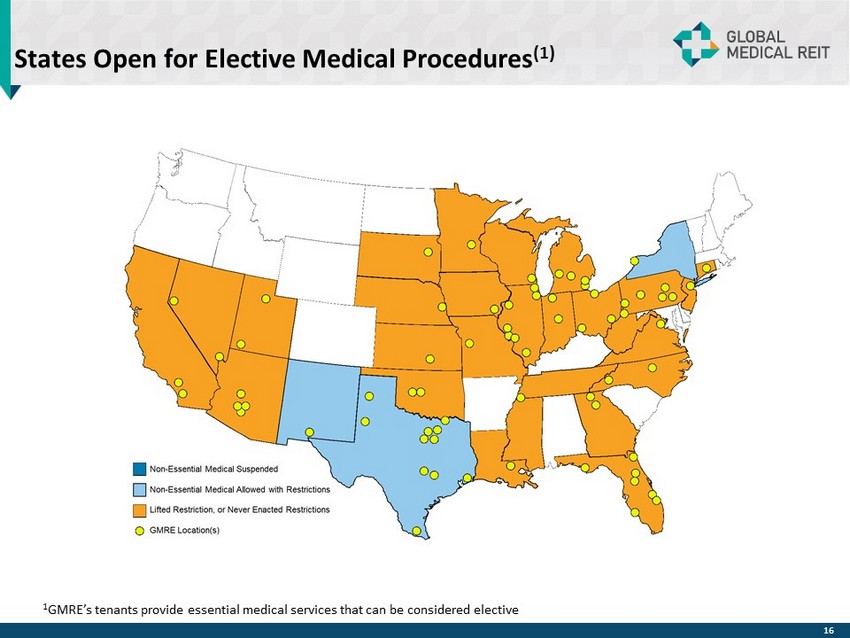
States Open for Elective Medical Procedures (1) 16 1 GMRE’s tenants provide essential medical services that can be considered elective
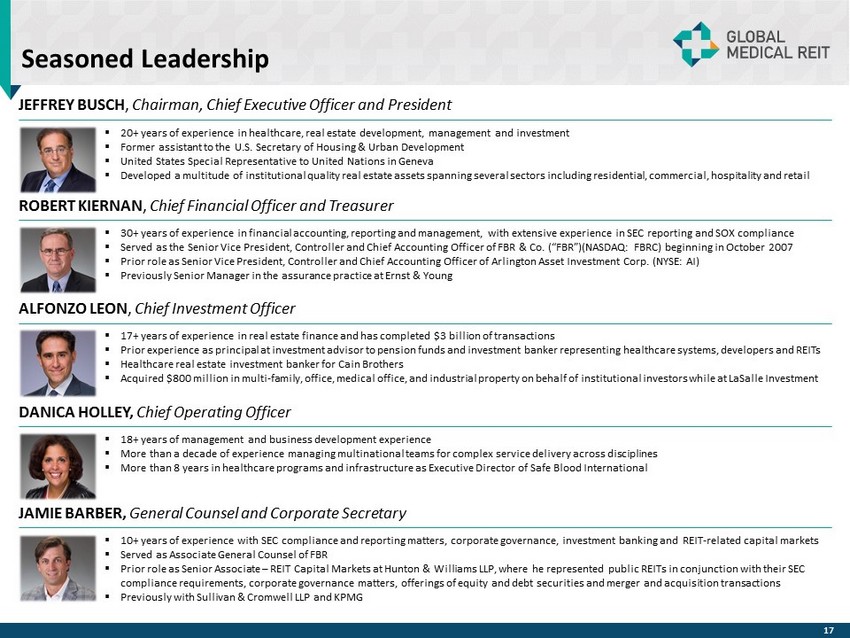
Seasoned Leadership JEFFREY BUSCH , Chairman, Chief Executive Officer and President ROBERT KIERNAN , Chief Financial Officer and Treasurer ALFONZO LEON , Chief Investment Officer ▪ 17 + years of experience in real estate finance and has completed $ 3 billion of transactions ▪ Prior experience as principal at investment advisor to pension funds and investment banker representing healthcare systems, d eve lopers and REITs ▪ Healthcare real estate investment banker for Cain Brothers ▪ Acquired $ 800 million in multi - family, office, medical office, and industrial property on behalf of institutional investors while at LaSalle Investment DANICA HOLLEY, Chief Operating Officer ▪ 18 + years of management and business development experience ▪ More than a decade of experience managing multinational teams for complex service delivery across disciplines ▪ More than 8 years in healthcare programs and infrastructure as Executive Director of Safe Blood International ▪ 10+ years of experience with SEC compliance and reporting matters, corporate governance, investment banking and REIT - related ca pital markets ▪ Served as Associate General Counsel of FBR ▪ Prior role as Senior Associate – REIT Capital Markets at Hunton & Williams LLP, where he represented public REITs in conjunction with their SEC compliance requirements, corporate governance matters, offerings of equity and debt securities and merger and acquisition tra nsa ctions ▪ Previously with Sullivan & Cromwell LLP and KPMG JAMIE BARBER, General Counsel and Corporate Secretary ▪ 20+ years of experience in healthcare, real estate development, management and investment ▪ Former assistant to the U.S. Secretary of Housing & Urban Development ▪ United States Special Representative to United Nations in Geneva ▪ Developed a multitude of institutional quality real estate assets spanning several sectors including residential, commercial, ho spitality and retail ▪ 30+ years of experience in financial accounting, reporting and management, with extensive experience in SEC reporting and SOX co mpliance ▪ Served as the Senior Vice President, Controller and Chief Accounting Officer of FBR & Co. (“FBR”)(NASDAQ: FBRC) beginning in Oct ober 2007 ▪ Prior role as Senior Vice President, Controller and Chief Accounting Officer of Arlington Asset Investment Corp. (NYSE: AI) ▪ Previously Senior Manager in the assurance practice at Ernst & Young 17
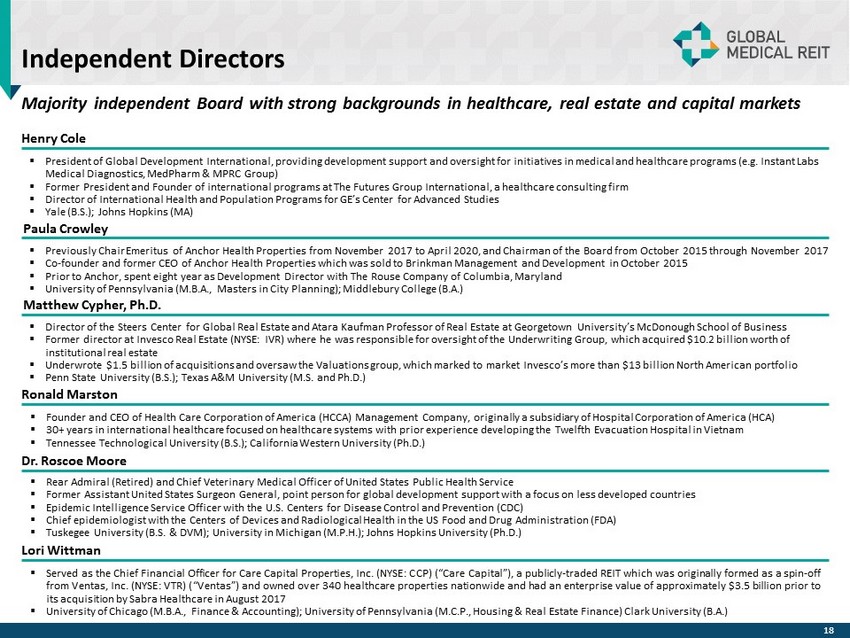
Independent Directors Majority independent Board with strong backgrounds in healthcare, real estate and capital markets Henry Cole ▪ President of Global Development International, providing development support and oversight for initiatives in medical and hea lth care programs (e.g. Instant Labs Medical Diagnostics, MedPharm & MPRC Group) ▪ Former President and Founder of international programs at The Futures Group International, a healthcare consulting firm ▪ Director of International Health and Population Programs for GE’s Center for Advanced Studies ▪ Yale (B.S.); Johns Hopkins (MA) Matthew Cypher, Ph.D. ▪ Director of the Steers Center for Global Real Estate and Atara Kaufman Professor of Real Estate at Georgetown University’s Mc Don ough School of Business ▪ Former director at Invesco Real Estate (NYSE: IVR) where he was responsible for oversight of the Underwriting Group, which ac qui red $10.2 billion worth of institutional real estate ▪ Underwrote $1.5 billion of acquisitions and oversaw the Valuations group, which marked to market Invesco’s more than $13 bill ion North American portfolio ▪ Penn State University (B.S.); Texas A&M University (M.S. and Ph.D.) Lori Wittman ▪ Served as the Chief Financial Officer for Care Capital Properties, Inc . (NYSE : CCP) (“Care Capital”), a publicly - traded REIT which was originally formed as a spin - off from Ventas, Inc . (NYSE : VTR) (“Ventas”) and owned over 340 healthcare properties nationwide and had an enterprise value of approximately $ 3 . 5 billion prior to its acquisition by Sabra Healthcare in August 2017 ▪ University of Chicago (M . B . A . , Finance & Accounting) ; University of Pennsylvania (M . C . P . , Housing & Real Estate Finance) Clark University (B . A . ) Ronald Marston ▪ Founder and CEO of Health Care Corporation of America (HCCA) Management Company, originally a subsidiary of Hospital Corporation of America (HCA) ▪ 30 + years in international healthcare focused on healthcare systems with prior experience developing the Twelfth Evacuation Hospital in Vietnam ▪ Tennessee Technological University (B . S . ) ; California Western University (Ph . D . ) ▪ Rear Admiral (Retired) and Chief Veterinary Medical Officer of United States Public Health Service ▪ Former Assistant United States Surgeon General, point person for global development support with a focus on less developed countries ▪ Epidemic Intelligence Service Officer with the U . S . Centers for Disease Control and Prevention (CDC) ▪ Chief epidemiologist with the Centers of Devices and Radiological Health in the US Food and Drug Administration (FDA) ▪ Tuskegee University (B . S . & DVM) ; University in Michigan (M . P . H . ) ; Johns Hopkins University (Ph . D . ) Dr. Roscoe Moore Paula Crowley ▪ Previously Chair Emeritus of Anchor Health Properties from November 2017 to April 2020, and Chairman of the Board from October 2015 through November 2017 ▪ Co - founder and former CEO of Anchor Health Properties which was sold to Brinkman Management and Development in October 2015 ▪ Prior to Anchor, spent eight year as Development Director with The Rouse Company of Columbia, Maryland ▪ University of Pennsylvania (M.B.A., Masters in City Planning); Middlebury College (B.A.) 18
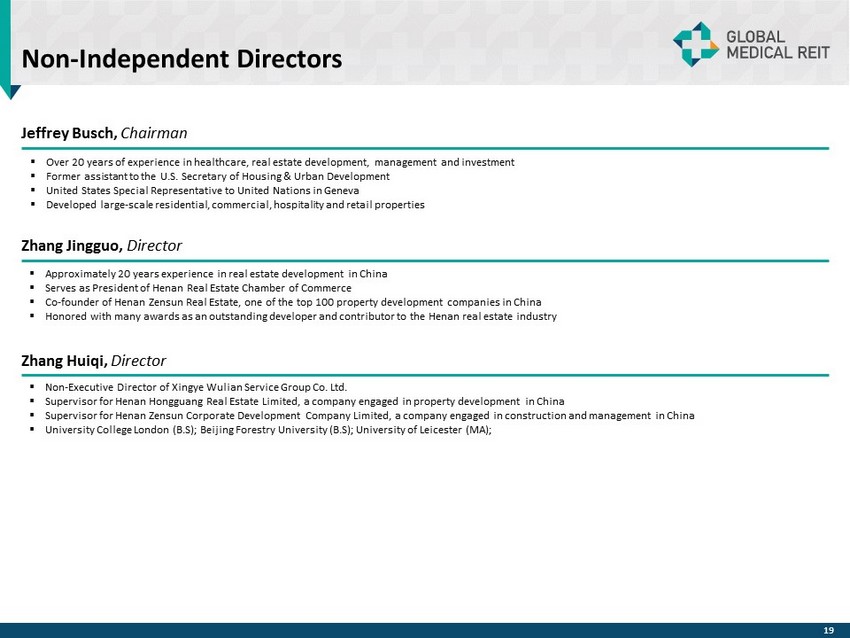
Non - Independent Directors Jeffrey Busch, Chairman ▪ Over 20 years of experience in healthcare, real estate development, management and investment ▪ Former assistant to the U.S. Secretary of Housing & Urban Development ▪ United States Special Representative to United Nations in Geneva ▪ Developed large - scale residential, commercial, hospitality and retail properties Zhang Jingguo, Director ▪ Approximately 20 years experience in real estate development in China ▪ Serves as President of Henan Real Estate Chamber of Commerce ▪ Co - founder of Henan Zensun Real Estate, one of the top 100 property development companies in China ▪ Honored with many awards as an outstanding developer and contributor to the Henan real estate industry ▪ Non - Executive Director of Xingye Wulian Service Group Co . Ltd . ▪ Supervisor for Henan Hongguang Real Estate Limited, a company engaged in property development in China ▪ Supervisor for Henan Zensun Corporate Development Company Limited, a company engaged in construction and management in China ▪ University College London (B . S) ; Beijing Forestry University (B . S) ; University of Leicester (MA) ; Zhang Huiqi, Director 19
Disclosures 20 Portfolio Snapshot (see page 3 ) Annualized Base Rent (ABR) represents monthly base rent at March 31 , 2020 multiplied by 12 (or actual NOI for cCare , East Lansing Bannockburn, and Mission Health properties) . Accordingly, this methodology produces an annualized amount as of a point in time but does not take into account future contractual rental rate increases . In addition, Grand Rapids reflects a $ 0 . 3 million reduction related to COVID - 19 and resulted in a weighted - average lease term extension of 4 . 2 years . Accordingly, this methodology produces an annualized amount as of a point in time but does not take into account future contractual rental rate increases . Certain lease guarantees are for less than 100 % of the contractual rental payments . Carrus Specialty Hospital does not include 12 , 000 square feet of shell space . Rent Coverage Ratio (see pages 3 and 11 ) For purposes of calculating our portfolio weighted - average EBITDARM coverage ratio (“Rent Coverage Ratio”), we excluded credit - rated tenants or their subsidiaries for which financial statements were either not available or not sufficiently detailed . These ratios are based on latest available information only . Most tenant financial statements are unaudited and we have not independently verified any tenant financial information (audited or unaudited) and, therefore, we cannot assure you that such information is accurate or complete . Certain other tenants (approximately 11 % of our portfolio) are excluded from the calculation due to lack of available financial information . Additionally, our Rent Coverage Ratio adds back physician distributions and compensation . Management believes that all adjustments are reasonable and necessary . Our Rent Coverage Ratio as of March 31 , 2020 does not take into account the effects of the COVID - 19 pandemic on our tenants’ businesses . Due to the significant reduction in our tenants’ businesses due to the pandemic, we expect the Rent Coverage Ratio to be materially lower for the remainder of 2020 and possibly longer . all data as of March 31, 2020 unless otherwise stated
INVESTOR RELATIONS Evelyn Infurna Evelyn.Infurna@icrinc.com 203.682.8265