Exhibit 99.1
Investor Presentation Update June 2020 January 2021
Forward - Looking Statements 1 This presentation is for informational purposes only and does not constitute an offer to sell, or a solicitation of offers to purchase, Global Medical REIT Inc . ’s (the “Company”, or “GMRE”) securities . The information contained in this presentation does not purport to be complete and should not be relied upon as a basis for making an investment decision in the Company’s securities . This presentation also contains statements that, to the extent they are not recitations of historical fact, constitute “forward - looking statements . ” Forward - looking statements are typically identified by the use of terms such as “may,” “should,” “expect,” “could,” “intend,” “plan,” “anticipate,” “estimate,” “believe,” “continue,” “predict,” “potential” or the negative of such terms and other comparable terminology . The forward - looking statements included herein are based upon the Company’s current expectations, plans, estimates, assumptions and beliefs that involve numerous risks and uncertainties . Assumptions relating to the foregoing involve judgments with respect to, among other things, future economic, competitive and market conditions and future business decisions, all of which are difficult or impossible to predict accurately and many of which are beyond the Company’s control . Although the Company believes that the expectations reflected in such forward - looking statements are based on reasonable assumptions, the Company’s actual results and performance could differ materially from those set forth in the forward - looking statements due to the impact of many factors including, but not limited to, those discussed under “Risk Factors” in the Company’s Annual Report on Form 10 - K and Quarterly Reports on Form 10 - Q and any prospectus or prospectus supplement filed with the Securities and Exchange Commission (“SEC”) . The Company undertakes no obligation to update or revise any such information for any reason after the date of this presentation, unless required by law . This presentation includes information regarding certain of our tenants, which are not subject to SEC reporting requirements . The information related to our tenants contained in this report was provided to us by such tenants or was derived from publicly available information . We have not independently investigated or verified this information . We have no reason to believe that this information is inaccurate in any material respect, but we cannot provide any assurance of its accuracy . We are providing this data for informational purposes only .
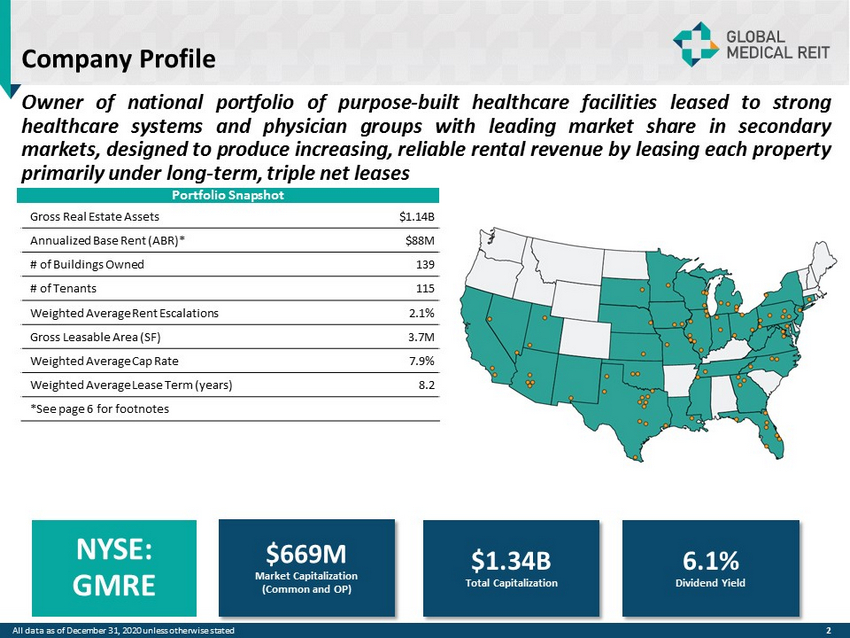
Company Profile 2 Owner of national portfolio of purpose - built healthcare facilities leased to strong healthcare systems and physician groups with leading market share in secondary markets, designed to produce increasing, reliable rental revenue by leasing each property primarily under long - term, triple net leases Gross Real Estate Assets $1.14B Annualized Base Rent (ABR)* $88M # of Buildings Owned 139 # of Tenants 115 Weighted Average Rent Escalations 2.1% Gross Leasable Area (SF) 3.7M Weighted Average Cap Rate 7.9% Weighted Average Lease Term (years) 8.2 *See page 6 for footnotes Portfolio Snapshot All data as of December 31, 2020 unless otherwise stated $669M Market Capitalization (Common and OP) NYSE: GMRE 6.1% Dividend Yield $1.34B Total Capitalization
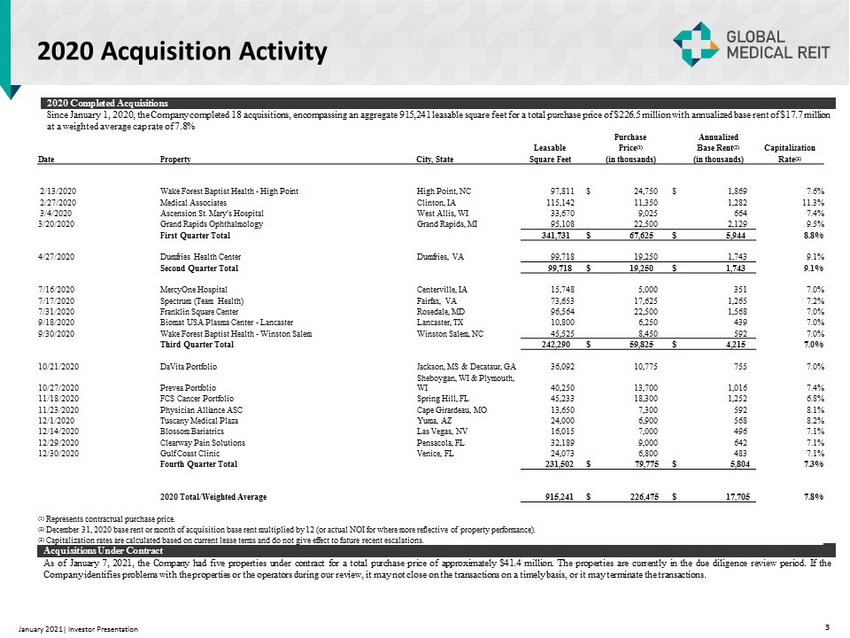
2020 Completed Acquisitions Since January 1, 2020 , the Company completed 18 acquisitions, encompassing an aggregate 915,241 leasable square feet for a total purchase price of $2 26.5 million with annualized base rent of $17.7 million at a weighted average cap rate of 7.8% 3 January 2021| Investor Presentation Acquisitions Under Contract As of January 7 , 2021 , the Company had five properties under contract for a total purchase price of approximately $ 41 . 4 million . The properties are currently in the due diligence review period . If the Company identifies problems with the properties or the operators during our review, it may not close on the transactions on a timely basis, or it may terminate the transactions . Purchase Annualized Leasable Price (1) Base Rent (2) Capitalization Date Property City, State Square Feet (in thousands) (in thousands) Rate (3) 2/13/2020 Wake Forest Baptist Health - High Point High Point, NC 97,811 $ 24,750 $ 1,869 7.6% 2/27/2020 Medical Associates Clinton, IA 115,142 11,350 1,282 11.3% 3/4/2020 Ascension St. Mary's Hospital West Allis, WI 33,670 9,025 664 7.4% 3/20/2020 Grand Rapids Ophthalmology Grand Rapids, MI 95,108 22,500 2,129 9.5% First Quarter Total 341,731 $ 67,625 $ 5,944 8.8% 4/27/2020 Dumfries Health Center Dumfries, VA 99,718 19,250 1,743 9.1% Second Quarter Total 99,718 $ 19,250 $ 1,743 9.1% 7/16/2020 MercyOne Hospital Centerville, IA 15,748 5,000 351 7.0% 7/17/2020 Spectrum (Team Health) Fairfax, VA 73,653 17,625 1,265 7.2% 7/31/2020 Franklin Square Center Rosedale, MD 96,564 22,500 1,568 7.0% 9/18/2020 Biomat USA Plasma Center - Lancaster Lancaster, TX 10,800 6,250 439 7.0% 9/30/2020 Wake Forest Baptist Health - Winston Salem Winston Salem, NC 45,525 8,450 592 7.0% Third Quarter Total 242,290 $ 59,825 $ 4,215 7.0% 10/21/2020 DaVita Portfolio Jackson, MS & Decataur, GA 36,092 10,775 755 7.0% 10/27/2020 Prevea Portfolio Sheboygan, WI & Plymouth, WI 40,250 13,700 1,016 7.4% 11/18/2020 FCS Cancer Portfolio Spring Hill, FL 45,233 18,300 1,252 6.8% 11/23/2020 Physician Alliance ASC Cape Girardeau, MO 13,650 7,300 592 8.1% 12/1/2020 Tuscany Medical Plaza Yuma, AZ 24,000 6,900 568 8.2% 12/14/2020 Blossom Bariatrics Las Vegas, NV 16,015 7,000 496 7.1% 12/29/2020 Clearway Pain Solutions Pensacola, FL 32,189 9,000 642 7.1% 12/30/2020 Gulf Coast Clinic Venice, FL 24,073 6,800 483 7.1% Fourth Quarter Total 231,502 $ 79,775 $ 5,804 7.3% 2020 Total/Weighted Average 915,241 $ 226,475 $ 17,705 7.8% (1) Represents contractual purchase price. (2) December 31, 2020 base rent or month of acquisition base rent multiplied by 12 (or actual NOI for where more reflective of property performance ). (3) Capitalization rates are calculated based on current lease terms and do not give effect to future recent escalations. 2020 Acquisition Activity
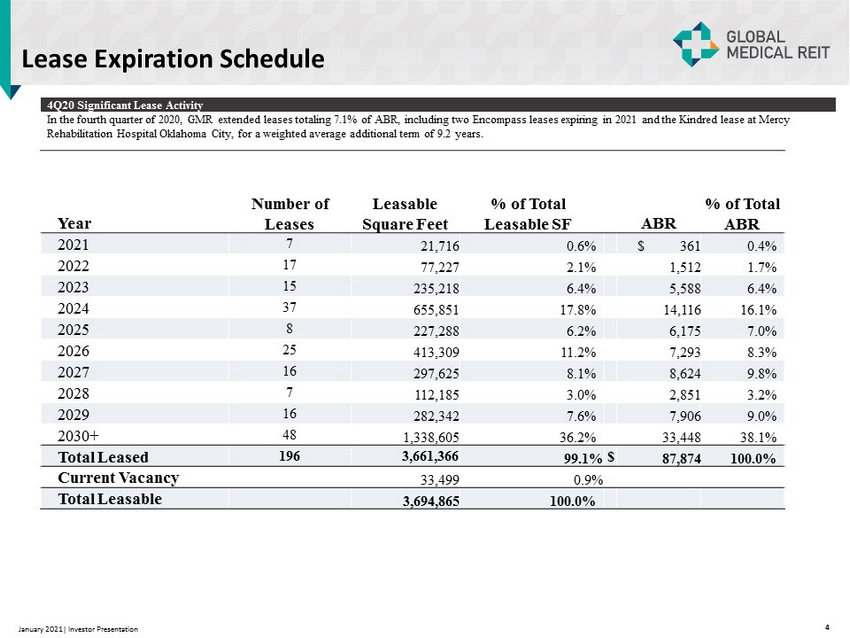
Lease Expiration Schedule 4 Q 20 Significant Lease Activity In the fourth quarter of 2020, GMR extended leases totaling 7.1% of ABR, including two Encompass leases expiring in 2021 and the Kindred lease at Mercy Rehabilitation Hospital Oklahoma City, for a weighted average additional term of 9.2 years. Year Number of Leases Leasable Square Feet % of Total Leasable SF ABR % of Total ABR 2021 7 21,716 0.6% $ 361 0.4% 2022 17 77,227 2.1% 1,512 1.7% 2023 15 235,218 6.4% 5,588 6.4% 2024 37 655,851 17.8% 14,116 16.1% 2025 8 227,288 6.2% 6,175 7.0% 2026 25 413,309 11.2% 7,293 8.3% 2027 16 297,625 8.1% 8,624 9.8% 2028 7 112,185 3.0% 2,851 3.2% 2029 16 282,342 7.6% 7,906 9.0% 2030+ 48 1,338,605 36.2% 33,448 38.1% Total Leased 196 3,661,366 99.1% $ 87,874 100.0% Current Vacancy 33,499 0.9% Total Leasable 3,694,865 100.0% January 2021| Investor Presentation 4
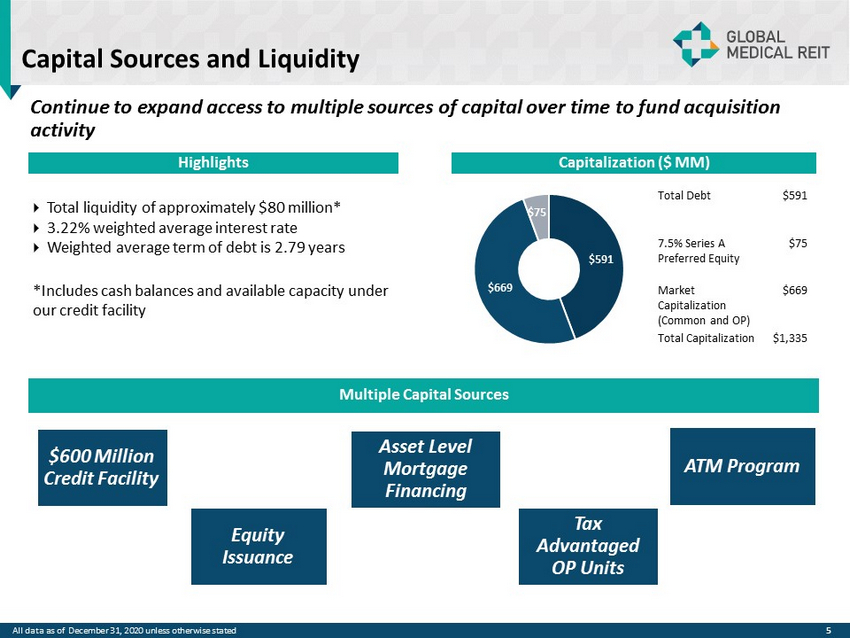
5 Capital Sources and Liquidity Mercy/Kindred Oklahoma City Facility Capitalization ($ MM) $591 $669 $75 Highlights Total liquidity of approximately $80 million* 3.22% weighted average interest rate Weighted average term of debt is 2.79 years *Includes cash balances and available capacity under our credit facility Multiple Capital Sources Asset Level Mortgage Financing $600 Million Credit Facility Equity Issuance ATM Program Tax Advantaged OP Units Continue to expand access to multiple sources of capital over time to fund acquisition activity Total Debt $591 7.5% Series A Preferred Equity $75 Market Capitalization (Common and OP) $669 Total Capitalization $1,335 All data as of December 31, 2020 unless otherwise stated
Footnotes 6 Annualized Base Rent Monthly base rent at December 31 , 2020 multiplied by 12 (or actual NOI where more reflective of property performance) . Accordingly, this methodology produces an annualized amount as of a point in time but does not take into account future contractual rental rate increases . All data as of December 31, 2020 unless otherwise stated
INVESTOR RELATIONS Evelyn Infurna Evelyn.Infurna@icrinc.com 203.682.8265