Exhibit 99.2
First Quarter 2021 Earnings Supplemental Three Months Ended March 31, 2021 www.globalmedicalreit.com NYSE: GMRE
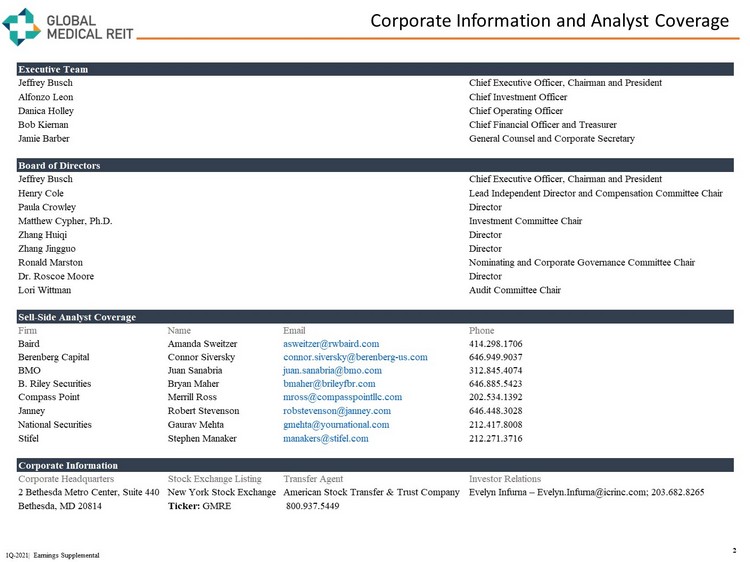
Corporate Information and Analyst Coverage 2 1Q - 2021| Earnings Supplemental Executive Team Jeffrey Busch Chief Executive Officer, Chairman and President Alfonzo Leon Chief Investment Officer Danica Holley Chief Operating Officer Bob Kiernan Chief Financial Officer and Treasurer Jamie Barber General Counsel and Corporate Secretary Board of Directors Jeffrey Busch Chief Executive Officer, Chairman and President Henry Cole Lead Independent Director and Compensation Committee Chair Paula Crowley Director Matthew Cypher, Ph.D. Investment Committee Chair Zhang Huiqi Director Zhang Jingguo Director Ronald Marston Nominating and Corporate Governance Committee Chair Dr. Roscoe Moore Director Lori Wittman Audit Committee Chair Sell-Side Analyst Coverage Firm Name Email Phone Baird Amanda Sweitzer asweitzer@rwbaird.com 414.298.1706 Berenberg Capital Connor Siversky connor.siversky@berenberg-us.com 646.949.9037 BMO Juan Sanabria juan.sanabria@bmo.com 312.845.4074 B. Riley Securities Bryan Maher bmaher@brileyfbr.com 646.885.5423 Compass Point Merrill Ross mross@compasspointllc.com 202.534.1392 Janney Robert Stevenson robstevenson@janney.com 646.448.3028 National Securities Gaurav Mehta gmehta@yournational.com 212.417.8008 Stifel Stephen Manaker manakers@stifel.com 212.271.3716 Corporate Information Corporate Headquarters Stock Exchange Listing Transfer Agent Investor Relations 2 Bethesda Metro Center, Suite 440 New York Stock Exchange American Stock Transfer & Trust Company Evelyn Infurna – Evelyn.Infurna@icrinc.com; 203.682.8265 Bethesda, MD 20814 Ticker: GMRE 800.937.5449
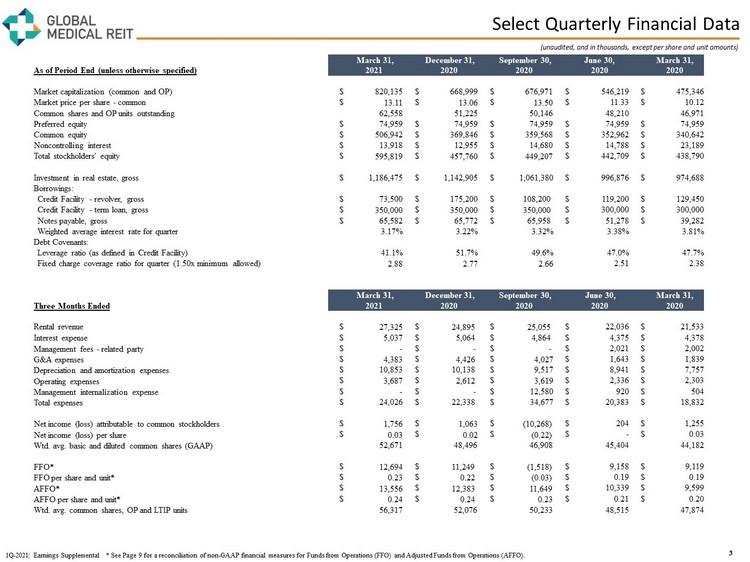
Select Quarterly Financial Data (unaudited, and in thousands, except per share and unit amounts) 3 1Q - 2021| Earnings Supplemental * See Page 9 for a reconciliation of non - GAAP financial measures for Funds from Operations (FFO) and Adjusted Funds from Operations (AFFO). March 31 , December 31, September 30, June 30, March 31, As of Period End (unless otherwise specified) 2021 2020 2020 2020 2020 Market capitalization (common and OP) $ 820,135 $ 668,999 $ 676,971 $ 546,219 $ 475,346 Market price per share - common $ 13.11 $ 13.06 $ 13.50 $ 11.33 $ 10.12 Common shares and OP units outstanding 62,558 51,225 50,146 48,210 46,971 Preferred equity $ 74,959 $ 74,959 $ 74,959 $ 74,959 $ 74,959 Common equity $ 506,942 $ 369,846 $ 359,568 $ 352,962 $ 340,642 Noncontrolling interest $ 13,918 $ 12,955 $ 14,680 $ 14,788 $ 23,189 Total stockholders' equity $ 595,819 $ 457,760 $ 449,207 $ 442,709 $ 438,790 Investment in real estate, gross $ 1,186,475 $ 1,142,905 $ 1,061,380 $ 996,876 $ 974,688 Borrowings: Credit Facility - revolver, gross $ 73,500 $ 175,200 $ 108,200 $ 119,200 $ 129,450 Credit Facility - term loan, gross $ 350,000 $ 350,000 $ 350,000 $ 300,000 $ 300,000 Notes payable, gross $ 65,582 $ 65,772 $ 65,958 $ 51,278 $ 39,282 Weighted average interest rate for quarter 3.17% 3.22% 3.32% 3.38% 3.81% Debt Covenants: Leverage ratio (as defined in Credit Facility) 41.1% 51.7% 49.6% 47.0% 47.7% Fixed charge coverage ratio for quarter (1.50x minimum allowed) 2.88 2.77 2.66 2.51 2.38 March 31, December 31, September 30, June 30, March 31, Three Months Ended 2021 2020 2020 2020 2020 Rental revenue $ 27,325 $ 24,895 $ 25,055 $ 22,036 $ 21,533 Interest expense $ 5,037 $ 5,064 $ 4,864 $ 4,375 $ 4,378 Management fees - related party $ - $ - $ - $ 2,021 $ 2,002 G&A expenses $ 4,383 $ 4,426 $ 4,027 $ 1,643 $ 1,839 Depreciation and amortization expenses $ 10,853 $ 10,138 $ 9,517 $ 8,941 $ 7,757 Operating expenses $ 3,687 $ 2,612 $ 3,619 $ 2,336 $ 2,303 Management internalization expense $ - $ - $ 12,580 $ 920 $ 504 Total expenses $ 24,026 $ 22,338 $ 34,677 $ 20,383 $ 18,832 Net income (loss) attributable to common stockholders $ 1,756 $ 1,063 $ (10,268) $ 204 $ 1,255 Net income (loss) per share $ 0.03 $ 0.02 $ (0.22) $ - $ 0.03 Wtd. avg. basic and diluted common shares (GAAP) 52,671 48,496 46,908 45,404 44,182 FFO* $ 12,694 $ 11,249 $ (1,518) $ 9,158 $ 9,119 FFO per share and unit* $ 0.23 $ 0.22 $ (0.03) $ 0.19 $ 0.19 AFFO* $ 13,556 $ 12,383 $ 11,649 $ 10,339 $ 9,599 AFFO per share and unit* $ 0.24 $ 0.24 $ 0.23 $ 0.21 $ 0.20 Wtd. avg. common shares, OP and LTIP units 56,317 52,076 50,233 48,515 47,874
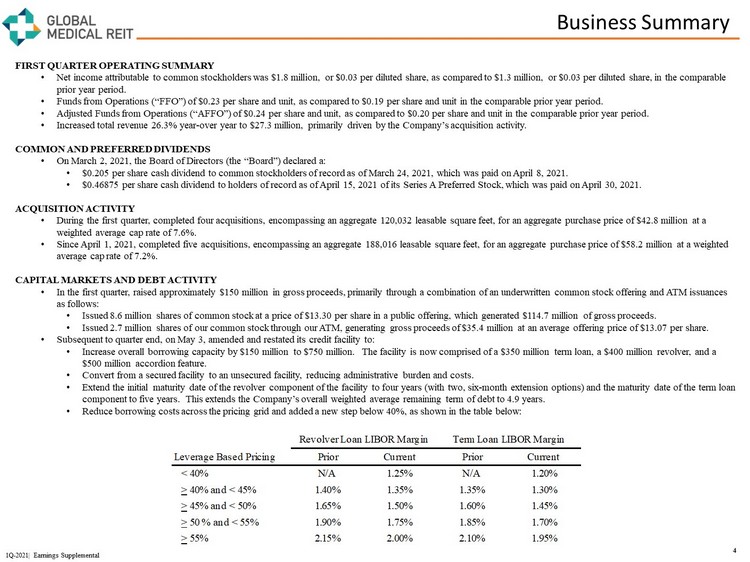
Business Summary 4 1Q - 2021| Earnings Supplemental FIRST QUARTER OPERATING SUMMARY • Net income attributable to common stockholders was $1.8 million, or $0.03 per diluted share, as compared to $1.3 million, or $0. 03 per diluted share, in the comparable prior year period. • Funds from Operations (“FFO”) of $0.23 per share and unit, as compared to $0.19 per share and unit in the comparable prior ye ar period. • Adjusted Funds from Operations (“AFFO”) of $0.24 per share and unit, as compared to $0.20 per share and unit in the comparabl e p rior year period. • Increased total revenue 26.3% year - over year to $27.3 million, primarily driven by the Company’s acquisition activity. COMMON AND PREFERRED DIVIDENDS • On March 2, 2021, the Board of Directors (the “Board”) declared a: • $0.205 per share cash dividend to common stockholders of record as of March 24, 2021, which was paid on April 8, 2021. • $0.46875 per share cash dividend to holders of record as of April 15, 2021 of its Series A Preferred Stock, which was paid on Ap ril 30, 2021. ACQUISITION ACTIVITY • During the first quarter, completed four acquisitions, encompassing an aggregate 120,032 leasable square feet, for an aggregate purc has e price of $ 42.8 million at a weighted average cap rate of 7.6%. • Since April 1, 2021, completed five acquisitions, encompassing an aggregate 188,016 leasable square feet, for an aggregate pu rch ase price of $ 58.2 million at a weighted average cap rate of 7.2%. CAPITAL MARKETS AND DEBT ACTIVITY • In the first quarter, raised approximately $150 million in gross proceeds, primarily through a combination of an underwritten co mmon stock offering and ATM issuances as follows: • Issued 8.6 million shares of common stock at a price of $13.30 per share in a public offering, which generated $114.7 million of gross proceeds. • Issued 2.7 million shares of our common stock through our ATM, generating gross proceeds of $35.4 million at an average offering price of $13.07 per share. • Subsequent to quarter end , on May 3, amended and restated its credit facility to: • Increase overall borrowing capacity by $150 million to $750 million. The facility is now comprised of a $350 million term lo an, a $400 million revolver, and a $500 million accordion feature. • Convert from a secured facility to an unsecured facility, reducing administrative burden and costs. • Extend the initial maturity date of the revolver component of the facility to four years (with two, six - month extension options) and the maturity date of the term loan component to five years. This extends the Company’s overall weighted average remaining term of debt to 4.9 years. • Reduce borrowing costs across the pricing grid and added a new step below 40 %, as shown in the table below: Leverage Based Pricing Prior Current Prior Current < 40% N/A 1.25% N/A 1.20% > 40% and < 45% 1.40% 1.35% 1.35% 1.30% > 45% and < 50% 1.65% 1.50% 1.60% 1.45% > 50 % and < 55% 1.90% 1.75% 1.85% 1.70% > 55% 2.15% 2.00% 2.10% 1.95% Term Loan LIBOR MarginRevolver Loan LIBOR Margin
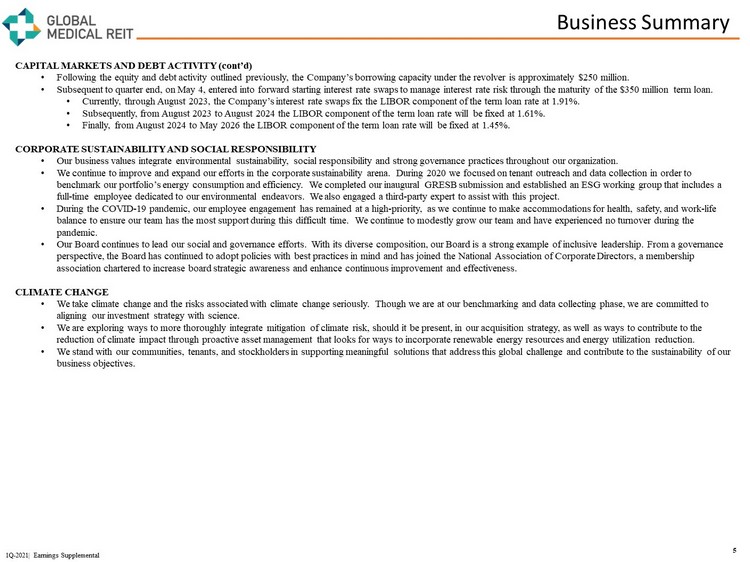
Business Summary 5 1Q - 2021| Earnings Supplemental CAPITAL MARKETS AND DEBT ACTIVITY (cont’d) • Following the equity and debt activity outlined previously, the Company’s borrowing capacity under the revolver is approximat ely $250 million. • Subsequent to quarter end , on May 4, entered into forward starting interest rate swaps to manage interest rate risk through the maturity of the $350 million term loan. • Currently, through August 2023, the Company’s interest rate swaps fix the LIBOR component of the term loan rate at 1.91%. • Subsequently, from August 2023 to August 2024 the LIBOR component of the term loan rate will be fixed at 1.61%. • Finally, from August 2024 to May 2026 the LIBOR component of the term loan rate will be fixed at 1.45%. CORPORATE SUSTAINABILITY AND SOCIAL RESPONSIBILITY • Our business values integrate environmental sustainability, social responsibility and strong governance practices throughout our organization. • We continue to improve and expand our efforts in the corporate sustainability arena. During 2020 we focused on tenant outrea ch and data collection in order to benchmark our portfolio’s energy consumption and efficiency. We completed our inaugural GRESB submission and established an ESG working group that includes a full - time employee dedicated to our environmental endeavors. We also engaged a third - party expert to assist with this project. • During the COVID - 19 pandemic, our employee engagement has remained at a high - priority, as we continue to make accommodations for health, safety, and work - life balance to ensure our team has the most support during this difficult time. We continue to modestly grow our team and have e xpe rienced no turnover during the pandemic. • Our Board continues to lead our social and governance efforts. With its diverse composition, our Board is a strong example of inclusive leadersh ip. From a governance perspective, the Board has continued to adopt policies with best practices in mind and has joined the National Association of Co rporate Directors, a membership association chartered to increase board strategic awareness and enhance continuous improvement and effectiveness. CLIMATE CHANGE • We take climate change and the risks associated with climate change seriously. Though we are at our benchmarking and data co lle cting phase, we are committed to aligning our investment strategy with science. • We are exploring ways to more thoroughly integrate mitigation of climate risk, should it be present, in our acquisition strategy, as well as ways to contribute to the reduction of climate impact through proactive asset management that looks for ways to incorporate renewable energy resources and energy utilization reduction. • We stand with our communities, tenants, and stockholders in supporting meaningful solutions that address this global challeng e a nd contribute to the sustainability of our business objectives.
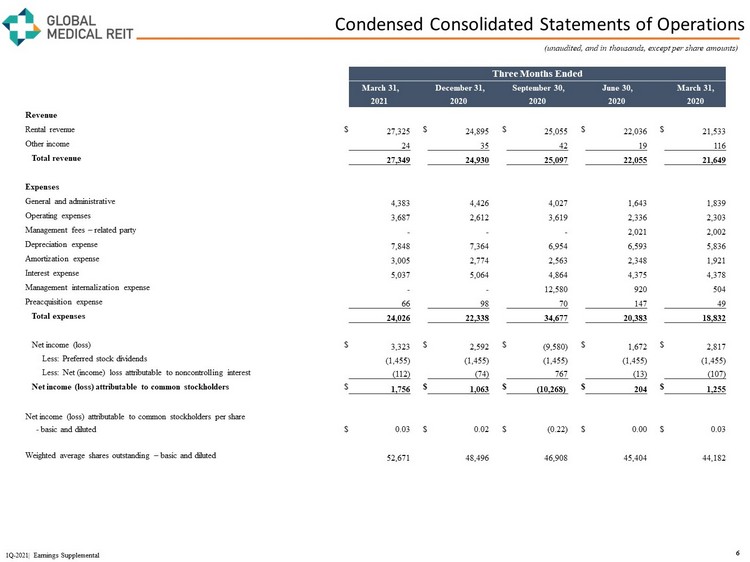
Condensed Consolidated Statements of Operations 6 1Q - 2021| Earnings Supplemental (unaudited, and in thousands, except per share amounts) Three Months Ended March 31, December 31, September 30, June 30, March 31, 2021 2020 2020 2020 2020 Revenue Rental revenue $ 27,325 $ 24,895 $ 25,055 $ 22,036 $ 21,533 Other income 24 35 42 19 116 Total revenue 27,349 24,930 25,097 22,055 21,649 Expenses General and administrative 4,383 4,426 4,027 1,643 1,839 Operating expenses 3,687 2,612 3,619 2,336 2,303 Management fees – related party - - - 2,021 2,002 Depreciation expense 7,848 7,364 6,954 6,593 5,836 Amortization expense 3,005 2,774 2,563 2,348 1,921 Interest expense 5,037 5,064 4,864 4,375 4,378 Management internalization expense - - 12,580 920 504 Preacquisition expense 66 98 70 147 49 Total expenses 24,026 22,338 34,677 20,383 18,832 Net income (loss) $ 3,323 $ 2,592 $ (9,580) $ 1,672 $ 2,817 Less: Preferred stock dividends (1,455) (1,455) (1,455) (1,455) (1,455) Less: Net (income) loss attributable to noncontrolling interest (112) (74) 767 (13) (107) Net income (loss) attributable to common stockholders $ 1,756 $ 1,063 $ (10,268) $ 204 $ 1,255 Net income (loss) attributable to common stockholders per share - basic and diluted $ 0.03 $ 0.02 $ (0.22) $ 0.00 $ 0.03 Weighted average shares outstanding – basic and diluted 52,671 48,496 46,908 45,404 44,182
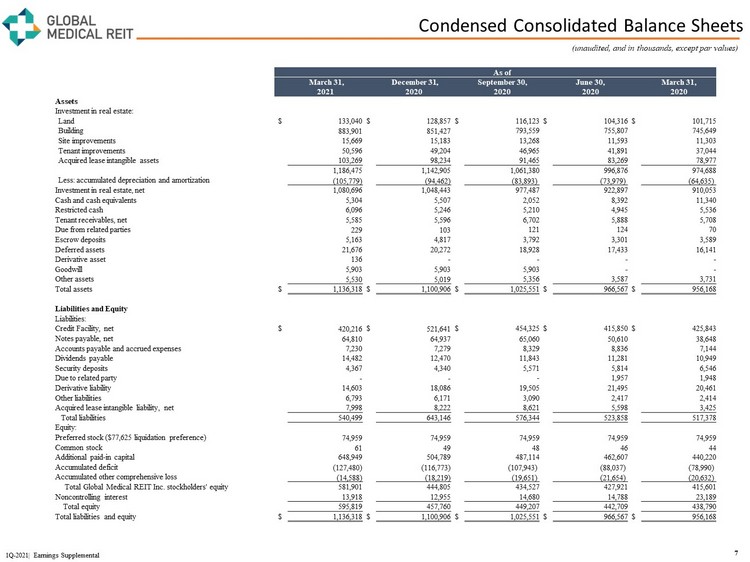
Condensed Consolidated Balance Sheets 7 1Q - 2021| Earnings Supplemental (unaudited, and in thousands, except par values) As of March 31, December 31, September 30, June 30, March 31, 2021 2020 2020 2020 2020 Assets Investment in real estate: Land $ 133,040 $ 128,857 $ 116,123 $ 104,316 $ 101,715 Building 883,901 851,427 793,559 755,807 745,649 Site improvements 15,669 15,183 13,268 11,593 11,303 Tenant improvements 50,596 49,204 46,965 41,891 37,044 Acquired lease intangible assets 103,269 98,234 91,465 83,269 78,977 1,186,475 1,142,905 1,061,380 996,876 974,688 Less: accumulated depreciation and amortization (105,779) (94,462) (83,893) (73,979) (64,635) Investment in real estate, net 1,080,696 1,048,443 977,487 922,897 910,053 Cash and cash equivalents 5,304 5,507 2,052 8,392 11,340 Restricted cash 6,096 5,246 5,210 4,945 5,536 Tenant receivables, net 5,585 5,596 6,702 5,888 5,708 Due from related parties 229 103 121 124 70 Escrow deposits 5,163 4,817 3,792 3,301 3,589 Deferred assets 21,676 20,272 18,928 17,433 16,141 Derivative asset 136 - - - - Goodwill 5,903 5,903 5,903 - - Other assets 5,530 5,019 5,356 3,587 3,731 Total assets $ 1,136,318 $ 1,100,906 $ 1,025,551 $ 966,567 $ 956,168 Liabilities and Equity Liabilities: Credit Facility, net $ 420,216 $ 521,641 $ 454,325 $ 415,850 $ 425,843 Notes payable, net 64,810 64,937 65,060 50,610 38,648 Accounts payable and accrued expenses 7,230 7,279 8,329 8,836 7,144 Dividends payable 14,482 12,470 11,843 11,281 10,949 Security deposits 4,367 4,340 5,571 5,814 6,546 Due to related party - - - 1,957 1,948 Derivative liability 14,603 18,086 19,505 21,495 20,461 Other liabilities 6,793 6,171 3,090 2,417 2,414 Acquired lease intangible liability, net 7,998 8,222 8,621 5,598 3,425 Total liabilities 540,499 643,146 576,344 523,858 517,378 Equity: Preferred stock ($77,625 liquidation preference) 74,959 74,959 74,959 74,959 74,959 Common stock 61 49 48 46 44 Additional paid - in capital 648,949 504,789 487,114 462,607 440,220 Accumulated deficit (127,480) (116,773) (107,943) (88,037) (78,990) Accumulated other comprehensive loss (14,588) (18,219) (19,651) (21,654) (20,632) Total Global Medical REIT Inc. stockholders' equity 581,901 444,805 434,527 427,921 415,601 Noncontrolling interest 13,918 12,955 14,680 14,788 23,189 Total equity 595,819 457,760 449,207 442,709 438,790 Total liabilities and equity $ 1,136,318 $ 1,100,906 $ 1,025,551 $ 966,567 $ 956,168
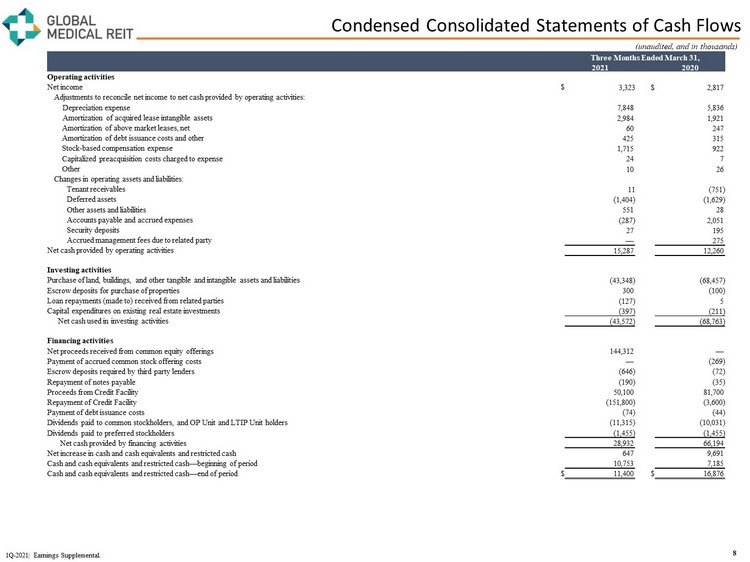
Condensed Consolidated Statements of Cash Flows 8 (unaudited, and in thousands) Three Months Ended March 31, 2021 2020 Operating activities Net income $ 3,323 $ 2,817 Adjustments to reconcile net income to net cash provided by operating activities: Depreciation expense 7,848 5,836 Amortization of acquired lease intangible assets 2,984 1,921 Amortization of above market leases, net 60 247 Amortization of debt issuance costs and other 425 315 Stock - based compensation expense 1,715 922 Capitalized preacquisition costs charged to expense 24 7 Other 10 26 Changes in operating assets and liabilities: Tenant receivables 11 (751) Deferred assets (1,404) (1,629) Other assets and liabilities 551 28 Accounts payable and accrued expenses ( 287) 2,051 Security deposits 27 195 Accrued management fees due to related party — 275 Net cash provided by operating activities 15,287 12,260 Investing activities Purchase of land, buildings, and other tangible and intangible assets and liabilities (43,348) (68,457) Escrow deposits for purchase of properties 300 (100) Loan repayments ( made to ) received from related parties (127) 5 Capital expenditures on existing real estate investments (397) (211) Net cash used in investing activities ( 43,572) (68,763) Financing activities Net proceeds received from common equity offerings 144,312 — Payment of accrued common stock offering costs — (269) Escrow deposits required by third party lenders (646) (72) Repayment of notes payable (190) (35) Proceeds from Credit Facility 50,100 81,700 Repayment of Credit Facility (151,800) (3,600) Payment of debt issuance costs (74) (44) Dividends paid to common stockholders, and OP Unit and LTIP Unit holders (11,315) (10,031) Dividends paid to preferred stockholders (1,455) (1,455) Net cash provided by financing activities 28,932 66,194 Net increase in cash and cash equivalents and restricted cash 647 9,691 Cash and cash equivalents and restricted cash — beginning of period 10,753 7,185 Cash and cash equivalents and restricted cash — end of period $ 11,400 $ 16,876 1Q - 2021| Earnings Supplemental.
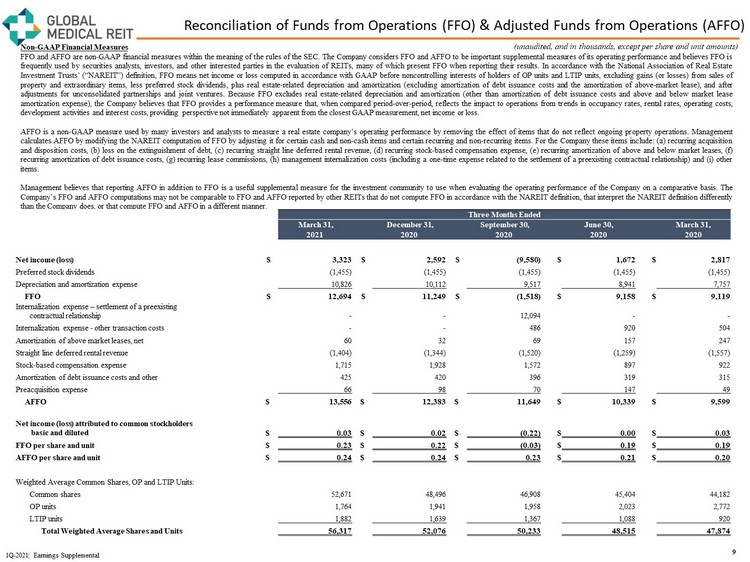
Reconciliation of Funds from Operations (FFO) & Adjusted Funds from Operations (AFFO) Non - GAAP Financial Measures FFO and AFFO are non - GAAP financial measures within the meaning of the rules of the SEC . The Company considers FFO and AFFO to be important supplemental measures of its operating performance and believes FFO is frequently used by securities analysts, investors, and other interested parties in the evaluation of REITs, many of which present FFO when reporting their results . In accordance with the National Association of Real Estate Investment Trusts’ (“NAREIT”) definition, FFO means net income or loss computed in accordance with GAAP before noncontrolling interests of holders of OP units and LTIP units, excluding gains (or losses) from sales of property and extraordinary items, less preferred stock dividends, plus real estate - related depreciation and amortization (excluding amortization of debt issuance costs and the amortization of above - market lease), and after adjustments for unconsolidated partnerships and joint ventures . Because FFO excludes real estate - related depreciation and amortization (other than amortization of debt issuance costs and above and below market lease amortization expense), the Company believes that FFO provides a performance measure that, when compared period - over - period, reflects the impact to operations from trends in occupancy rates, rental rates, operating costs, development activities and interest costs, providing perspective not immediately apparent from the closest GAAP measurement, net income or loss . AFFO is a non - GAAP measure used by many investors and analysts to measure a real estate company’s operating performance by removing the effect of items that do not reflect ongoing property operations . Management calculates AFFO by modifying the NAREIT computation of FFO by adjusting it for certain cash and non - cash items and certain recurring and non - recurring items . For the Company these items include : (a) recurring acquisition and disposition costs, (b) loss on the extinguishment of debt, (c) recurring straight line deferred rental revenue, (d) recurring stock - based compensation expense, (e) recurring amortization of above and below market leases, (f) recurring amortization of debt issuance costs, (g) recurring lease commissions, (h) management internalization costs (including a one - time expense related to the settlement of a preexisting contractual relationship) and (i) other items . Management believes that reporting AFFO in addition to FFO is a useful supplemental measure for the investment community to use when evaluating the operating performance of the Company on a comparative basis . The Company’s FFO and AFFO computations may not be comparable to FFO and AFFO reported by other REITs that do not compute FFO in accordance with the NAREIT definition, that interpret the NAREIT definition differently than the Company does, or that compute FFO and AFFO in a different manner . 9 1Q - 2021| Earnings Supplemental (unaudited, and in thousands, except per share and unit amounts) Three Months Ended March 31, December 31, September 30, June 30, March 31, 2021 2020 2020 2020 2020 Net income (loss) $ 3,323 $ 2,592 $ (9,580) $ 1,672 $ 2,817 Preferred stock dividends (1,455) (1,455) (1,455) (1,455) (1,455) Depreciation and amortization expense 10,826 10,112 9,517 8,941 7,757 FFO $ 12,694 $ 11,249 $ (1,518) $ 9,158 $ 9,119 Internalization expense – settlement of a preexisting contractual relationship - - 12,094 - - Internalization expense - other transaction costs - - 486 920 504 Amortization of above market leases, net 60 32 69 157 247 Straight line deferred rental revenue (1,404) (1,344) (1,520) (1,259) (1,557) Stock - based compensation expense 1,715 1,928 1,572 897 922 Amortization of debt issuance costs and other 425 420 396 319 315 Preacquisition expense 66 98 70 147 49 AFFO $ 13,556 $ 12,383 $ 11,649 $ 10,339 $ 9,599 Net income (loss) attributed to common stockholders basic and diluted $ 0.03 $ 0.02 $ (0.22) $ 0.00 $ 0.03 FFO per share and unit $ 0.23 $ 0.22 $ (0.03) $ 0.19 $ 0.19 AFFO per share and unit $ 0.24 $ 0.24 $ 0.23 $ 0.21 $ 0.20 Weighted Average Common Shares, OP and LTIP Units: Common shares 52,671 48,496 46,908 45,404 44,182 OP units 1,764 1,941 1,958 2,023 2,772 LTIP units 1,882 1,639 1,367 1,088 920 Total Weighted Average Shares and Units 56,317 52,076 50,233 48,515 47,874
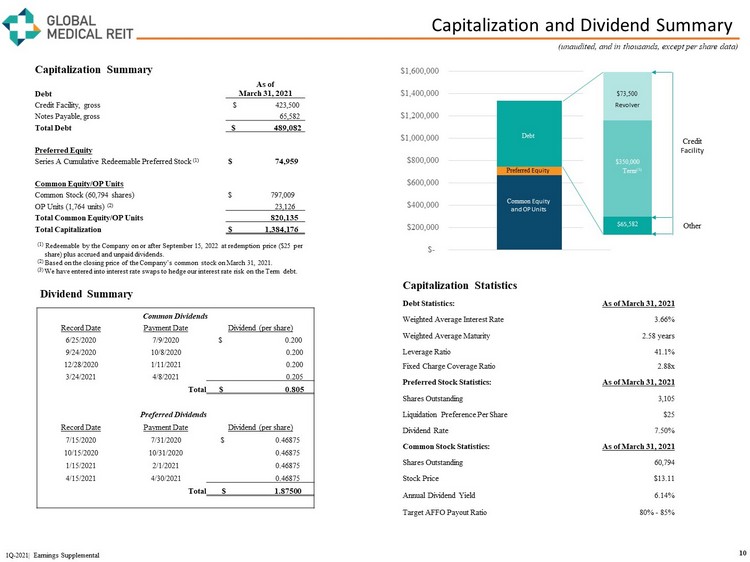
Capitalization and Dividend Summary 10 1Q - 2021| Earnings Supplemental (unaudited, and in thousands, except per share data) (1) Redeemable by the Company on or after September 15, 2022 at redemption price ($25 per share) plus accrued and unpaid dividends. (2) Based on the closing price of the Company’s common stock on March 31, 2021. (3) We have entered into interest rate swaps to hedge our interest rate risk on the Term debt. $- $200,000 $400,000 $600,000 $800,000 $1,000,000 $1,200,000 $1,400,000 $1,600,000 Debt Preferred Equity Common Equity and OP Units $350,000 $73,500 Revolver $65 ,582 Term (3) Credit Facility Other Capitalization Summary Debt As of March 31, 2021 Credit Facility, gross $ 423,500 Notes Payable, gross 65,582 Total Debt $ 489,082 Preferred Equity Series A Cumulative Redeemable Preferred Stock (1) $ 74,959 Common Equity/OP Units Common Stock (60,794 shares) $ 797,009 OP Units (1,764 units) (2) 23,126 Total Common Equity/OP Units 820,135 Total Capitalization $ 1,384,176 Capitalization Statistics Debt Statistics: As of March 31, 2021 Weighted Average Interest Rate 3.66% Weighted Average Maturity 2.58 years Leverage Ratio 41.1% Fixed Charge Coverage Ratio 2.88x Preferred Stock Statistics: As of March 31, 2021 Shares Outstanding 3,105 Liquidation Preference Per Share $25 Dividend Rate 7.50% Common Stock Statistics: As of March 31, 2021 Shares Outstanding 60,794 Stock Price $ 13.11 Annual Dividend Yield 6.14% Target AFFO Payout Ratio 80% - 85% Dividend Summary Common Dividends Record Date Payment Date Dividend (per share) 6/25/2020 7/9/2020 $ 0.200 9/24/2020 10/8/2020 0.200 12/28/2020 1/11/2021 0.200 3/24/2021 4/8/2021 0.205 Total $ 0.805 Preferred Dividends Record Date Payment Date Dividend (per share) 7/15/2020 7/31/2020 $ 0.46875 10/15/2020 10/31/2020 0.46875 1/15/2021 2/1/2021 0.46875 4/15/2021 4/30/2021 0.46875 Total $ 1.87500
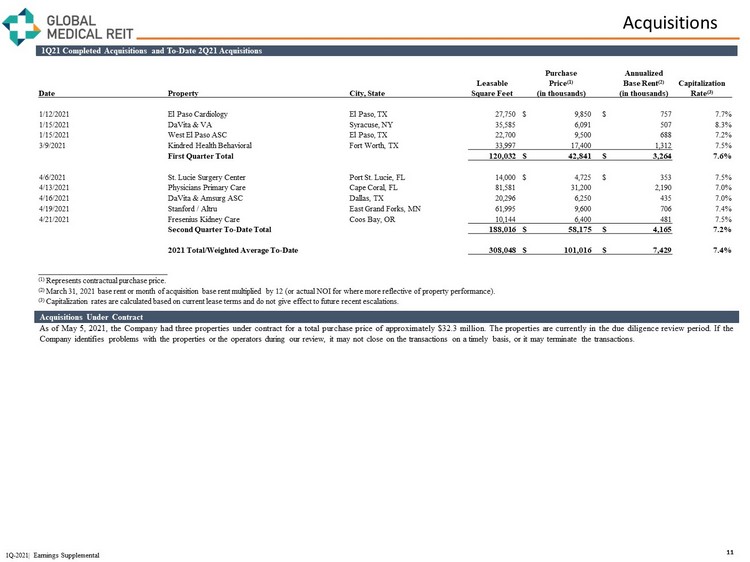
Acquisitions 11 1 Q 21 Completed Acquisitions and To - Date 2 Q 21 Acquisitions Acquisitions Under Contract As of May 5 , 2021 , the Company had three properties under contract for a total purchase price of approximately $ 32 . 3 million . The properties are currently in the due diligence review period . If the Company identifies problems with the properties or the operators during our review, it may not close on the transactions on a timely basis, or it may terminate the transactions . Purchase Annualized Leasable Price (1) Base Rent (2) Capitalization Date Property City, State Square Feet (in thousands) (in thousands) Rate (3) 1/12/2021 El Paso Cardiology El Paso, TX 27,750 $ 9,850 $ 757 7.7% 1/15/2021 DaVita & VA Syracuse, NY 35,585 6,091 507 8.3% 1/15/2021 West El Paso ASC El Paso, TX 22,700 9,500 688 7.2% 3/9/2021 Kindred Health Behavioral Fort Worth, TX 33,997 17,400 1,312 7.5% First Quarter Total 120,032 $ 42,841 $ 3,264 7.6% 4/6/2021 St. Lucie Surgery Center Port St. Lucie, FL 14,000 $ 4,725 $ 353 7.5% 4/13/2021 Physicians Primary Care Cape Coral, FL 81,581 31,200 2,190 7.0% 4/16/2021 DaVita & Amsurg ASC Dallas, TX 20,296 6,250 435 7.0% 4/19/2021 Stanford / Altru East Grand Forks, MN 61,995 9,600 706 7.4% 4/21/2021 Fresenius Kidney Care Coos Bay, OR 10,144 6,400 481 7.5% Second Quarter To - Date Total 188,016 $ 58,175 $ 4,165 7.2% 2021 Total/Weighted Average To - Date 308,048 $ 101,016 $ 7,429 7.4% (1) Represents contractual purchase price. (2) March 31, 2021 base rent or month of acquisition base rent multiplied by 12 (or actual NOI for where more reflective of property performance ). (3) Capitalization rates are calculated based on current lease terms and do not give effect to future recent escalations. 1Q - 2021| Earnings Supplemental
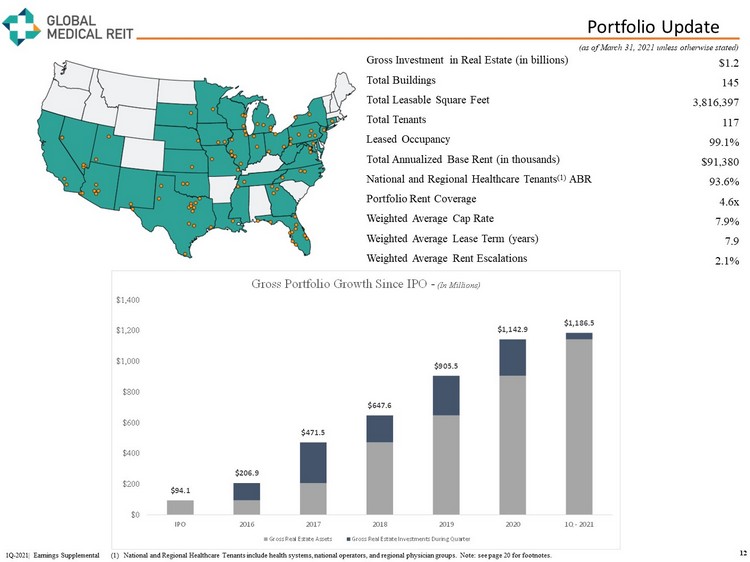
Portfolio Update 12 Gross Investment in Real Estate (in billions) $ 1.2 Total Buildings 145 Total Leasable Square Feet 3,816,397 Total Tenants 117 Leased Occupancy 99.1% Total Annualized Base Rent (in thousands) $91,380 National and Regional Healthcare Tenants (1) ABR 93.6% Portfolio Rent Coverage 4.6x Weighted Average Cap Rate 7.9% Weighted Average Lease Term (years) 7.9 Weighted Average Rent Escalations 2.1% (as of March 31, 2021 unless otherwise stated) 1Q - 2021| Earnings Supplemental (1) National and Regional Healthcare Tenants include health systems, national operators, and regional physician groups. Note: se e p age 20 for footnotes. $94.1 $206.9 $471.5 $647.6 $905.5 $1,142.9 $1,186.5 $0 $200 $400 $600 $800 $1,000 $1,200 $1,400 IPO 2016 2017 2018 2019 2020 1Q - 2021 Gross Portfolio Growth Since IPO - (In Millions) Gross Real Estate Assets Gross Real Estate Investments During Quarter
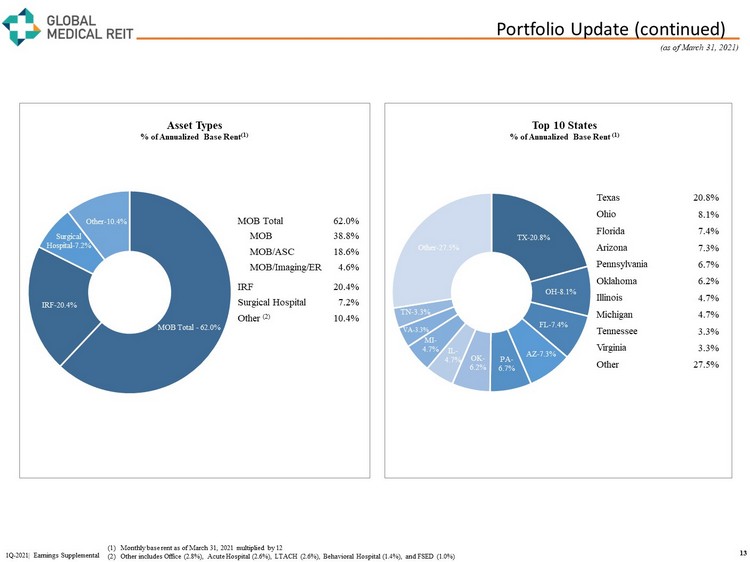
Portfolio Update (continued) 13 1Q - 2021| Earnings Supplemental (1) Monthly base rent as of March 31, 2021 multiplied by 12 (2) Other includes Office ( 2.8%), Acute Hospital ( 2.6%), LTACH ( 2.6%), Behavioral Hospital (1.4%), and FSED ( 1.0%) MOB Total - 62.0% IRF - 20.4% Surgical Hospital - 7.2% Other - 10.4% MOB Total 62.0% MOB 38.8% MOB/ASC 18.6% MOB/Imaging/ER 4.6% IRF 20.4% Surgical Hospital 7.2% Other (2) 10.4% Texas 20.8% Ohio 8.1% Florida 7.4% Arizona 7.3% Pennsylvania 6.7% Oklahoma 6.2% Illinois 4.7% Michigan 4.7% Tennessee 3.3% Virginia 3.3% Other 27.5% TX - 20.8% OH - 8.1% FL - 7.4% AZ - 7.3% PA - 6.7% OK - 6.2% IL - 4.7% MI - 4.7% VA - 3.3% TN - 3.3% Other - 27.5% Top 10 States % of Annualized Base Rent (1) Asset Types % of Annualized Base Rent (1) (as of March 31, 2021)
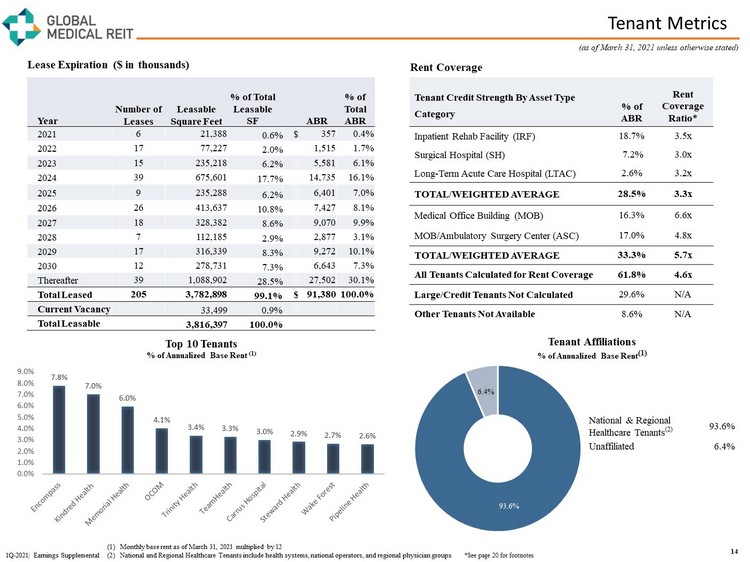
Tenant Metrics Year Number of Leases Leasable Square Feet % of Total Leasable SF ABR % of Total ABR 2021 6 21,388 0.6% $ 357 0.4% 2022 17 77,227 2.0% 1,515 1.7% 2023 15 235,218 6.2% 5,581 6.1% 2024 39 675,601 17.7% 14,735 16.1% 2025 9 235,288 6.2% 6,401 7.0% 2026 26 413,637 10.8% 7,427 8.1% 2027 18 328,382 8.6% 9,070 9.9% 2028 7 112,185 2.9% 2,877 3.1% 2029 17 316,339 8.3% 9,272 10.1% 2030 12 278,731 7.3% 6,643 7.3% Thereafter 39 1,088,902 28.5% 27,502 30.1% Total Leased 205 3,782,898 99.1% $ 91,380 100.0% Current Vacancy 33,499 0.9% Total Leasable 3,816,397 100.0% 14 1Q - 2021| Earnings Supplemental (as of March 31, 2021 unless otherwise stated) *See page 20 for footnotes Tenant Credit Strength By Asset Type Category % of ABR Rent Coverage Ratio* Inpatient Rehab Facility (IRF) 18.7% 3.5x Surgical Hospital (SH) 7.2% 3.0x Long - Term Acute Care Hospital (LTAC) 2.6% 3.2x TOTAL/WEIGHTED AVERAGE 28.5% 3.3x Medical Office Building (MOB) 16.3% 6.6x MOB/Ambulatory Surgery Center (ASC) 17.0% 4.8x TOTAL/WEIGHTED AVERAGE 33.3% 5.7x All Tenants Calculated for Rent Coverage 61.8% 4.6x Large/Credit Tenants Not Calculated 29.6% N/A Other Tenants Not Available 8.6% N/A Top 10 Tenants % of Annualized Base Rent (1) 7.8% 7.0% 6.0% 4.1% 3.4% 3.3% 3.0% 2.9% 2.7% 2.6% 0.0% 1.0% 2.0% 3.0% 4.0% 5.0% 6.0% 7.0% 8.0% 9.0% Lease Expiration ($ in thousands) Rent Coverage 93.6% 6.4% National & Regional Healthcare Tenants (2) 93.6% Unaffiliated 6.4% Tenant Affiliations % of Annualized Base Rent (1) (1) Monthly base rent as of March 31, 2021 multiplied by 12 (2) National and Regional Healthcare Tenants include health systems, national operators, and regional physician groups
Top 10 Tenant Profiles 15 1Q - 2021| Earnings Supplemental Encompass Health (Ba 3 ) (NYSE : EHC), headquartered in Birmingham, AL is a national leader in integrated healthcare services offering both facility - based and home - based patient care through its network of inpatient rehabilitation hospitals, home health agencies and hospice agencies . With a national footprint that spans 136 hospitals and 328 home health & hospice locations in 39 states and Puerto Rico, Encompass Health is committed to delivering high - quality, cost - effective care across the healthcare continuum . Encompass Health is ranked as one of Fortune's 100 Best Companies to Work For, as well as Modern Healthcare's Best Places to Work . Kindred Healthcare, LLC is a healthcare services company based in Louisville, KY with annual revenues of approximately $ 3 . 1 billion . At June 30 , 2020 , Kindred through its subsidiaries had approximately 32 , 000 employees providing healthcare services in 1 , 731 locations in 46 states, including 64 long - term acute care hospitals, 22 inpatient rehabilitation hospitals, 10 sub - acute units, 94 inpatient rehabilitation units (hospital - based), contract rehabilitation service businesses which served 1 , 541 non - affiliated sites of service, and behavioral health services . Kindred is ranked as one of Fortune magazine’s Most Admired Healthcare Companies for nine years . Marietta Memorial Health System (MMH), (BB - ) is headquartered in Marietta, OH, and is the largest health system in the Parkersburg - Marietta - Vienna MSA . The largest employer in Washington County, MMH comprises (i) two hospitals, Marietta Memorial Hospital ( 205 - bed) and Selby General Hospital ( 35 - bed) critical access hospital ; (ii) the Belpre Campus ; (iii) ten clinic outpatient service sites ; and (iv) five imaging locations and has over 2 , 500 employees and 211 accredited physicians . In August 2020 , a critical access hospital, Sistersville General Hospital, joined Memorial Health System . Oklahoma Center for Orthopedic & Multi - Specialty Surgery, LLC (OCOM) is based Oklahoma City, OK and affiliated with USPI and INTEGRIS, and is a leading hospital for orthopedic specialists . OCOM operates a surgical hospital with six operating rooms, nine treatment rooms and a physical therapy department, an ancillary surgery center, and multiple imaging centers in throughout Oklahoma City . Trinity Health is one of the largest multi - institutional Catholic health care delivery systems in the nation, rated Aa 3 by Moody’s, serving diverse communities that include more than 30 million people across 22 states . Trinity Health includes 92 hospitals, as well as 106 continuing care locations that include PACE programs, senior living facilities, and home care and hospice services . Based in Livonia, Michigan, Trinity Health employs about 125 , 000 colleagues, including 7 , 500 employed physicians and clinicians . TeamHealth Holdings is one of the largest providers of physician outsourcing in the United States, with a network of affiliated physicians and advanced practice clinicians across more than 3 , 100 civilian and military hospitals, clinics and physician groups in 47 states . Blackstone acquired TeamHealth for $ 6 . 1 billion in 2017 . Spectrum Healthcare Resources is a division of TeamHealth dedicated to providing permanent, civilian - contracted medical professionals exclusively to U . S . military treatment facilities (MTFs), VA clinics and other Federal agencies through program development and healthcare services delivery . Carrus Hospital is located in Sherman, TX and provides acute rehabilitative care and long term acute care . Accredited with The Joint Commission’s Gold Seal of Approval, Carrus Hospital serves Sherman, Durant, Denison, Gainesville, Denton, McKinney, Plano, Bonham, Lewisville, Carrollton, Fort Worth, Dallas, Oklahoma City and beyond . Steward Health Care is the largest physician - owned, private, for - profit health care network in the U . S . – attending to 2 . 2 million people during more than 12 million physician and hospital visits annually . Headquartered in Dallas, Steward's integrated health care model employs 42 , 000 people at 35 hospitals and hundreds of urgent care, skilled nursing, and primary and specialty care medical practice locations across 11 states and the country of Malta, serving over 800 communities . Wake Forest Baptist Health (A 2 ) is a regional health system that includes five community hospitals and 300 + primary and specialty clinics serving residents of 24 counties in North Carolina and Virginia . In early October 2020 , Wake Forest Baptist Health, including Wake Forest School of Medicine, officially completed its combination with the Charlotte - based Atrium Health (Aa 3 ) . The new Atrium Health enterprise, an academic health system, services more than 7 million people at 42 hospitals and more than 1 , 500 care locations across the region with over 70 , 000 teammates and educates over 3 , 500 students in more than 100 specialized programs . The immediate direct and indirect annual economic and employment impact from the combined enterprise exceeds $ 32 billion and 180 , 000 jobs . Pipeline Health is a privately-held, community-based hospital ownership and management company based in Los Angeles . The principals of Pipeline Health have more than 250 years of collective experience in clinical medicine, finance, hospital operations and acquisitions . Pipeline’s growing business, through its affiliates, includes : Emergent Medical Associates, a leading provider of ER serving 20 + hospital sites and 900 , 000 patients annually ; Integrated Anesthesia Medical Group, with 100 providers performing 15 , 000 procedures annually ; Avanti Hospitals, a Los Angeles health system with four hospitals, 400 + beds and 55 , 000 ER visits annually ; Cloudbreak, a telemedicine company with 75 , 000 monthly encounters in 700 hospitals ; Pacific Healthworks, a physician practice management company ; and Benchmark Hospitalists ; four community hospitals in Chicago and Dallas .
Real Estate Portfolio 16 Property Location # of Bldgs Facility Type Net Leasable Square Feet Lease Years Remaining Annualized Rent (1) ($ in 000’s) Annualized Rent Per Square Foot (1) Tenant/Guarantor (2) Select Medical Hospital Omaha, NE 1 LTACH 41,113 2.4 $1,926 $46.85 Select Specialty Hospital – Omaha, Inc./Select Medical Corporation Orthopedic Surgery Center of Asheville Asheville, NC 1 ASC 8,840 1.0 $267 $30.25 Orthopedic Surgery Center of Asheville/Surgery Partners Associates in Ophthalmology West Mifflin, PA 1 MOB/ASC 27,193 9.6 $832 $30.58 Associates Surgery Centers, LLC, Associates in Ophthalmology, Ltd. Gastro One Memphis, TN 6 MOB/ASC 52,266 6.8 $1,393 $26.66 Gastroenterology Center of the MidSouth Legent Hospital for Special Surgery Plano, TX 1 Surgical Hospital 24,000 14.9 $1,411 $58.78 Star Medical Center/ Lumin Health Surgical Institute of Michigan Detroit, MI 1 MOB/ASC 15,018 5.1 $419 $27.93 Surgical Institute of Michigan/Surgical Management Professionals Marina Towers Melbourne, FL 1 MOB/Img 75,899 5.1 $0 $0.00 Marina Towers, LLC/First Choice Healthcare Solutions, Inc. Berks Physicians & Surgeons Wyomissing, PA 1 MOB 17,000 5.4 $477 $28.05 Berks Eye Physicians & Surgeons Berks Eye Surgery Center Wyomissing, PA 1 ASC 6,500 5.4 $255 $39.26 Berkshire Eye East Orange General Hospital East Orange, NJ 1 MOB 60,442 5.7 $1,131 $18.71 Prospect Medical Holdings, Inc. Brown Clinic Watertown, SD 3 MOB/Img 48,132 10.6 $765 $15.90 Brown Clinic Northern Ohio Medical Specialists Sandusky, OH 8 MOB 55,760 6.7 $930 $16.68 Northern Ohio Medical Specialists Carson Medical Group Clinic Carson City, NV 2 MOB 20,632 2.7 $387 $18.77 Carson Medical Group Piedmont Healthcare Ellijay, GA 3 MOB 44,162 5.3 $398 $9.01 Piedmont Mountainside Hospital, Inc. Encompass Altoona Altoona, PA 1 IRF 70,007 10.2 $1,693 $24.18 Encompass Encompass Mechanicsburg Mechanicsburg, PA 1 IRF 78,836 10.2 $1,901 $24.11 Encompass Encompass Mesa Mesa, AZ 1 IRF 51,903 3.7 $1,925 $37.09 Encompass Geisinger Specialty Care Lewisburg, PA 1 MOB/Img 28,480 2.2 $566 $19.87 Geisinger Health Southwest Florida Neurological & Rehab Cape Coral, FL 1 MOB 25,814 5.9 $573 $22.19 Southwest Florida Neurosurgical Associates Las Cruces MOB Las Cruces, NM 1 MOB 15,761 0.0 $0 $0.00 Vacant Thumb Butte Medical Center Prescott, AZ 1 MOB 12,000 6.0 $405 $33.77 Thumb Butte Medical Center/Physician Guaranty Southlake Heart & Vascular Institute Clermont, FL 1 MOB 18,152 1.7 $390 $21.51 Orlando Health, Southlake Hospital, Vascular Specialists of Central Florida Oklahoma Center for Orthopedic & Multi - Specialty Surgery Oklahoma City, OK 3 Surgical Hospital/ Physical Therapy/ASC 97,406 12.2 $3,717 $38.16 OCOM/INTEGRIS; USPI; physician guaranty Unity Family Medicine Brockport, NY 1 MOB 29,497 9.7 $670 $22.72 Unity Hospital of Rochester Lonestar Endoscopy Flower Mound, TX 1 ASC 10,062 5.6 $312 $31.02 Lonestar Endoscopy Center, LLC Carrus Specialty Hospital Sherman, TX 1 IRF/LTACH 69,352 16.3 $2,752 $39.68 SDB Partners, LLC 1Q - 2021| Earnings Supplemental (as of March 31, 2021, see page 20 for footnotes)
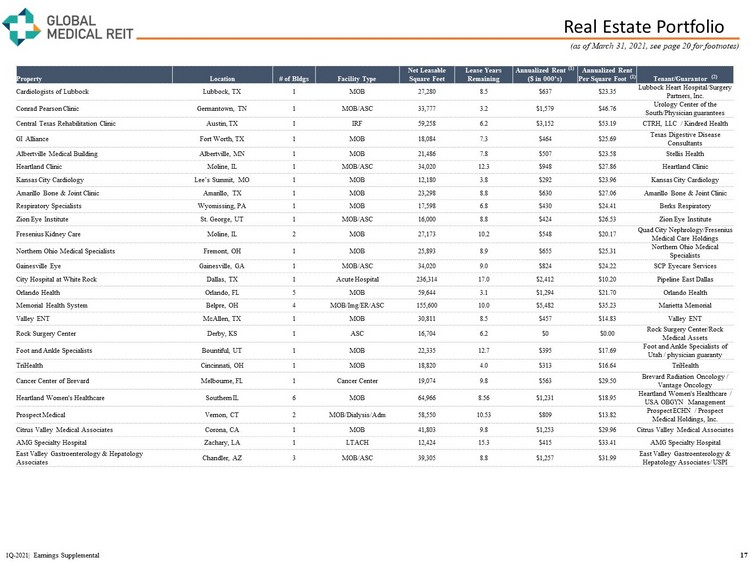
Real Estate Portfolio 17 Property Location # of Bldgs Facility Type Net Leasable Square Feet Lease Years Remaining Annualized Rent (1) ($ in 000’s) Annualized Rent Per Square Foot (1) Tenant/Guarantor (2) Cardiologists of Lubbock Lubbock, TX 1 MOB 27,280 8.5 $637 $23.35 Lubbock Heart Hospital/Surgery Partners, Inc. Conrad Pearson Clinic Germantown, TN 1 MOB/ASC 33,777 3.2 $1,579 $46.76 Urology Center of the South/Physician guarantees Central Texas Rehabilitation Clinic Austin, TX 1 IRF 59,258 6.2 $3,152 $53.19 CTRH, LLC / Kindred Health GI Alliance Fort Worth, TX 1 MOB 18,084 7.3 $464 $25.69 Texas Digestive Disease Consultants Albertville Medical Building Albertville, MN 1 MOB 21,486 7.8 $507 $23.58 Stellis Health Heartland Clinic Moline, IL 1 MOB/ASC 34,020 12.3 $948 $27.86 Heartland Clinic Kansas City Cardiology Lee’s Summit, MO 1 MOB 12,180 3.8 $292 $23.96 Kansas City Cardiology Amarillo Bone & Joint Clinic Amarillo, TX 1 MOB 23,298 8.8 $630 $27.06 Amarillo Bone & Joint Clinic Respiratory Specialists Wyomissing, PA 1 MOB 17,598 6.8 $430 $24.41 Berks Respiratory Zion Eye Institute St. George, UT 1 MOB/ASC 16,000 8.8 $424 $26.53 Zion Eye Institute Fresenius Kidney Care Moline, IL 2 MOB 27,173 10.2 $548 $20.17 Quad City Nephrology/Fresenius Medical Care Holdings Northern Ohio Medical Specialists Fremont, OH 1 MOB 25,893 8.9 $655 $25.31 Northern Ohio Medical Specialists Gainesville Eye Gainesville, GA 1 MOB/ASC 34,020 9.0 $824 $24.22 SCP Eyecare Services City Hospital at White Rock Dallas, TX 1 Acute Hospital 236,314 17.0 $2,412 $10.20 Pipeline East Dallas Orlando Health Orlando, FL 5 MOB 59,644 3.1 $1,294 $21.70 Orlando Health Memorial Health System Belpre, OH 4 MOB/Img/ER/ASC 155,600 10.0 $5,482 $35.23 Marietta Memorial Valley ENT McAllen, TX 1 MOB 30,811 8.5 $457 $14.83 Valley ENT Rock Surgery Center Derby, KS 1 ASC 16,704 6.2 $0 $0.00 Rock Surgery Center/Rock Medical Assets Foot and Ankle Specialists Bountiful, UT 1 MOB 22,335 12.7 $395 $17.69 Foot and Ankle Specialists of Utah / physician guaranty TriHealth Cincinnati, OH 1 MOB 18,820 4.0 $313 $16.64 TriHealth Cancer Center of Brevard Melbourne, FL 1 Cancer Center 19,074 9.8 $563 $29.50 Brevard Radiation Oncology / Vantage Oncology Heartland Women's Healthcare Southern IL 6 MOB 64,966 8.56 $1,231 $18.95 Heartland Women's Healthcare / USA OBGYN Management Prospect Medical Vernon, CT 2 MOB/Dialysis/ Adm 58,550 10.53 $809 $13.82 Prospect ECHN / Prospect Medical Holdings, Inc. Citrus Valley Medical Associates Corona, CA 1 MOB 41,803 9.8 $1,253 $29.96 Citrus Valley Medical Associates AMG Specialty Hospital Zachary, LA 1 LTACH 12,424 15.3 $415 $33.41 AMG Specialty Hospital East Valley Gastroenterology & Hepatology Associates Chandler, AZ 3 MOB/ASC 39,305 8.8 $1,257 $31.99 East Valley Gastroenterology & Hepatology Associates/ USPI 1Q - 2021| Earnings Supplemental (as of March 31, 2021, see page 20 for footnotes)
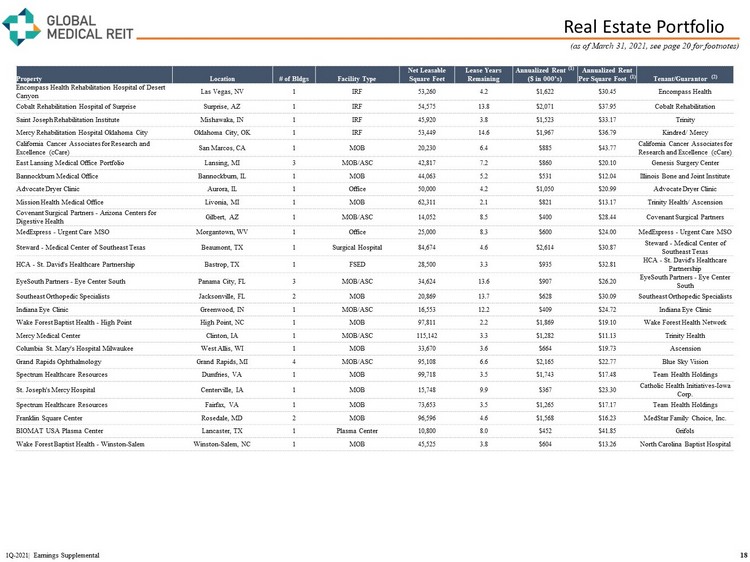
Real Estate Portfolio 18 Property Location # of Bldgs Facility Type Net Leasable Square Feet Lease Years Remaining Annualized Rent (1) ($ in 000’s) Annualized Rent Per Square Foot (1) Tenant/Guarantor (2) Encompass Health Rehabilitation Hospital of Desert Canyon Las Vegas, NV 1 IRF 53,260 4.2 $1,622 $30.45 Encompass Health Cobalt Rehabilitation Hospital of Surprise Surprise, AZ 1 IRF 54,575 13.8 $2,071 $37.95 Cobalt Rehabilitation Saint Joseph Rehabilitation Institute Mishawaka, IN 1 IRF 45,920 3.8 $1,523 $33.17 Trinity Mercy Rehabilitation Hospital Oklahoma City Oklahoma City, OK 1 IRF 53,449 14.6 $1,967 $36.79 Kindred/ Mercy California Cancer Associates for Research and Excellence ( cCare ) San Marcos, CA 1 MOB 20,230 6.4 $885 $43.77 California Cancer Associates for Research and Excellence ( cCare ) East Lansing Medical Office Portfolio Lansing, MI 3 MOB/ASC 42,817 7.2 $860 $20.10 Genesis Surgery Center Bannockburn Medical Office Bannockburn, IL 1 MOB 44,063 5.2 $531 $12.04 Illinois Bone and Joint Institute Advocate Dryer Clinic Aurora, IL 1 Office 50,000 4.2 $1,050 $20.99 Advocate Dryer Clinic Mission Health Medical Office Livonia, MI 1 MOB 62,311 2.1 $821 $13.17 Trinity Health/ Ascension Covenant Surgical Partners - Arizona Centers for Digestive Health Gilbert, AZ 1 MOB/ASC 14,052 8.5 $400 $28.44 Covenant Surgical Partners MedExpress - Urgent Care MSO Morgantown, WV 1 Office 25,000 8.3 $600 $24.00 MedExpress - Urgent Care MSO Steward - Medical Center of Southeast Texas Beaumont, TX 1 Surgical Hospital 84,674 4.6 $2,614 $30.87 Steward - Medical Center of Southeast Texas HCA - St. David's Healthcare Partnership Bastrop, TX 1 FSED 28,500 3.3 $935 $32.81 HCA - St. David's Healthcare Partnership EyeSouth Partners - Eye Center South Panama City, FL 3 MOB/ASC 34,624 13.6 $907 $26.20 EyeSouth Partners - Eye Center South Southeast Orthopedic Specialists Jacksonville, FL 2 MOB 20,869 13.7 $628 $30.09 Southeast Orthopedic Specialists Indiana Eye Clinic Greenwood, IN 1 MOB/ASC 16,553 12.2 $409 $24.72 Indiana Eye Clinic Wake Forest Baptist Health - High Point High Point, NC 1 MOB 97,811 2.2 $1,869 $19.10 Wake Forest Health Network Mercy Medical Center Clinton, IA 1 MOB/ASC 115,142 3.3 $1,282 $11.13 Trinity Health Columbia St. Mary's Hospital Milwaukee West Allis, WI 1 MOB 33,670 3.6 $664 $19.73 Ascension Grand Rapids Ophthalmology Grand Rapids, MI 4 MOB/ASC 95,108 6.6 $2,165 $22.77 Blue Sky Vision Spectrum Healthcare Resources Dumfries, VA 1 MOB 99,718 3.5 $1,743 $17.48 Team Health Holdings St. Joseph's Mercy Hospital Centerville, IA 1 MOB 15,748 9.9 $367 $23.30 Catholic Health Initiatives - Iowa Corp. Spectrum Healthcare Resources Fairfax, VA 1 MOB 73,653 3.5 $1,265 $17.17 Team Health Holdings Franklin Square Center Rosedale, MD 2 MOB 96,596 4.6 $1,568 $16.23 MedStar Family Choice, Inc. BIOMAT USA Plasma Center Lancaster, TX 1 Plasma Center 10,800 8.0 $452 $41.85 Grifols Wake Forest Baptist Health - Winston - Salem Winston - Salem, NC 1 MOB 45,525 3.8 $604 $13.26 North Carolina Baptist Hospital 1Q - 2021| Earnings Supplemental (as of March 31, 2021, see page 20 for footnotes)
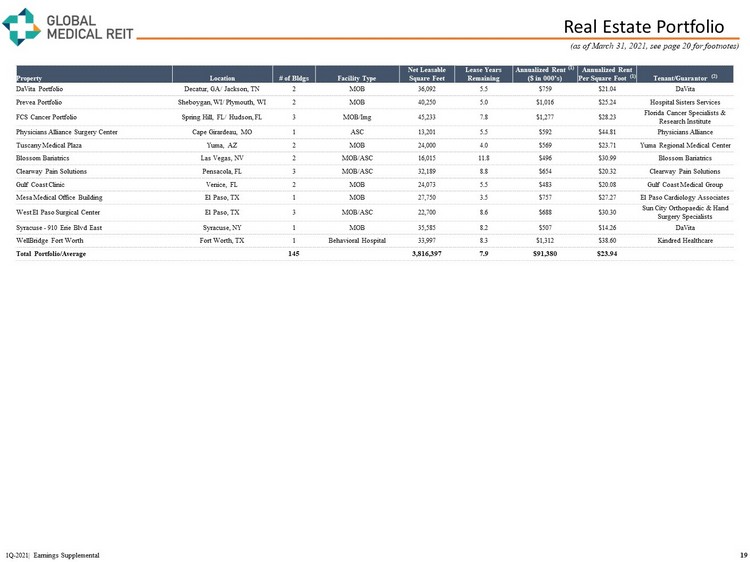
Real Estate Portfolio 19 Property Location # of Bldgs Facility Type Net Leasable Square Feet Lease Years Remaining Annualized Rent (1) ($ in 000’s) Annualized Rent Per Square Foot (1) Tenant/Guarantor (2) DaVita Portfolio Decatur, GA/ Jackson, TN 2 MOB 36,092 5.5 $759 $21.04 DaVita Prevea Portfolio Sheboygan, WI/ Plymouth, WI 2 MOB 40,250 5.0 $1,016 $25.24 Hospital Sisters Services FCS Cancer Portfolio Spring Hill, FL/ Hudson, FL 3 MOB/Img 45,233 7.8 $1,277 $28.23 Florida Cancer Specialists & Research Institute Physicians Alliance Surgery Center Cape Girardeau, MO 1 ASC 13,201 5.5 $592 $44.81 Physicians Alliance Tuscany Medical Plaza Yuma, AZ 2 MOB 24,000 4.0 $569 $23.71 Yuma Regional Medical Center Blossom Bariatrics Las Vegas, NV 2 MOB/ASC 16,015 11.8 $496 $30.99 Blossom Bariatrics Clearway Pain Solutions Pensacola, FL 3 MOB/ASC 32,189 8.8 $654 $20.32 Clearway Pain Solutions Gulf Coast Clinic Venice, FL 2 MOB 24,073 5.5 $483 $20.08 Gulf Coast Medical Group Mesa Medical Office Building El Paso, TX 1 MOB 27,750 3.5 $757 $27.27 El Paso Cardiology Associates West El Paso Surgical Center El Paso, TX 3 MOB/ASC 22,700 8.6 $688 $30.30 Sun City Orthopaedic & Hand Surgery Specialists Syracuse - 910 Erie Blvd East Syracuse, NY 1 MOB 35,585 8.2 $507 $14.26 DaVita WellBridge Fort Worth Fort Worth, TX 1 Behavioral Hospital 33,997 8.3 $1,312 $38.60 Kindred Healthcare Total Portfolio/Average 145 3,816,397 7.9 $91,380 $23.94 1Q - 2021| Earnings Supplemental (as of March 31, 2021, see page 20 for footnotes)
Disclosures Rent Coverage Ratio (see pages 12 and 14 ) For purposes of calculating our portfolio weighted - average EBITDARM coverage ratio (“Rent Coverage Ratio”), we excluded credit - rated tenants or their subsidiaries for which financial statements were either not available or not sufficiently detailed . These ratios are based on latest available information only . Most tenant financial statements are unaudited and we have not independently verified any tenant financial information (audited or unaudited) and, therefore, we cannot assure you that such information is accurate or complete . Certain other tenants (approximately 9 % of our portfolio) are excluded from the calculation due to (i) lack of available financial information or (ii) receipt of significant COVID - 19 relief funds that may cause reported coverage to differ materially from underlying performance . Additionally, our Rent Coverage Ratio adds back physician distributions and compensation . Management believes all adjustments are reasonable and necessary . Real Estate Portfolio (see pages 16 , 17 , 18 and 19 ) Data as of March 31, 2021. (1) Monthly base rent at March 31, 2021 multiplied by 12 (or actual NOI where more reflective of property performance). In addition, Marina Towers and Rock Surgery C ent er are presented on a cash - collected basis. Accordingly, this methodology produces an annualized amount as of a point in time but does not take into account future contr act ual rental rate increases . (2) Certain lease guarantees are for less than 100% of the contractual rental payments. Additional Information The information in this document should be read in conjunction with the Company’s Annual Report on Form 10 - K, Quarterly Reports on Form 10 - Q, Current Reports on Form 8 - K, and other information filed with, or furnished to, the SEC . You can access the Company’s reports and amendments to those reports filed or furnished to the SEC pursuant to Section 13 (a) or 15 (d) of the Exchange Act in the “Investor Relations” section on the Company’s website (www . globalmedicalreit . com) under “SEC Filings” as soon as reasonably practicable after they are filed with, or furnished to, the SEC . The information on or connected to the Company’s website is not, and shall not be deemed to be, a part of, or incorporated into, this Earnings Supplemental . You also can review these SEC filings and other information by accessing the SEC’s website at http : //www . sec . gov . Certain information contained in this package, including, but not limited to, information contained in our Top 10 tenant profiles is derived from publicly - available third - party sources . The Company has not independently verified this information and there can be no assurance that such information is accurate or complete . 20 (as of March 31, 2021) 1Q - 2021| Earnings Supplemental
Evelyn Infurna Evelyn.Infurna@icrinc.com 203.682.8265 www.globalmedicalreit.com NYSE: GMRE INVESTOR RELATIONS