Exhibit 99.2
Third Quarter 2021 Earnings Supplemental Three and Nine Months Ended September 30, 2021 www.globalmedicalreit.com NYSE: GMRE
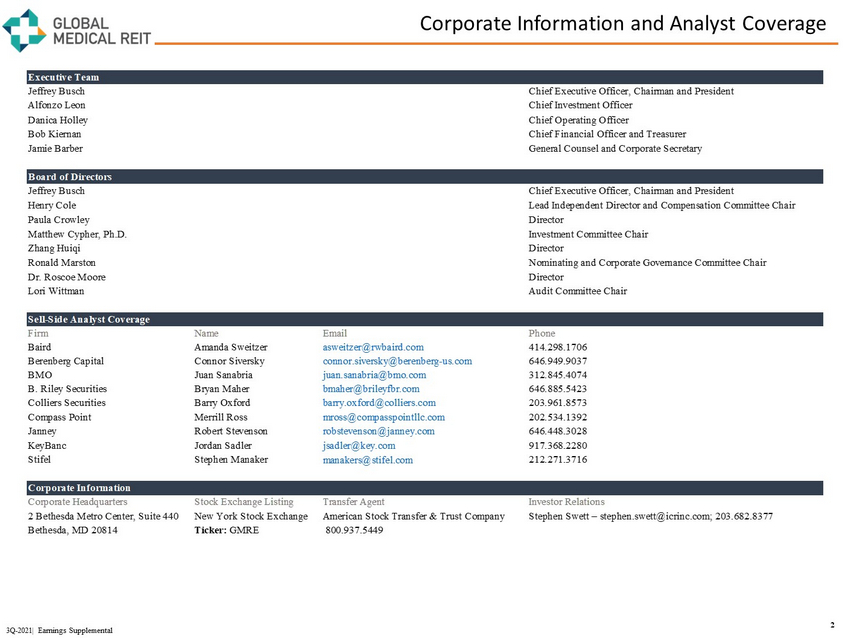
Corporate Information and Analyst Coverage 2 3Q - 2021| Earnings Supplemental Executive Team Jeffrey Busch Chief Executive Officer, Chairman and President Alfonzo Leon Chief Investment Officer Danica Holley Chief Operating Officer Bob Kiernan Chief Financial Officer and Treasurer Jamie Barber General Counsel and Corporate Secretary Board of Directors Jeffrey Busch Chief Executive Officer, Chairman and President Henry Cole Lead Independent Director and Compensation Committee Chair Paula Crowley Director Matthew Cypher, Ph.D. Investment Committee Chair Zhang Huiqi Director Ronald Marston Nominating and Corporate Governance Committee Chair Dr. Roscoe Moore Director Lori Wittman Audit Committee Chair Sell-Side Analyst Coverage Firm Name Email Phone Baird Amanda Sweitzer asweitzer@rwbaird.com 414.298.1706 Berenberg Capital Connor Siversky connor.siversky@berenberg-us.com 646.949.9037 BMO Juan Sanabria juan.sanabria@bmo.com 312.845.4074 B. Riley Securities Bryan Maher bmaher@brileyfbr.com 646.885.5423 Colliers Securities Barry Oxford barry.oxford@colliers.com 203.961.8573 Compass Point Merrill Ross mross@compasspointllc.com 202.534.1392 Janney Robert Stevenson robstevenson@janney.com 646.448.3028 KeyBanc Jordan Sadler jsadler@key.com 917.368.2280 Stifel Stephen Manaker manakers@stifel.com 212.271.3716 Corporate Information Corporate Headquarters Stock Exchange Listing Transfer Agent Investor Relations 2 Bethesda Metro Center, Suite 440 New York Stock Exchange American Stock Transfer & Trust Company Stephen Swett – stephen.swett@icrinc.com; 203.682.8377 Bethesda, MD 20814 Ticker: GMRE 800.937.5449
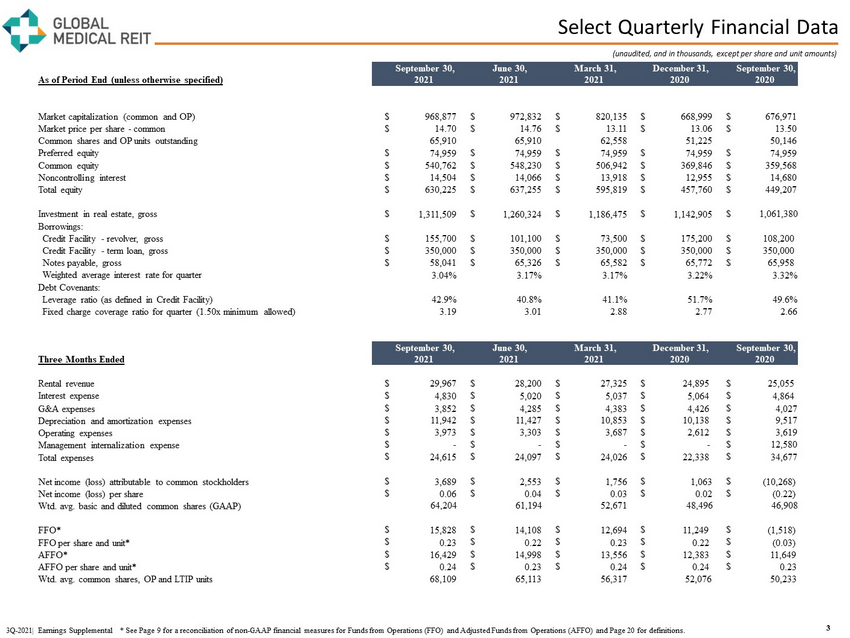
Select Quarterly Financial Data (unaudited, and in thousands, except per share and unit amounts) 3 3Q - 2021| Earnings Supplemental * See Page 9 for a reconciliation of non - GAAP financial measures for Funds from Operations (FFO ) and Adjusted Funds from Operations (AFFO) and Page 20 for definitions. September 30, June 30, March 31, December 31, September 30, As of Period End (unless otherwise specified) 2021 2021 2021 2020 2020 Market capitalization (common and OP) $ 968,877 $ 972,832 $ 820,135 $ 668,999 $ 676,971 Market price per share - common $ 14.70 $ 14.76 $ 13.11 $ 13.06 $ 13.50 Common shares and OP units outstanding 65,910 65,910 62,558 51,225 50,146 Preferred equity $ 74,959 $ 74,959 $ 74,959 $ 74,959 $ 74,959 Common equity $ 540,762 $ 548,230 $ 506,942 $ 369,846 $ 359,568 Noncontrolling interest $ 14,504 $ 14,066 $ 13,918 $ 12,955 $ 14,680 Total equity $ 630,225 $ 637,255 $ 595,819 $ 457,760 $ 449,207 Investment in real estate, gross $ 1,311,509 $ 1,260,324 $ 1,186,475 $ 1,142,905 $ 1,061,380 Borrowings: Credit Facility - revolver, gross $ 155,700 $ 101,100 $ 73,500 $ 175,200 $ 108,200 Credit Facility - term loan, gross $ 350,000 $ 350,000 $ 350,000 $ 350,000 $ 350,000 Notes payable, gross $ 58,041 $ 65,326 $ 65,582 $ 65,772 $ 65,958 Weighted average interest rate for quarter 3.04% 3.17% 3.17% 3.22% 3.32% Debt Covenants: Leverage ratio (as defined in Credit Facility) 42.9% 40.8% 41.1% 51.7% 49.6% Fixed charge coverage ratio for quarter (1.50x minimum allowed) 3.19 3.01 2.88 2.77 2.66 September 30, June 30, March 31, December 31, September 30, Three Months Ended 2021 2021 2021 2020 2020 Rental revenue $ 29,967 $ 28,200 $ 27,325 $ 24,895 $ 25,055 Interest expense $ 4,830 $ 5,020 $ 5,037 $ 5,064 $ 4,864 G&A expenses $ 3,852 $ 4,285 $ 4,383 $ 4,426 $ 4,027 Depreciation and amortization expenses $ 11,942 $ 11,427 $ 10,853 $ 10,138 $ 9,517 Operating expenses $ 3,973 $ 3,303 $ 3,687 $ 2,612 $ 3,619 Management internalization expense $ - $ - $ - $ - $ 12,580 Total expenses $ 24,615 $ 24,097 $ 24,026 $ 22,338 $ 34,677 Net income (loss) attributable to common stockholders $ 3,689 $ 2,553 $ 1,756 $ 1,063 $ (10,268) Net income (loss) per share $ 0.06 $ 0.04 $ 0.03 $ 0.02 $ (0.22) Wtd. avg. basic and diluted common shares (GAAP) 64,204 61,194 52,671 48,496 46,908 FFO* $ 15,828 $ 14,108 $ 12,694 $ 11,249 $ (1,518) FFO per share and unit* $ 0.23 $ 0.22 $ 0.23 $ 0.22 $ (0.03) AFFO* $ 16,429 $ 14,998 $ 13,556 $ 12,383 $ 11,649 AFFO per share and unit* $ 0.24 $ 0.23 $ 0.24 $ 0.24 $ 0.23 Wtd. avg. common shares, OP and LTIP units 68,109 65,113 56,317 52,076 50,233
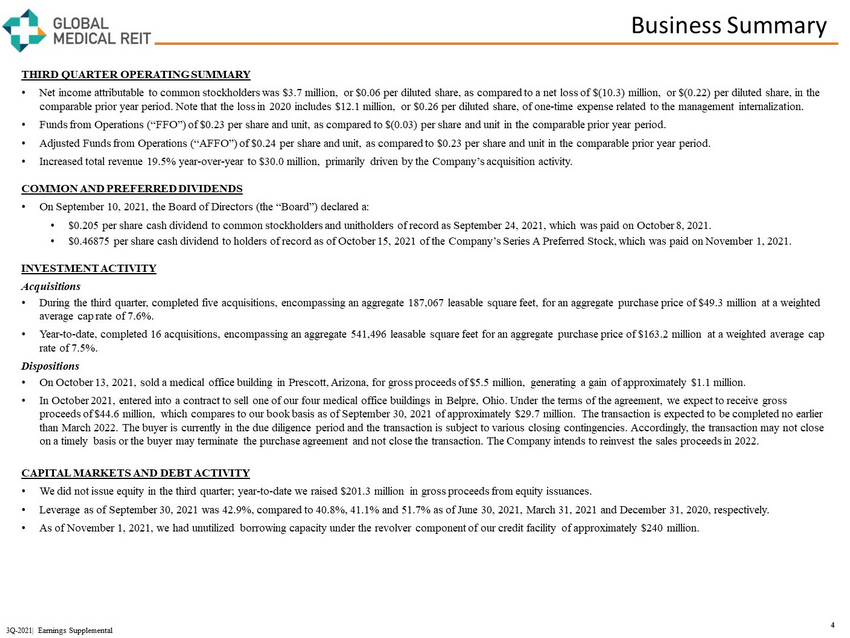
Business Summary 4 3Q - 2021| Earnings Supplemental THIRD QUARTER OPERATING SUMMARY • Net income attributable to common stockholders was $3.7 million, or $0.06 per diluted share, as compared to a net loss of $(1 0.3 ) million, or $(0.22) per diluted share, in the comparable prior year period. Note that the loss in 2020 includes $12.1 million, or $0.26 per diluted share, of one - time expense related to the management internalization. • Funds from Operations (“FFO”) of $0.23 per share and unit, as compared to $(0.03) per share and unit in the comparable prior yea r period. • Adjusted Funds from Operations (“AFFO”) of $0.24 per share and unit, as compared to $0.23 per share and unit in the comparabl e p rior year period. • Increased total revenue 19.5% year - over - year to $30.0 million, primarily driven by the Company’s acquisition activity. COMMON AND PREFERRED DIVIDENDS • On September 10, 2021, the Board of Directors (the “Board”) declared a: • $0.205 per share cash dividend to common stockholders and unitholders of record as September 24, 2021, which was paid on Octo ber 8, 2021. • $0.46875 per share cash dividend to holders of record as of October 15, 2021 of the Company’s Series A Preferred Stock, which wa s paid on November 1, 2021. INVESTMENT ACTIVITY Acquisitions • During the third quarter, completed five acquisitions, encompassing an aggregate 187,067 leasable square feet, for an aggrega te purchase price of $49.3 million at a weighted average cap rate of 7.6%. • Year - to - date, completed 16 acquisitions, encompassing an aggregate 541,496 leasable square feet for an aggregate purchase price of $163.2 million at a weighted average cap rate of 7.5%. Dispositions • On October 13, 2021, sold a medical office building in Prescott, Arizona, for gross proceeds of $5.5 million, generating a ga in of approximately $1.1 million. • In October 2021, entered into a contract to sell one of our four medical office buildings in Belpre, Ohio. Under the terms of th e agreement, we expect to receive gross proceeds of $44.6 million, which compares to our book basis as of September 30, 2021 of approximately $29.7 million. The tran sac tion is expected to be completed no earlier than March 2022. The buyer is currently in the due diligence period and the transaction is subject to various closing conting enc ies. Accordingly, the transaction may not close on a timely basis or the buyer may terminate the purchase agreement and not close the transaction. The Company intends to rei nve st the sales proceeds in 2022. CAPITAL MARKETS AND DEBT ACTIVITY • We did not issue equity in the third quarter; year - to - date we raised $201.3 million in gross proceeds from equity issuances. • Leverage as of September 30, 2021 was 42.9%, compared to 40.8%, 41.1% and 51.7% as of June 30, 2021, March 31, 2021 and Decem ber 31, 2020, respectively. • As of November 1, 2021, we had unutilized borrowing capacity under the revolver component of our credit facility of approxima tel y $240 million.
ESG Overview 5 3Q - 2021| Earnings Supplemental CORPORATE SUSTAINABILITY AND SOCIAL RESPONSIBILITY • Our business values integrate environmental sustainability, social responsibility and strong governance practices throughout our organization. • We continue to improve and expand our efforts in the corporate sustainability arena through tenant outreach and data collecti on to benchmark our portfolio’s energy consumption and efficiency. On July 1, 2021, we submitted our second GRESB assessment, and we are working with third - party experts to suppor t our energy monitoring efforts. We have also begun to explore potential projects with solar energy providers and on - property electric vehicle charging solutions. • Our commitment to employee engagement remains a high - priority, as we continue to make accommodations for health, safety, and wor k - life balance. With this commitment in mind, and in response to the Company’s growth, we have modestly grown our team during 2021. • During the first quarter of 2021, our employee ESG working group engaged Georgetown University’s Steers Center for Global Rea l E state to help us identify social responsibility initiatives. Their recommendation led to a pilot project that provides transportation to healthcare facilities fo r those in need. We are working with a ride - share provider and national charitable organization to implement the project in the greater Phoenix, Arizona metro area. • Our Board continues to lead our social and governance efforts. With its diverse composition, our Board is a strong example of in clusive leadership. In 2021, the Board continued to improve our corporate governance structure by adopting an anti - hedging and anti - pledging policy and executive equity ownershi p guidelines. The Board has also formed an ESG working group and has worked with management to identify an environmental, social, governance and resilience framework th at can guide our ESG work going forward. CLIMATE CHANGE • We take climate change and the risks associated with climate change seriously. We are committed to aligning our investment st rat egy with science and have begun to monitor our portfolio for climate risk factors. • We will use this climate risk factor data to evaluate our insurance needs and risk management approach. In addition, the ener gy consumption data that we are collecting will be used to assess facilities’ carbon emission levels. Capturing and tracking this information will help inform future mitigation an d remediation efforts where possible. • We are exploring ways to mitigate climate risk, should it be present, in our acquisition strategy, as well as ways to contrib ute to the reduction of climate impact through proactive asset management that looks for ways to incorporate renewable energy resources and energy utilization reduction. • We stand with our communities, tenants, and stockholders in supporting meaningful solutions that address this global challeng e a nd contribute to the sustainability of our business objectives.
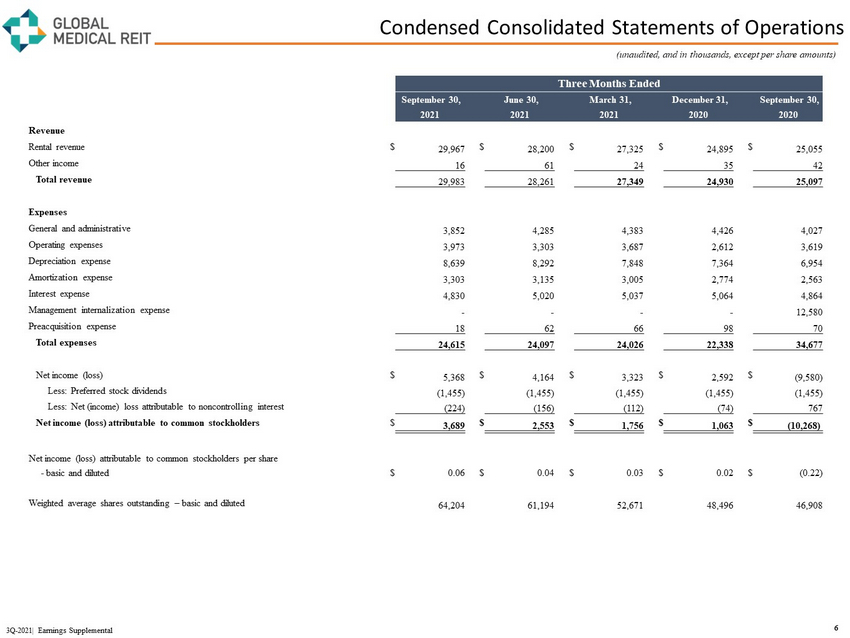
Condensed Consolidated Statements of Operations 6 3Q - 2021| Earnings Supplemental (unaudited, and in thousands, except per share amounts) Three Months Ended September 30, June 30, March 31, December 31, September 30, 2021 2021 2021 2020 2020 Revenue Rental revenue $ 29,967 $ 28,200 $ 27,325 $ 24,895 $ 25,055 Other income 16 61 24 35 42 Total revenue 29,983 28,261 27,349 24,930 25,097 Expenses General and administrative 3,852 4,285 4,383 4,426 4,027 Operating expenses 3,973 3,303 3,687 2,612 3,619 Depreciation expense 8,639 8,292 7,848 7,364 6,954 Amortization expense 3,303 3,135 3,005 2,774 2,563 Interest expense 4,830 5,020 5,037 5,064 4,864 Management internalization expense - - - - 12,580 Preacquisition expense 18 62 66 98 70 Total expenses 24,615 24,097 24,026 22,338 34,677 Net income (loss) $ 5,368 $ 4,164 $ 3,323 $ 2,592 $ (9,580) Less: Preferred stock dividends (1,455) (1,455) (1,455) (1,455) (1,455) Less: Net (income) loss attributable to noncontrolling interest (224) (156) (112) (74) 767 Net income (loss) attributable to common stockholders $ 3,689 $ 2,553 $ 1,756 $ 1,063 $ (10,268) Net income (loss) attributable to common stockholders per share - basic and diluted $ 0.06 $ 0.04 $ 0.03 $ 0.02 $ (0.22) Weighted average shares outstanding – basic and diluted 64,204 61,194 52,671 48,496 46,908
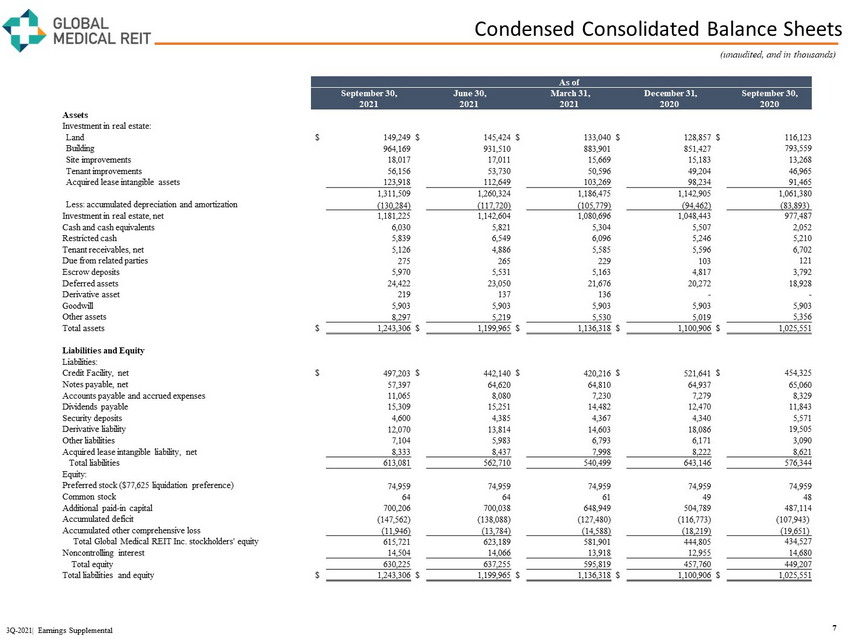
Condensed Consolidated Balance Sheets 7 3Q - 2021| Earnings Supplemental (unaudited, and in thousands) As of September 30, June 30, March 31, December 31, September 30, 2021 2021 2021 2020 2020 Assets Investment in real estate: Land $ 149,249 $ 145,424 $ 133,040 $ 128,857 $ 116,123 Building 964,169 931,510 883,901 851,427 793,559 Site improvements 18,017 17,011 15,669 15,183 13,268 Tenant improvements 56,156 53,730 50,596 49,204 46,965 Acquired lease intangible assets 123,918 112,649 103,269 98,234 91,465 1,311,509 1,260,324 1,186,475 1,142,905 1,061,380 Less: accumulated depreciation and amortization (130,284) (117,720) (105,779) (94,462) (83,893) Investment in real estate, net 1,181,225 1,142,604 1,080,696 1,048,443 977,487 Cash and cash equivalents 6,030 5,821 5,304 5,507 2,052 Restricted cash 5,839 6,549 6,096 5,246 5,210 Tenant receivables, net 5,126 4,886 5,585 5,596 6,702 Due from related parties 275 265 229 103 121 Escrow deposits 5,970 5,531 5,163 4,817 3,792 Deferred assets 24,422 23,050 21,676 20,272 18,928 Derivative asset 219 137 136 - - Goodwill 5,903 5,903 5,903 5,903 5,903 Other assets 8,297 5,219 5,530 5,019 5,356 Total assets $ 1,243,306 $ 1,199,965 $ 1,136,318 $ 1,100,906 $ 1,025,551 Liabilities and Equity Liabilities: Credit Facility, net $ 497,203 $ 442,140 $ 420,216 $ 521,641 $ 454,325 Notes payable, net 57,397 64,620 64,810 64,937 65,060 Accounts payable and accrued expenses 11,065 8,080 7,230 7,279 8,329 Dividends payable 15,309 15,251 14,482 12,470 11,843 Security deposits 4,600 4,385 4,367 4,340 5,571 Derivative liability 12,070 13,814 14,603 18,086 19,505 Other liabilities 7,104 5,983 6,793 6,171 3,090 Acquired lease intangible liability, net 8,333 8,437 7,998 8,222 8,621 Total liabilities 613,081 562,710 540,499 643,146 576,344 Equity: Preferred stock ($77,625 liquidation preference) 74,959 74,959 74,959 74,959 74,959 Common stock 64 64 61 49 48 Additional paid - in capital 700,206 700,038 648,949 504,789 487,114 Accumulated deficit (147,562) (138,088) (127,480) (116,773) (107,943) Accumulated other comprehensive loss (11,946) (13,784) (14,588) (18,219) (19,651) Total Global Medical REIT Inc. stockholders' equity 615,721 623,189 581,901 444,805 434,527 Noncontrolling interest 14,504 14,066 13,918 12,955 14,680 Total equity 630,225 637,255 595,819 457,760 449,207 Total liabilities and equity $ 1,243,306 $ 1,199,965 $ 1,136,318 $ 1,100,906 $ 1,025,551
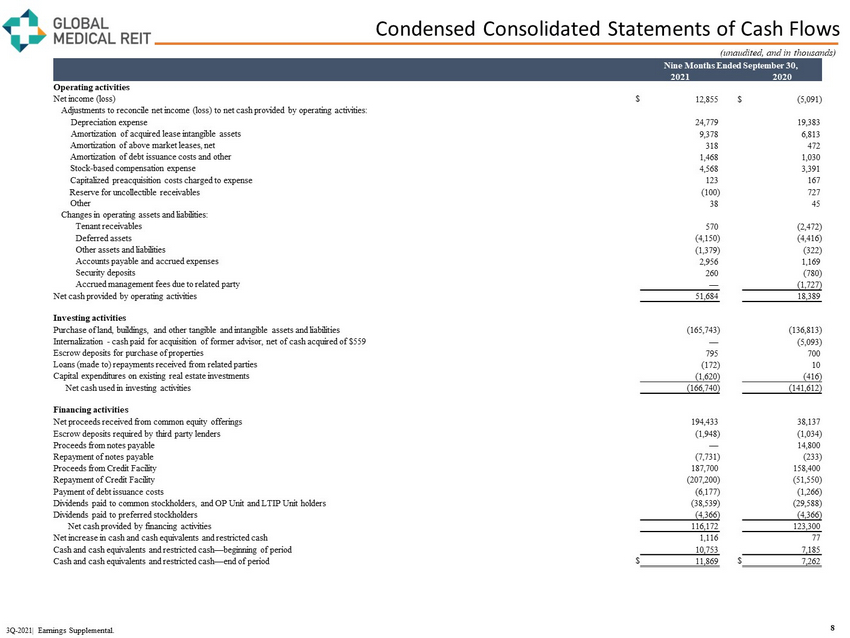
Condensed Consolidated Statements of Cash Flows 8 (unaudited, and in thousands) Nine Months Ended September 30, 2021 2020 Operating activities Net income (loss) $ 12,855 $ (5,091) Adjustments to reconcile net income (loss) to net cash provided by operating activities: Depreciation expense 24,779 19,383 Amortization of acquired lease intangible assets 9,378 6,813 Amortization of above market leases, net 318 472 Amortization of debt issuance costs and other 1,468 1,030 Stock - based compensation expense 4,568 3,391 Capitalized preacquisition costs charged to expense 123 167 Reserve for uncollectible receivables (100) 727 Other 38 45 Changes in operating assets and liabilities: Tenant receivables 570 (2,472) Deferred assets (4,150) (4,416) Other assets and liabilities (1,379) (322) Accounts payable and accrued expenses 2,956 1,169 Security deposits 260 (780) Accrued management fees due to related party — (1,727) Net cash provided by operating activities 51,684 18,389 Investing activities Purchase of land, buildings, and other tangible and intangible assets and liabilities (165,743) (136,813) Internalization - cash paid for acquisition of former advisor, net of cash acquired of $559 — (5,093) Escrow deposits for purchase of properties 795 700 Loans (made to) repayments received from related parties (172) 10 Capital expenditures on existing real estate investments (1,620) (416) Net cash used in investing activities (166,740) (141,612) Financing activities Net proceeds received from common equity offerings 194,433 38,137 Escrow deposits required by third party lenders (1,948) (1,034) Proceeds from notes payable — 14,800 Repayment of notes payable (7,731) (233) Proceeds from Credit Facility 187,700 158,400 Repayment of Credit Facility (207,200) (51,550) Payment of debt issuance costs (6,177) (1,266) Dividends paid to common stockholders, and OP Unit and LTIP Unit holders (38,539) (29,588) Dividends paid to preferred stockholders (4,366) (4,366) Net cash provided by financing activities 116,172 123,300 Net increase in cash and cash equivalents and restricted cash 1,116 77 Cash and cash equivalents and restricted cash — beginning of period 10,753 7,185 Cash and cash equivalents and restricted cash — end of period $ 11,869 $ 7,262 3Q - 2021| Earnings Supplemental.
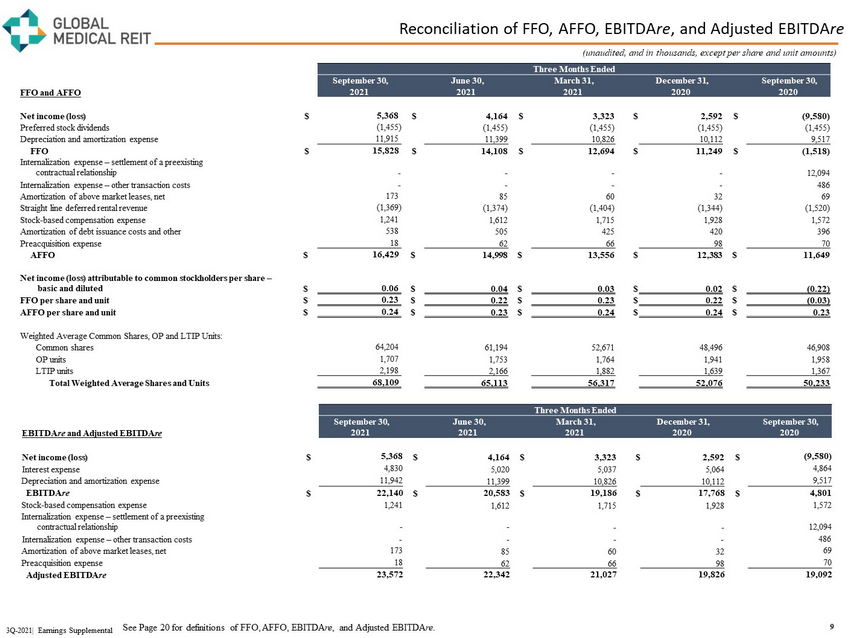
Reconciliation of FFO, AFFO, EBITDA re , and Adjusted EBITDA re 9 3Q - 2021| Earnings Supplemental (unaudited, and in thousands, except per share and unit amounts) Three Months Ended September 30, June 30, March 31, December 31, September 30, FFO and AFFO 2021 2021 2021 2020 2020 Net income (loss) $ 5,368 $ 4,164 $ 3,323 $ 2,592 $ (9,580) Preferred stock dividends (1,455) (1,455) (1,455) (1,455) (1,455) Depreciation and amortization expense 11,915 11,399 10,826 10,112 9,517 FFO $ 15,828 $ 14,108 $ 12,694 $ 11,249 $ (1,518) Internalization expense – settlement of a preexisting contractual relationship - - - - 12,094 Internalization expense – other transaction costs - - - - 486 Amortization of above market leases, net 173 85 60 32 69 Straight line deferred rental revenue (1,369) (1,374) (1,404) (1,344) (1,520) Stock - based compensation expense 1,241 1,612 1,715 1,928 1,572 Amortization of debt issuance costs and other 538 505 425 420 396 Preacquisition expense 18 62 66 98 70 AFFO $ 16,429 $ 14,998 $ 13,556 $ 12,383 $ 11,649 Net income (loss) attributable to common stockholders per share – basic and diluted $ 0.06 $ 0.04 $ 0.03 $ 0.02 $ (0.22) FFO per share and unit $ 0.23 $ 0.22 $ 0.23 $ 0.22 $ (0.03) AFFO per share and unit $ 0.24 $ 0.23 $ 0.24 $ 0.24 $ 0.23 Weighted Average Common Shares, OP and LTIP Units: Common shares 64,204 61,194 52,671 48,496 46,908 OP units 1,707 1,753 1,764 1,941 1,958 LTIP units 2,198 2,166 1,882 1,639 1,367 Total Weighted Average Shares and Units 68,109 65,113 56,317 52,076 50,233 Three Months Ended September 30, June 30, March 31, December 31, September 30, EBITDA re and Adjusted EBITDA re 2021 2021 2021 2020 2020 Net income (loss) $ 5,368 $ 4,164 $ 3,323 $ 2,592 $ (9,580) Interest expense 4,830 5,020 5,037 5,064 4,864 Depreciation and amortization expense 11,942 11,399 10,826 10,112 9,517 EBITDA re $ 22,140 $ 20,583 $ 19,186 $ 17,768 $ 4,801 Stock - based compensation expense 1,241 1,612 1,715 1,928 1,572 Internalization expense – settlement of a preexisting contractual relationship - - - - 12,094 Internalization expense – other transaction costs - - - - 486 Amortization of above market leases, net 173 85 60 32 69 Preacquisition expense 18 62 66 98 70 Adjusted EBITDA re 23,572 22,342 21,027 19,826 19,092 See Page 20 for definitions of FFO, AFFO, EBITDA re , and Adjusted EBITDA re .
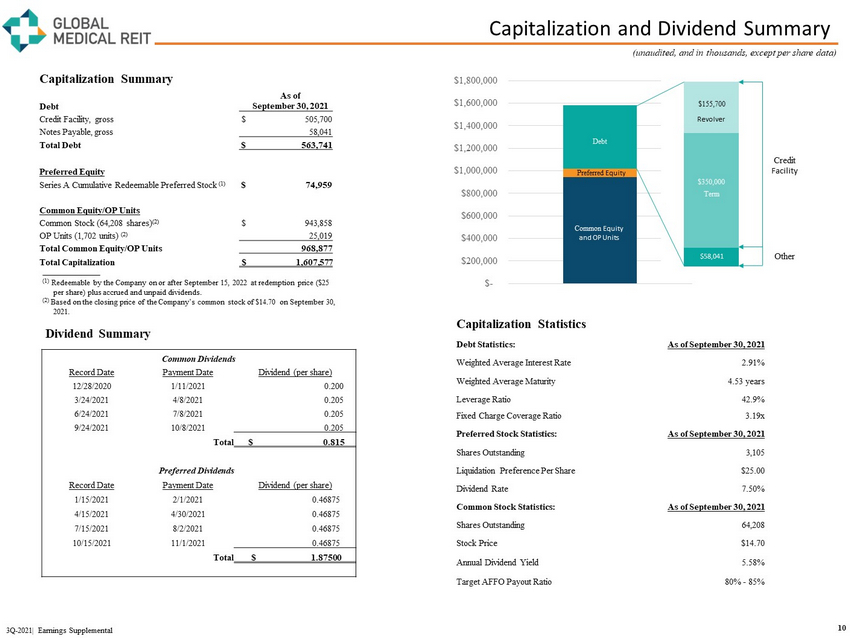
Capitalization and Dividend Summary 10 3Q - 2021| Earnings Supplemental (unaudited, and in thousands, except per share data) (1) Redeemable by the Company on or after September 15, 2022 at redemption price ($25 per share) plus accrued and unpaid dividends. (2) Based on the closing price of the Company’s common stock of $14.70 on September 30, 2021. $- $200,000 $400,000 $600,000 $800,000 $1,000,000 $1,200,000 $1,400,000 $1,600,000 $1,800,000 Debt Preferred Equity Common Equity and OP Units $58,041 $350,000 $155,700 Revolver Term Credit Facility Other Capitalization Summary Debt As of September 30, 2021 Credit Facility, gross $ 505,700 Notes Payable, gross 58,041 Total Debt $ 563,741 Preferred Equity Series A Cumulative Redeemable Preferred Stock (1) $ 74,959 Common Equity/OP Units Common Stock (64,208 shares) (2) $ 943,858 OP Units (1,702 units) (2) 25,019 Total Common Equity/OP Units 968,877 Total Capitalization $ 1,607,577 Capitalization Statistics Debt Statistics: As of September 30, 2021 Weighted Average Interest Rate 2.91% Weighted Average Maturity 4.53 years Leverage Ratio 42.9% Fixed Charge Coverage Ratio 3.19x Preferred Stock Statistics: As of September 30, 2021 Shares Outstanding 3,105 Liquidation Preference Per Share $25.00 Dividend Rate 7.50% Common Stock Statistics: As of September 30, 2021 Shares Outstanding 64,208 Stock Price $14.70 Annual Dividend Yield 5.58% Target AFFO Payout Ratio 80% - 85% Dividend Summary Common Dividends Record Date Payment Date Dividend (per share) 12/28/2020 1/11/2021 0.200 3/24/2021 4/8/2021 0.205 6/24/2021 7/8/2021 0.205 9/24/2021 10/8/2021 0.205 Total $ 0.815 Preferred Dividends Record Date Payment Date Dividend (per share) 1/15/2021 2/1/2021 0.46875 4/15/2021 4/30/2021 0.46875 7/15/2021 8/2/2021 0.46875 10/15/2021 11/1/2021 0.46875 Total $ 1.87500
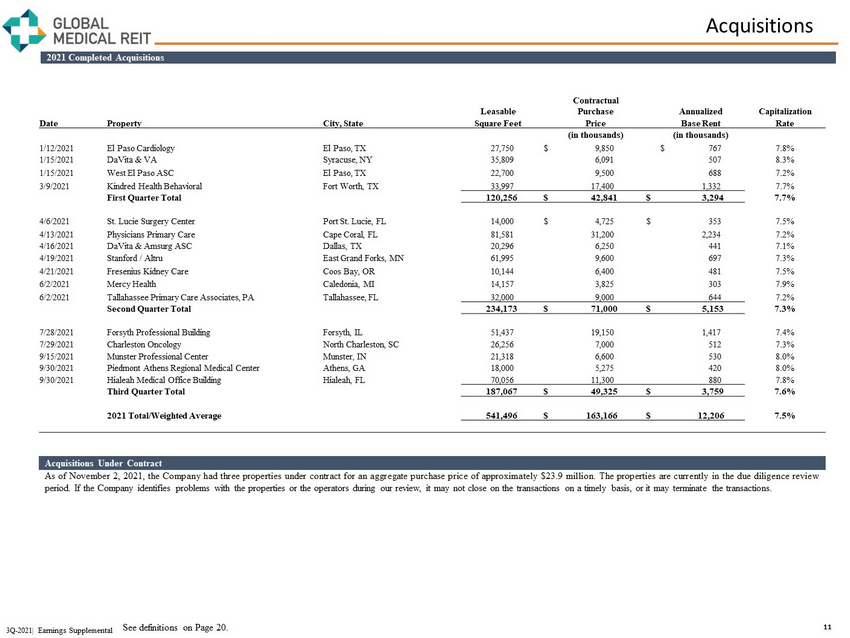
Acquisitions 11 2021 Completed Acquisitions Acquisitions Under Contract As of November 2 , 2021 , the Company had three properties under contract for an aggregate purchase price of approximately $ 23 . 9 million . The properties are currently in the due diligence review period . If the Company identifies problems with the properties or the operators during our review, it may not close on the transactions on a timely basis, or it may terminate the transactions . 3Q - 2021| Earnings Supplemental Contractual Leasable Purchase Annualized Capitalization Date Property City, State Square Feet Price Base Rent Rate (in thousands) (in thousands) 1/12/2021 El Paso Cardiology El Paso, TX 27,750 $ 9,850 $ 767 7.8% 1/15/2021 DaVita & VA Syracuse, NY 35,809 6,091 507 8.3% 1/15/2021 West El Paso ASC El Paso, TX 22,700 9,500 688 7.2% 3/9/2021 Kindred Health Behavioral Fort Worth, TX 33,997 17,400 1,332 7.7% First Quarter Total 120,256 $ 42,841 $ 3,294 7.7% 4/6/2021 St. Lucie Surgery Center Port St. Lucie, FL 14,000 $ 4,725 $ 353 7.5% 4/13/2021 Physicians Primary Care Cape Coral, FL 81,581 31,200 2,234 7.2% 4/16/2021 DaVita & Amsurg ASC Dallas, TX 20,296 6,250 441 7.1% 4/19/2021 Stanford / Altru East Grand Forks, MN 61,995 9,600 697 7.3% 4/21/2021 Fresenius Kidney Care Coos Bay, OR 10,144 6,400 481 7.5% 6/2/2021 Mercy Health Caledonia, MI 14,157 3,825 303 7.9% 6/2/2021 Tallahassee Primary Care Associates, PA Tallahassee, FL 32,000 9,000 644 7.2% Second Quarter Total 234,173 $ 71,000 $ 5,153 7.3% 7/28/2021 Forsyth Professional Building Forsyth, IL 51,437 19,150 1,417 7.4% 7/29/2021 Charleston Oncology North Charleston, SC 26,256 7,000 512 7.3% 9/15/2021 Munster Professional Center Munster, IN 21,318 6,600 530 8.0% 9/30/2021 Piedmont Athens Regional Medical Center Athens, GA 18,000 5,275 420 8.0% 9/30/2021 Hialeah Medical Office Building Hialeah, FL 70,056 11,300 880 7.8% Third Quarter Total 187,067 $ 49,325 $ 3,759 7.6% 2021 Total/Weighted Average 541,496 $ 163,166 $ 12,206 7.5% See definitions on Page 20.
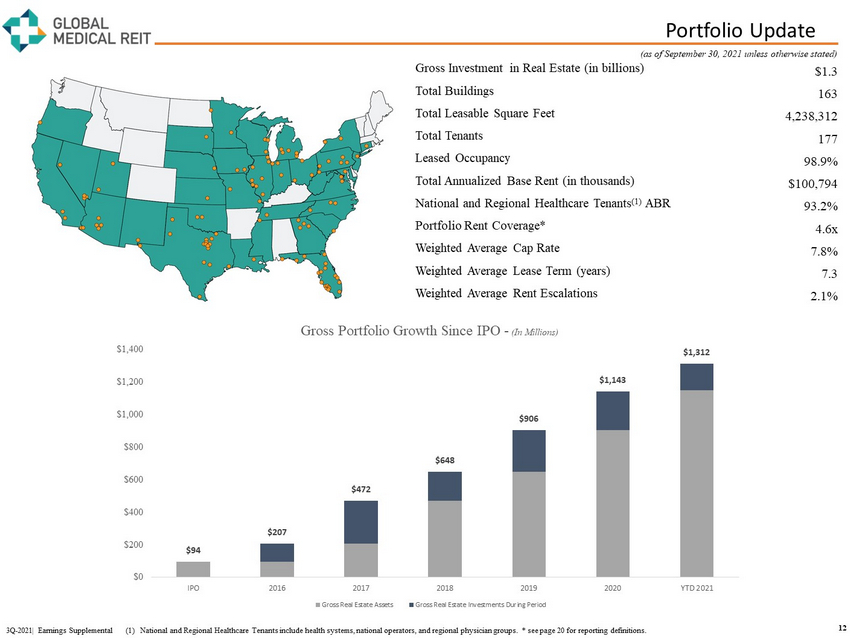
Portfolio Update 12 Gross Investment in Real Estate (in billions) $1.3 Total Buildings 163 Total Leasable Square Feet 4,238,312 Total Tenants 177 Leased Occupancy 98.9% Total Annualized Base Rent (in thousands) $100,794 National and Regional Healthcare Tenants (1) ABR 93.2% Portfolio Rent Coverage* 4.6x Weighted Average Cap Rate 7.8% Weighted Average Lease Term (years) 7.3 Weighted Average Rent Escalations 2.1% (as of September 30, 2021 unless otherwise stated) 3Q - 2021| Earnings Supplemental (1) National and Regional Healthcare Tenants include health systems, national operators, and regional physician groups. * see pa ge 20 for reporting definitions. $94 $207 $472 $648 $906 $1,143 $1,312 $0 $200 $400 $600 $800 $1,000 $1,200 $1,400 IPO 2016 2017 2018 2019 2020 YTD 2021 Gross Portfolio Growth Since IPO - (In Millions) Gross Real Estate Assets Gross Real Estate Investments During Period
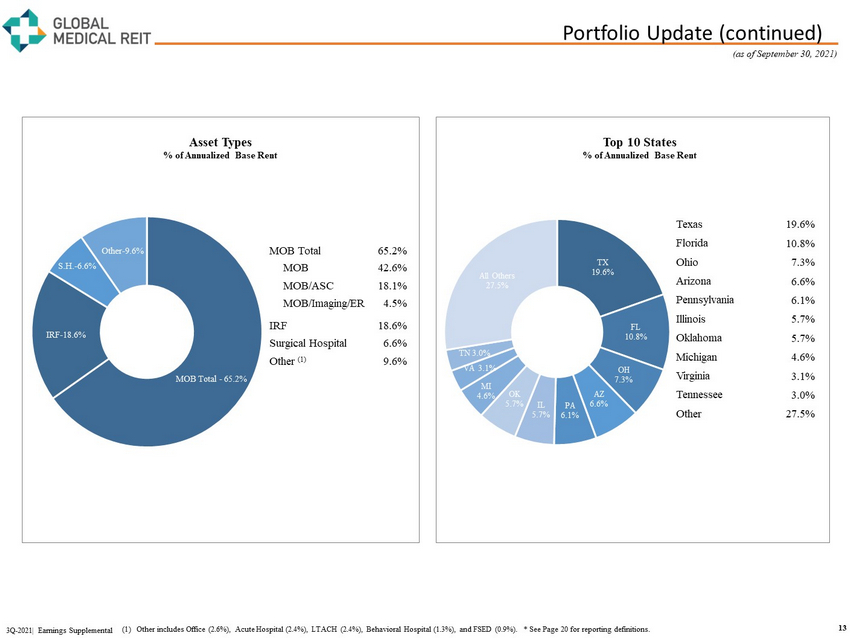
Portfolio Update (continued) 13 3Q - 2021| Earnings Supplemental (1) Other includes Office (2.6%), Acute Hospital (2.4%), LTACH (2.4%), Behavioral Hospital (1.3%), and FSED (0.9%). * See Page 2 0 f or reporting definitions. MOB Total - 65.2% IRF - 18.6% S.H. - 6.6% Other - 9.6% MOB Total 65.2% MOB 42.6% MOB/ASC 18.1% MOB/Imaging/ER 4.5% IRF 18.6% Surgical Hospital 6.6% Other (1) 9.6% Texas 19.6% Florida 10.8% Ohio 7.3% Arizona 6.6% Pennsylvania 6.1% Illinois 5.7% Oklahoma 5.7% Michigan 4.6% Virginia 3.1% Tennessee 3.0% Other 27.5% TX 19.6% FL 10.8% OH 7.3% AZ 6.6% PA 6.1% IL 5.7% OK 5.7% MI 4.6% VA 3.1% TN 3.0% All Others 27.5% Top 10 States % of Annualized Base Rent Asset Types % of Annualized Base Rent (as of September 30, 2021)
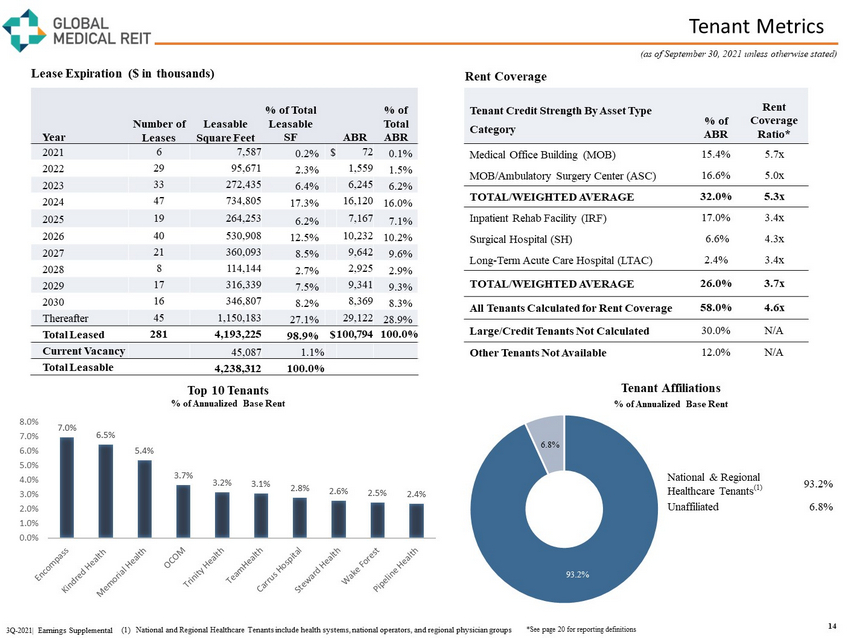
Tenant Metrics Year Number of Leases Leasable Square Feet % of Total Leasable SF ABR % of Total ABR 2021 6 7,587 0.2% $ 72 0.1% 2022 29 95,671 2.3% 1,559 1.5% 2023 33 272,435 6.4% 6,245 6.2% 2024 47 734,805 17.3% 16,120 16.0% 2025 19 264,253 6.2% 7,167 7.1% 2026 40 530,908 12.5% 10,232 10.2% 2027 21 360,093 8.5% 9,642 9.6% 2028 8 114,144 2.7% 2,925 2.9% 2029 17 316,339 7.5% 9,341 9.3% 2030 16 346,807 8.2% 8,369 8.3% Thereafter 45 1,150,183 27.1% 29,122 28.9% Total Leased 281 4,193,225 98.9% $ 100,794 100.0% Current Vacancy 45,087 1.1% Total Leasable 4,238,312 100.0% 14 3Q - 2021| Earnings Supplemental (as of September 30, 2021 unless otherwise stated) *See page 20 for reporting definitions Tenant Credit Strength By Asset Type Category % of ABR Rent Coverage Ratio* Medical Office Building (MOB) 15.4% 5.7x MOB/Ambulatory Surgery Center (ASC) 16.6% 5.0x TOTAL/WEIGHTED AVERAGE 32.0% 5.3x Inpatient Rehab Facility (IRF) 17.0% 3.4x Surgical Hospital (SH) 6.6% 4.3x Long - Term Acute Care Hospital (LTAC) 2.4% 3.4x TOTAL/WEIGHTED AVERAGE 26.0% 3.7x All Tenants Calculated for Rent Coverage 58.0% 4.6x Large/Credit Tenants Not Calculated 30.0% N/A Other Tenants Not Available 12.0% N/A Top 10 Tenants % of Annualized Base Rent 7.0% 6.5% 5.4% 3.7% 3.2% 3.1% 2.8% 2.6% 2.5% 2.4% 0.0% 1.0% 2.0% 3.0% 4.0% 5.0% 6.0% 7.0% 8.0% Lease Expiration ($ in thousands) Rent Coverage 93.2% 6.8% National & Regional Healthcare Tenants (1) 93.2% Unaffiliated 6.8% Tenant Affiliations % of Annualized Base Rent (1) National and Regional Healthcare Tenants include health systems, national operators, and regional physician groups
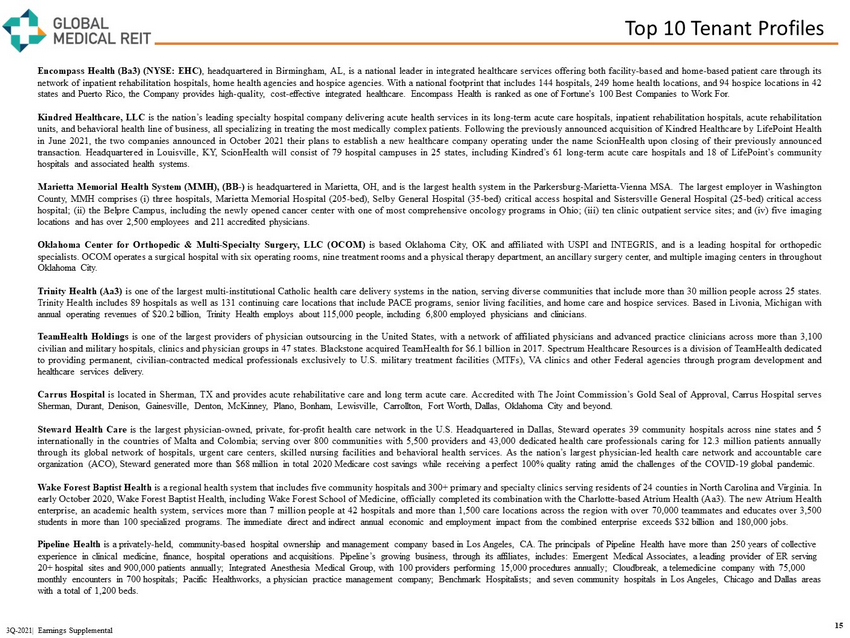
Top 10 Tenant Profiles 15 3Q - 2021| Earnings Supplemental Encompass Health (Ba 3 ) (NYSE : EHC) , headquartered in Birmingham, AL, is a national leader in integrated healthcare services offering both facility - based and home - based patient care through its network of inpatient rehabilitation hospitals, home health agencies and hospice agencies . With a national footprint that includes 144 hospitals, 249 home health locations, and 94 hospice locations in 42 states and Puerto Rico, the Company provides high - quality, cost - effective integrated healthcare . Encompass Health is ranked as one of Fortune's 100 Best Companies to Work For . Kindred Healthcare, LLC is the nation’s leading specialty hospital company delivering acute health services in its long - term acute care hospitals, inpatient rehabilitation hospitals, acute rehabilitation units, and behavioral health line of business, all specializing in treating the most medically complex patients . Following the previously announced acquisition of Kindred Healthcare by LifePoint Health in June 2021 , the two companies announced in October 2021 their plans to establish a new healthcare company operating under the name ScionHealth upon closing of their previously announced transaction . Headquartered in Louisville, KY, ScionHealth will consist of 79 hospital campuses in 25 states, including Kindred’s 61 long - term acute care hospitals and 18 of LifePoint’s community hospitals and associated health systems . Marietta Memorial Health System (MMH), (BB - ) is headquartered in Marietta, OH, and is the largest health system in the Parkersburg - Marietta - Vienna MSA . The largest employer in Washington County, MMH comprises ( i ) three hospitals, Marietta Memorial Hospital ( 205 - bed), Selby General Hospital ( 35 - bed) critical access hospital and Sistersville General Hospital ( 25 - bed) critical access hospital ; (ii) the Belpre Campus, including the newly opened cancer center with one of most comprehensive oncology programs in Ohio ; (iii) ten clinic outpatient service sites ; and (iv) five imaging locations and has over 2 , 500 employees and 211 accredited physicians . Oklahoma Center for Orthopedic & Multi - Specialty Surgery, LLC (OCOM) is based Oklahoma City, OK and affiliated with USPI and INTEGRIS, and is a leading hospital for orthopedic specialists . OCOM operates a surgical hospital with six operating rooms, nine treatment rooms and a physical therapy department, an ancillary surgery center, and multiple imaging centers in throughout Oklahoma City . Trinity Health (Aa 3 ) is one of the largest multi - institutional Catholic health care delivery systems in the nation, serving diverse communities that include more than 30 million people across 25 states . Trinity Health includes 89 hospitals as well as 131 continuing care locations that include PACE programs, senior living facilities, and home care and hospice services . Based in Livonia, Michigan with annual operating revenues of $ 20 . 2 billion, Trinity Health employs about 115 , 000 people, including 6 , 800 employed physicians and clinicians . TeamHealth Holdings is one of the largest providers of physician outsourcing in the United States, with a network of affiliated physicians and advanced practice clinicians across more than 3 , 100 civilian and military hospitals, clinics and physician groups in 47 states . Blackstone acquired TeamHealth for $ 6 . 1 billion in 2017 . Spectrum Healthcare Resources is a division of TeamHealth dedicated to providing permanent, civilian - contracted medical professionals exclusively to U . S . military treatment facilities (MTFs), VA clinics and other Federal agencies through program development and healthcare services delivery . Carrus Hospital is located in Sherman, TX and provides acute rehabilitative care and long term acute care . Accredited with The Joint Commission’s Gold Seal of Approval, Carrus Hospital serves Sherman, Durant, Denison, Gainesville, Denton, McKinney, Plano, Bonham, Lewisville, Carrollton, Fort Worth, Dallas, Oklahoma City and beyond . Steward Health Care is the largest physician - owned, private, for - profit health care network in the U . S . Headquartered in Dallas, Steward operates 39 community hospitals across nine states and 5 internationally in the countries of Malta and Colombia ; serving over 800 communities with 5 , 500 providers and 43 , 000 dedicated health care professionals caring for 12 . 3 million patients annually through its global network of hospitals, urgent care centers, skilled nursing facilities and behavioral health services . As the nation’s largest physician - led health care network and accountable care organization (ACO), Steward generated more than $ 68 million in total 2020 Medicare cost savings while receiving a perfect 100 % quality rating amid the challenges of the COVID - 19 global pandemic . Wake Forest Baptist Health is a regional health system that includes five community hospitals and 300 + primary and specialty clinics serving residents of 24 counties in North Carolina and Virginia . In early October 2020 , Wake Forest Baptist Health, including Wake Forest School of Medicine, officially completed its combination with the Charlotte - based Atrium Health (Aa 3 ) . The new Atrium Health enterprise, an academic health system, services more than 7 million people at 42 hospitals and more than 1 , 500 care locations across the region with over 70 , 000 teammates and educates over 3 , 500 students in more than 100 specialized programs . The immediate direct and indirect annual economic and employment impact from the combined enterprise exceeds $ 32 billion and 180 , 000 jobs . Pipeline Health is a privately-held, community-based hospital ownership and management company based in Los Angeles, CA. The principals of Pi pe line Health have more than 250 years of collective experience in clinical medicine, finance, hospital operations and acquisitions. Pipeline’s growing business, through its affi lia tes, includes: Emergent Medical Associates, a leading provider of ER serving 20+ hospital sites and 900,000 patients annually; Integrated Anesthesia Medical Group, with 100 providers performing 15,000 p roc edures annually; Cloudbreak , a telemedicine company with 75,000 monthly encounters in 700 hospitals; Pacific Healthworks, a physician practice management company; Benchmark Hospitalists; an d s even community hospitals in Los Angeles, Chicago and Dallas areas with a total of 1,200 beds.
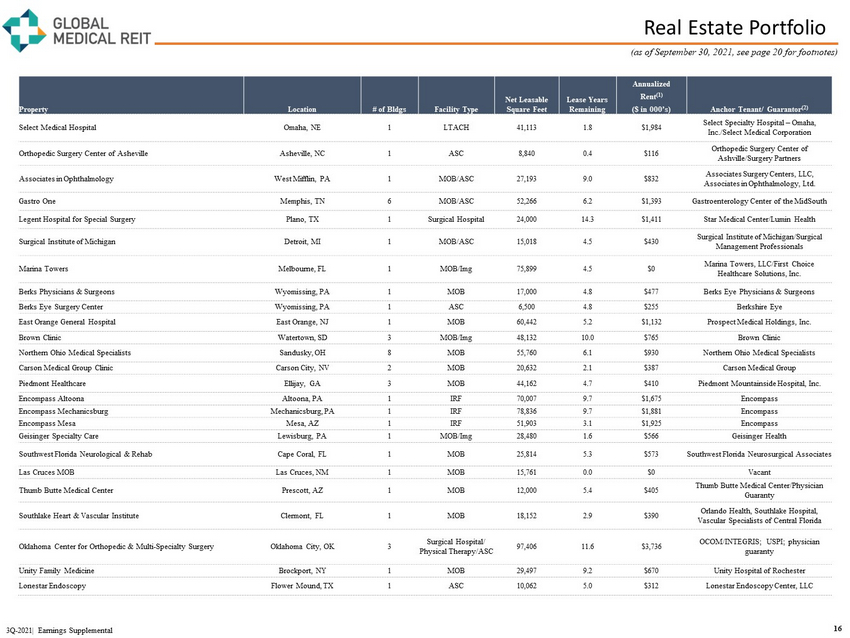
Real Estate Portfolio 16 3Q - 2021| Earnings Supplemental (as of September 30, 2021, see page 20 for footnotes) Property Location # of Bldgs Facility Type Net Leasable Square Feet Lease Years Remaining Annualized Anchor Tenant/ Guarantor (2) Rent (1) ($ in 000’s) Select Medical Hospital Omaha, NE 1 LTACH 41,113 1.8 $1,984 Select Specialty Hospital – Omaha, Inc./Select Medical Corporation Orthopedic Surgery Center of Asheville Asheville, NC 1 ASC 8,840 0.4 $116 Orthopedic Surgery Center of Ashville/Surgery Partners Associates in Ophthalmology West Mifflin, PA 1 MOB/ASC 27,193 9.0 $832 Associates Surgery Centers, LLC, Associates in Ophthalmology, Ltd. Gastro One Memphis, TN 6 MOB/ASC 52,266 6.2 $1,393 Gastroenterology Center of the MidSouth Legent Hospital for Special Surgery Plano, TX 1 Surgical Hospital 24,000 14.3 $1,411 Star Medical Center/Lumin Health Surgical Institute of Michigan Detroit, MI 1 MOB/ASC 15,018 4.5 $430 Surgical Institute of Michigan/Surgical Management Professionals Marina Towers Melbourne, FL 1 MOB/Img 75,899 4.5 $0 Marina Towers, LLC/First Choice Healthcare Solutions, Inc. Berks Physicians & Surgeons Wyomissing, PA 1 MOB 17,000 4.8 $477 Berks Eye Physicians & Surgeons Berks Eye Surgery Center Wyomissing, PA 1 ASC 6,500 4.8 $255 Berkshire Eye East Orange General Hospital East Orange, NJ 1 MOB 60,442 5.2 $1,132 Prospect Medical Holdings, Inc. Brown Clinic Watertown, SD 3 MOB/Img 48,132 10.0 $765 Brown Clinic Northern Ohio Medical Specialists Sandusky, OH 8 MOB 55,760 6.1 $930 Northern Ohio Medical Specialists Carson Medical Group Clinic Carson City, NV 2 MOB 20,632 2.1 $387 Carson Medical Group Piedmont Healthcare Ellijay, GA 3 MOB 44,162 4.7 $410 Piedmont Mountainside Hospital, Inc. Encompass Altoona Altoona, PA 1 IRF 70,007 9.7 $1,675 Encompass Encompass Mechanicsburg Mechanicsburg, PA 1 IRF 78,836 9.7 $1,881 Encompass Encompass Mesa Mesa, AZ 1 IRF 51,903 3.1 $1,925 Encompass Geisinger Specialty Care Lewisburg, PA 1 MOB/Img 28,480 1.6 $566 Geisinger Health Southwest Florida Neurological & Rehab Cape Coral, FL 1 MOB 25,814 5.3 $573 Southwest Florida Neurosurgical Associates Las Cruces MOB Las Cruces, NM 1 MOB 15,761 0.0 $0 Vacant Thumb Butte Medical Center Prescott, AZ 1 MOB 12,000 5.4 $405 Thumb Butte Medical Center/Physician Guaranty Southlake Heart & Vascular Institute Clermont, FL 1 MOB 18,152 2.9 $390 Orlando Health, Southlake Hospital, Vascular Specialists of Central Florida Oklahoma Center for Orthopedic & Multi - Specialty Surgery Oklahoma City, OK 3 Surgical Hospital/ Physical Therapy/ASC 97,406 11.6 $3,736 OCOM/INTEGRIS; USPI; physician guaranty Unity Family Medicine Brockport, NY 1 MOB 29,497 9.2 $670 Unity Hospital of Rochester Lonestar Endoscopy Flower Mound, TX 1 ASC 10,062 5.0 $312 Lonestar Endoscopy Center, LLC

Real Estate Portfolio 17 3Q - 2021| Earnings Supplemental (as of September 30, 2021, see page 20 for footnotes) Property Location # of Bldgs Facility Type Net Leasable Square Feet Lease Years Remaining Annualized Anchor Tenant/ Guarantor (2) Rent (1) ($ in 000’s) Carrus Specialty Hospital Sherman, TX 1 IRF/LTACH 69,352 15.7 $2,821 SDB Partners, LLC Cardiologists of Lubbock Lubbock, TX 1 MOB 27,280 7.9 $650 Lubbock Heart Hospital/Surgery Partners, Inc. Conrad Pearson Clinic Germantown, TN 1 MOB/ASC 33,777 2.7 $1,579 Urology Center of the South/Physician guarantees Central Texas Rehabilitation Clinic Austin, TX 1 IRF 59,258 5.6 $3,247 CTRH, LLC / Kindred Health GI Alliance Fort Worth, TX 1 MOB 18,084 6.7 $476 Texas Digestive Disease Consultants Albertville Medical Building Albertville, MN 1 MOB 21,486 7.2 $507 Stellis Health Heartland Clinic Moline, IL 1 MOB/ASC 34,020 11.7 $961 Heartland Clinic Kansas City Cardiology Lee’s Summit, MO 1 MOB 12,180 3.2 $292 Kansas City Cardiology Amarillo Bone & Joint Clinic Amarillo, TX 1 MOB 23,298 8.2 $630 Amarillo Bone & Joint Clinic Respiratory Specialists Wyomissing, PA 1 MOB 17,598 6.2 $430 Berks Respiratory Comprehensive Eyecare Partners St. George, UT 1 MOB/ASC 16,000 8.2 $424 Zion Eye Institute Fresenius Kidney Care Moline, IL 2 MOB 27,173 9.6 $592 Quad City Nephrology/Fresenius Medical Care Holdings Northern Ohio Medical Specialists Fremont, OH 1 MOB 25,893 8.4 $655 Northern Ohio Medical Specialists Gainesville Eye Gainesville, GA 1 MOB/ASC 34,020 8.4 $824 SCP Eyecare Services City Hospital at White Rock Dallas, TX 1 Acute Hospital 236,314 16.4 $2,412 Pipeline East Dallas Orlando Health Orlando, FL 5 MOB 59,644 2.5 $1,314 Orlando Health Memorial Health System Belpre, OH 4 MOB/Img/ER/ASC 155,600 9.4 $5,482 Marietta Memorial Valley ENT McAllen, TX 1 MOB 30,811 7.9 $466 Valley ENT Rock Surgery Center Derby, KS 1 ASC 16,704 5.7 $0 Rock Surgery Center/Rock Medical Assets Foot and Ankle Specialists Bountiful, UT 1 MOB 22,335 12.1 $395 Foot and Ankle Specialists of Utah / physician guaranty TriHealth Cincinnati, OH 1 MOB 18,820 3.5 $334 TriHealth Cancer Center of Brevard Melbourne, FL 1 Cancer Center 19,074 9.2 $563 Brevard Radiation Oncology / Vantage Oncology Heartland Women's Healthcare Southern IL 6 MOB 64,966 8.42 $1,165 Heartland Women's Healthcare / USA OBGYN Management Prospect Medical Vernon, CT 2 MOB/Dialysis/Office 58,550 9.95 $809 Prospect ECHN / Prospect Medical Holdings, Inc. Citrus Valley Medical Associates Corona, CA 1 MOB 41,803 9.2 $1,253 Citrus Valley Medical Associates
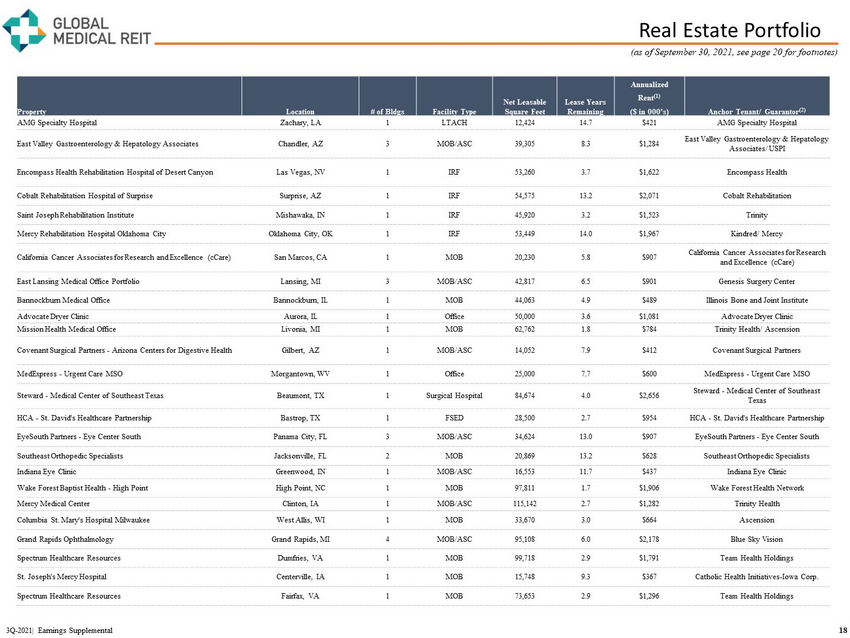
Real Estate Portfolio 18 3Q - 2021| Earnings Supplemental (as of September 30, 2021, see page 20 for footnotes) Property Location # of Bldgs Facility Type Net Leasable Square Feet Lease Years Remaining Annualized Anchor Tenant/ Guarantor (2) Rent (1) ($ in 000’s) AMG Specialty Hospital Zachary, LA 1 LTACH 12,424 14.7 $421 AMG Specialty Hospital East Valley Gastroenterology & Hepatology Associates Chandler, AZ 3 MOB/ASC 39,305 8.3 $1,284 East Valley Gastroenterology & Hepatology Associates/ USPI Encompass Health Rehabilitation Hospital of Desert Canyon Las Vegas, NV 1 IRF 53,260 3.7 $1,622 Encompass Health Cobalt Rehabilitation Hospital of Surprise Surprise, AZ 1 IRF 54,575 13.2 $2,071 Cobalt Rehabilitation Saint Joseph Rehabilitation Institute Mishawaka, IN 1 IRF 45,920 3.2 $1,523 Trinity Mercy Rehabilitation Hospital Oklahoma City Oklahoma City, OK 1 IRF 53,449 14.0 $1,967 Kindred/ Mercy California Cancer Associates for Research and Excellence (cCare) San Marcos, CA 1 MOB 20,230 5.8 $907 California Cancer Associates for Research and Excellence (cCare) East Lansing Medical Office Portfolio Lansing, MI 3 MOB/ASC 42,817 6.5 $901 Genesis Surgery Center Bannockburn Medical Office Bannockburn, IL 1 MOB 44,063 4.9 $489 Illinois Bone and Joint Institute Advocate Dryer Clinic Aurora, IL 1 Office 50,000 3.6 $1,081 Advocate Dryer Clinic Mission Health Medical Office Livonia, MI 1 MOB 62,762 1.8 $784 Trinity Health/ Ascension Covenant Surgical Partners - Arizona Centers for Digestive Health Gilbert, AZ 1 MOB/ASC 14,052 7.9 $412 Covenant Surgical Partners MedExpress - Urgent Care MSO Morgantown, WV 1 Office 25,000 7.7 $600 MedExpress - Urgent Care MSO Steward - Medical Center of Southeast Texas Beaumont, TX 1 Surgical Hospital 84,674 4.0 $2,656 Steward - Medical Center of Southeast Texas HCA - St. David's Healthcare Partnership Bastrop, TX 1 FSED 28,500 2.7 $954 HCA - St. David's Healthcare Partnership EyeSouth Partners - Eye Center South Panama City, FL 3 MOB/ASC 34,624 13.0 $907 EyeSouth Partners - Eye Center South Southeast Orthopedic Specialists Jacksonville, FL 2 MOB 20,869 13.2 $628 Southeast Orthopedic Specialists Indiana Eye Clinic Greenwood, IN 1 MOB/ASC 16,553 11.7 $437 Indiana Eye Clinic Wake Forest Baptist Health - High Point High Point, NC 1 MOB 97,811 1.7 $1,906 Wake Forest Health Network Mercy Medical Center Clinton, IA 1 MOB/ASC 115,142 2.7 $1,282 Trinity Health Columbia St. Mary's Hospital Milwaukee West Allis, WI 1 MOB 33,670 3.0 $664 Ascension Grand Rapids Ophthalmology Grand Rapids, MI 4 MOB/ASC 95,108 6.0 $2,178 Blue Sky Vision Spectrum Healthcare Resources Dumfries, VA 1 MOB 99,718 2.9 $1,791 Team Health Holdings St. Joseph's Mercy Hospital Centerville, IA 1 MOB 15,748 9.3 $367 Catholic Health Initiatives - Iowa Corp. Spectrum Healthcare Resources Fairfax, VA 1 MOB 73,653 2.9 $1,296 Team Health Holdings
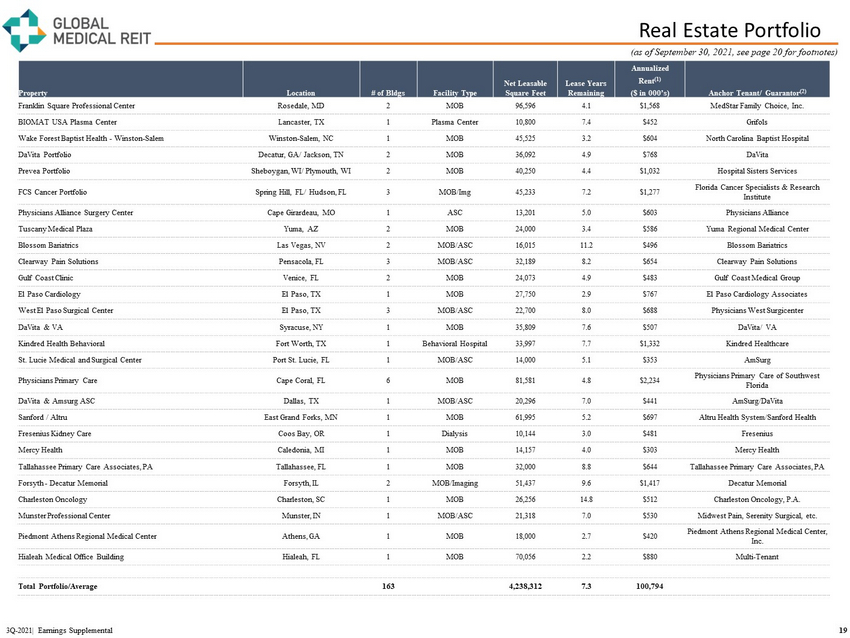
Real Estate Portfolio 19 3Q - 2021| Earnings Supplemental (as of September 30, 2021, see page 20 for footnotes) Property Location # of Bldgs Facility Type Net Leasable Square Feet Lease Years Remaining Annualized Anchor Tenant/ Guarantor (2) Rent (1) ($ in 000’s) Franklin Square Professional Center Rosedale, MD 2 MOB 96,596 4.1 $1,568 MedStar Family Choice, Inc. BIOMAT USA Plasma Center Lancaster, TX 1 Plasma Center 10,800 7.4 $452 Grifols Wake Forest Baptist Health - Winston - Salem Winston - Salem, NC 1 MOB 45,525 3.2 $604 North Carolina Baptist Hospital DaVita Portfolio Decatur, GA/ Jackson, TN 2 MOB 36,092 4.9 $768 DaVita Prevea Portfolio Sheboygan, WI/ Plymouth, WI 2 MOB 40,250 4.4 $1,032 Hospital Sisters Services FCS Cancer Portfolio Spring Hill, FL/ Hudson, FL 3 MOB/Img 45,233 7.2 $1,277 Florida Cancer Specialists & Research Institute Physicians Alliance Surgery Center Cape Girardeau, MO 1 ASC 13,201 5.0 $603 Physicians Alliance Tuscany Medical Plaza Yuma, AZ 2 MOB 24,000 3.4 $586 Yuma Regional Medical Center Blossom Bariatrics Las Vegas, NV 2 MOB/ASC 16,015 11.2 $496 Blossom Bariatrics Clearway Pain Solutions Pensacola, FL 3 MOB/ASC 32,189 8.2 $654 Clearway Pain Solutions Gulf Coast Clinic Venice, FL 2 MOB 24,073 4.9 $483 Gulf Coast Medical Group El Paso Cardiology El Paso, TX 1 MOB 27,750 2.9 $767 El Paso Cardiology Associates West El Paso Surgical Center El Paso, TX 3 MOB/ASC 22,700 8.0 $688 Physicians West Surgicenter DaVita & VA Syracuse, NY 1 MOB 35,809 7.6 $507 DaVita/ VA Kindred Health Behavioral Fort Worth, TX 1 Behavioral Hospital 33,997 7.7 $1,332 Kindred Healthcare St. Lucie Medical and Surgical Center Port St. Lucie, FL 1 MOB/ASC 14,000 5.1 $353 AmSurg Physicians Primary Care Cape Coral, FL 6 MOB 81,581 4.8 $2,234 Physicians Primary Care of Southwest Florida DaVita & Amsurg ASC Dallas, TX 1 MOB/ASC 20,296 7.0 $441 AmSurg/DaVita Sanford / Altru East Grand Forks, MN 1 MOB 61,995 5.2 $697 Altru Health System/Sanford Health Fresenius Kidney Care Coos Bay, OR 1 Dialysis 10,144 3.0 $481 Fresenius Mercy Health Caledonia, MI 1 MOB 14,157 4.0 $303 Mercy Health Tallahassee Primary Care Associates, PA Tallahassee, FL 1 MOB 32,000 8.8 $644 Tallahassee Primary Care Associates, PA Forsyth - Decatur Memorial Forsyth, IL 2 MOB/Imaging 51,437 9.6 $1,417 Decatur Memorial Charleston Oncology Charleston, SC 1 MOB 26,256 14.8 $512 Charleston Oncology, P.A. Munster Professional Center Munster, IN 1 MOB/ASC 21,318 7.0 $530 Midwest Pain, Serenity Surgical, etc. Piedmont Athens Regional Medical Center Athens, GA 1 MOB 18,000 2.7 $420 Piedmont Athens Regional Medical Center, Inc. Hialeah Medical Office Building Hialeah, FL 1 MOB 70,056 2.2 $880 Multi - Tenant Total Portfolio/Average 163 4,238,312 7.3 100,794
Reporting Definitions and Other Disclosures Reporting Definitions Annualized Base Rent Annualized base rent represents monthly base rent for most recent month or month of acquisition, multiplied by 12 (or actual NOI where more reflective of property performance). In addition, Marina Towers and Rock Surgery Center are presented on a cash - collected basis. Accordingly, this meth odology produces an annualized amount as of a point in time but does not take into account future contractual rental rate increases. Capitalization Rate The capitalization rate (“Cap Rate”) for an acquisition is calculated by dividing current Annualized Base Rent by contractual pu rchase price. For the portfolio capitalization rate, certain adjustments, including for subsequent capital invested, are made to the contractual purchase price. Earnings Before Interest, Taxes, Depreciation and Amortization for Real Estate ( EBITDA re and Adjusted EBITDA re ) We calculate EBITDA re in accordance with standards established by NAREIT and define EBITDA re as net income or loss computed in accordance with GAAP plus depreciation and amortization, interest expense, gain or loss on the sale of investment properties, and impairment loss, as a ppl icable. We define Adjusted EBITDA re as EBITDA re plus non - cash stock compensation expense, non - cash intangible amortization related to above and below market leases, preacquisition expense and other normalizing items. Management considers EBITDA re and Adjusted EBITDA re important measures because they provide additional information to allow management, investors, and our current and potential creditors to evaluate and compare our core operatin g r esults and our ability to service debt. Funds from Operations and Adjusted Funds from Operations Funds from operations (“FFO”) and adjusted funds from operations (“AFFO”) are non - GAAP financial measures within the meaning of the rules of the SEC. The Company considers FFO and AFFO to be important supplemental measures of its operating performance and believes FFO is frequently used by securities analysts, investors, and other interested parties in the evaluation of REITs, many of which present FFO when reporting their results. In accordance with the National Association of Real Estate Investment Trusts’ (“NAREIT”) definition, FFO means net income or los s computed in accordance with GAAP before noncontrolling interests of holders of OP Units and LTIP Units, excluding gains (or losses) from sales of property and ex traordinary items, less preferred stock dividends, plus real estate - related depreciation and amortization (excluding amortization of debt issuance costs and the amortization of ab ove and below market leases), and after adjustments for unconsolidated partnerships and joint ventures. Because FFO excludes real estate - related depreciation and amorti zation (other than amortization of debt issuance costs and above and below market lease amortization expense), the Company believes that FFO provides a performance m eas ure that, when compared period - over - period, reflects the impact to operations from trends in occupancy rates, rental rates, operating costs, development activiti es and interest costs, providing perspective not immediately apparent from the closest GAAP measurement, net income or loss. AFFO is a non - GAAP measure used by many investors and analysts to measure a real estate company’s operating performance by remov ing the effect of items that do not reflect ongoing property operations. Management calculates AFFO by modifying the NAREIT computation of FFO by adjusting it fo r c ertain cash and non - cash items and certain recurring and non - recurring items. For the Company these items include recurring acquisition and disposition costs, loss on the extinguishment of debt, recurring straight line deferred rental revenue, recurring stock - based compensation expense, recurring amortization of above and below market lease s, recurring amortization of debt issuance costs, recurring lease commissions, management internalization costs, and other items. Management believes that reporting AFFO in addition to FFO is a useful supplemental measure for the investment community to u se when evaluating the operating performance of the Company on a comparative basis. 20 (as of September 30, 2021) 3Q - 2021| Earnings Supplemental
Reporting Definitions and Other Disclosures Reporting Definitions (continued) Rent Coverage Ratio For purposes of calculating our portfolio weighted - average EBITDARM coverage ratio (“Rent Coverage Ratio”), we excluded credit - r ated tenants or their subsidiaries for which financial statements were either not available or not sufficiently detailed. These ratios are based on latest available information only. Most tenant fin ancial statements are unaudited and we have not independently verified any tenant financial information (audited or unaudited) and, therefore, we cannot assure you that such information is accurate or comple te. Certain other tenants (approximately 12% of our portfolio) are excluded from the calculation due to ( i ) lack of available financial information or (ii) receipt of significant COVID - 19 relief funds that may cause reported coverage to differ materially from underlying performance. Additionally, our Rent Coverage Ratio adds back physician distributions and compensation. Management believes all adjustments ar e reasonable and necessary. Other Disclosures Non - GAAP Financial Measures Management considers certain non - GAAP financial measures to be useful supplemental measures of the Company's operating performan ce. For the Company, non - GAAP measures consist of EBITDA re , Adjusted EBITDA re , FFO and AFFO. A non - GAAP financial measure is generally defined as one that purports to measure financial performance, financi al position or cash flows, but excludes or includes amounts that would not be so adjusted in the most comparable measure determined in accordance with GAAP. The Company reports non - GAAP financial measures because these measures are observed by management to also be among the most predominant measures used by the REIT industry and by industry analysts to evaluate REIT s. For these reasons, management deems it appropriate to disclose and discuss these non - GAAP financial measures. The non - GAAP financial measures presented herein are not necessarily identical to those presented by other real estate companies due to the fact that not all real estate companies use the same definitions. These measures should not be considered as alternatives to net income, as indicators of the Company's financial performance, or as alternatives to cash flow from operating activities as measures of the Company's liquidity, nor are these measures necessarily indicative of sufficient cash flow to fund all of the Company's needs . M anagement believes that in order to facilitate a clear understanding of the Company's historical consolidated operating results, these measures should be examined in conjunction with net income and cas h f lows from operations as presented elsewhere herein. Forward - Looking Statements Certain statements contained herein may be considered “forward - looking statements” within the meaning of the Private Securities Litigation Reform Act of 1995, and it is the Company’s intent that any such statements be protected by the safe harbor created thereby. These forward - looking statements are identified by their use of terms and phrases such as "anticipate," "believe," "could," "estimate," "expect," "intend," "may," "should," "plan," "predict," "project," "will," "continue" and other similar terms and phrases, in clu ding references to assumptions and forecasts of future results. Except for historical information, the statements set forth herein including, but not limited to, any statements regarding our earnings, ou r tenants’ ability to pay rent to us, expected financial performance (including future cash flows associated with new tenants), future dividends or other financial items; any other statements concerning ou r p lans, strategies, objectives and expectations for future operations, our pipeline of acquisition opportunities and expected acquisition activity, including the timing and/or successful completion of any acqu isi tions and expected rent receipts on these properties, our expected disposition activity, including the timing and/or successful completion of any dispositions and the expected use of proceeds therefrom, a nd any statements regarding future economic conditions or performance are forward - looking statements. These forward - looking statements are based on our current expectations, estimates and assumptions an d are subject to certain risks and uncertainties. Although the Company believes that the expectations, estimates and assumptions reflected in its forward - looking statements are reasonable, actual res ults could differ materially from those projected or assumed in any of the Company’s forward - looking statements. Additional information concerning us and our business, including additional factors that c ould materially and adversely affect our financial results, include, without limitation, the risks described under Part I, Item 1A - Risk Factors, in our Annual Report on Form 10 - K, our Quarterly Reports o n Form 10 - Q, and in our other filings with the SEC. You are cautioned not to place undue reliance on forward - looking statements. The Company does not intend, and undertakes no obligation, to update any for ward - looking statement. Additional Information The information in this document should be read in conjunction with the Company’s Annual Report on Form 10 - K, Quarterly Reports on Form 10 - Q, Current Reports on Form 8 - K, and other information filed with, or furnished to, the SEC. You can access the Company’s reports and amendments to those reports filed or furnished to the SEC pursuant to Section 13(a) or 15(d) of the Exchange Act in the “Investor Relations” section on the Company’s website (www.globalmedicalreit.com) under “SEC Filings” as soon as reasonably p rac ticable after they are filed with, or furnished to, the SEC. The information on or connected to the Company’s website is not, and shall not be deemed to be, a part of, or incorporated into, thi s Earnings Supplemental. You also can review these SEC filings and other information by accessing the SEC’s website at http://www.sec.gov . Certain information contained in this package, including, but not limited to, information contained in our Top 10 tenant prof ile s is derived from publicly - available third - party sources. The Company has not independently verified this information and there can be no assurance that such information is accurate or complete. 21 (as of September 30, 2021) 3Q - 2021| Earnings Supplemental
Stephen Swett stephen.swett@icrinc.com 203.682.8377 www.globalmedicalreit.com NYSE: GMRE INVESTOR RELATIONS