Exhibit 99.2
Fourth Quarter 2021 Earnings Supplemental Three and Twelve Months Ended December 31, 2021 www.globalmedicalreit.com NYSE: GMRE
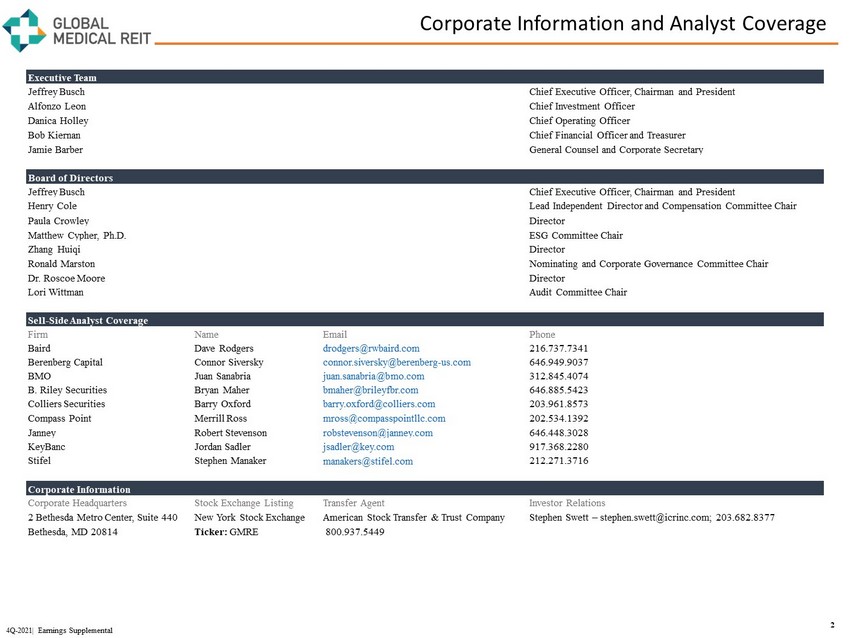
Corporate Information and Analyst Coverage 2 4Q - 2021| Earnings Supplemental Executive Team Jeffrey Busch Chief Executive Officer, Chairman and President Alfonzo Leon Chief Investment Officer Danica Holley Chief Operating Officer Bob Kiernan Chief Financial Officer and Treasurer Jamie Barber General Counsel and Corporate Secretary Board of Directors Jeffrey Busch Chief Executive Officer, Chairman and President Henry Cole Lead Independent Director and Compensation Committee Chair Paula Crowley Director Matthew Cypher, Ph.D. ESG Committee Chair Zhang Huiqi Director Ronald Marston Nominating and Corporate Governance Committee Chair Dr. Roscoe Moore Director Lori Wittman Audit Committee Chair Sell - Side Analyst Coverage Firm Name Email Phone Baird Dave Rodgers drodgers@rwbaird.com 216.737.7341 Berenberg Capital Connor Siversky connor.siversky@berenberg - us.com 646.949.9037 BMO Juan Sanabria juan.sanabria@bmo.com 312.845.4074 B. Riley Securities Bryan Maher bmaher@brileyfbr.com 646.885.5423 Colliers Securities Barry Oxford barry.oxford@colliers.com 203.961.8573 Compass Point Merrill Ross mross@compasspointllc.com 202.534.1392 Janney Robert Stevenson robstevenson@janney.com 646.448.3028 KeyBanc Jordan Sadler jsadler@key.com 917.368.2280 Stifel Stephen Manaker manakers@stifel.com 212.271.3716 Corporate Information Corporate Headquarters Stock Exchange Listing Transfer Agent Investor Relations 2 Bethesda Metro Center, Suite 440 New York Stock Exchange American Stock Transfer & Trust Company Stephen Swett – stephen.swett@icrinc.com; 203.682.8377 Bethesda, MD 20814 Ticker: GMRE 800.937.5449
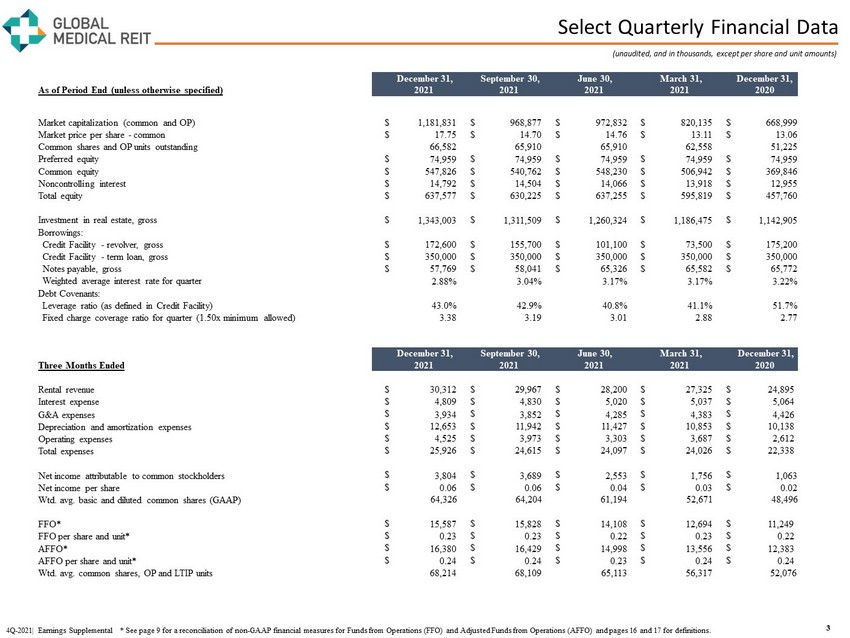
Select Quarterly Financial Data (unaudited, and in thousands, except per share and unit amounts) 3 4Q - 2021| Earnings Supplemental * See page 9 for a reconciliation of non - GAAP financial measures for Funds from Operations (FFO ) and Adjusted Funds from Operations (AFFO) and pages 16 and 17 for definitions. December 31, September 30, June 30, March 31, December 31, As of Period End (unless otherwise specified) 2021 2021 2021 2021 2020 Market capitalization (common and OP) $ 1,181,831 $ 968,877 $ 972,832 $ 820,135 $ 668,999 Market price per share - common $ 17.75 $ 14.70 $ 14.76 $ 13.11 $ 13.06 Common shares and OP units outstanding 66,582 65,910 65,910 62,558 51,225 Preferred equity $ 74,959 $ 74,959 $ 74,959 $ 74,959 $ 74,959 Common equity $ 547,826 $ 540,762 $ 548,230 $ 506,942 $ 369,846 Noncontrolling interest $ 14,792 $ 14,504 $ 14,066 $ 13,918 $ 12,955 Total equity $ 637,577 $ 630,225 $ 637,255 $ 595,819 $ 457,760 Investment in real estate, gross $ 1,343,003 $ 1,311,509 $ 1,260,324 $ 1,186,475 $ 1,142,905 Borrowings: Credit Facility - revolver, gross $ 172,600 $ 155,700 $ 101,100 $ 73,500 $ 175,200 Credit Facility - term loan, gross $ 350,000 $ 350,000 $ 350,000 $ 350,000 $ 350,000 Notes payable, gross $ 57,769 $ 58,041 $ 65,326 $ 65,582 $ 65,772 Weighted average interest rate for quarter 2.88% 3.04% 3.17% 3.17% 3.22% Debt Covenants: Leverage ratio (as defined in Credit Facility) 43.0% 42.9% 40.8% 41.1% 51.7% Fixed charge coverage ratio for quarter (1.50x minimum allowed) 3.38 3.19 3.01 2.88 2.77 December 31, September 30, June 30, March 31, December 31, Three Months Ended 2021 2021 2021 2021 2020 Rental revenue $ 30,312 $ 29,967 $ 28,200 $ 27,325 $ 24,895 Interest expense $ 4,809 $ 4,830 $ 5,020 $ 5,037 $ 5,064 G&A expenses $ 3,934 $ 3,852 $ 4,285 $ 4,383 $ 4,426 Depreciation and amortization expenses $ 12,653 $ 11,942 $ 11,427 $ 10,853 $ 10,138 Operating expenses $ 4,525 $ 3,973 $ 3,303 $ 3,687 $ 2,612 Total expenses $ 25,926 $ 24,615 $ 24,097 $ 24,026 $ 22,338 Net income attributable to common stockholders $ 3,804 $ 3,689 $ 2,553 $ 1,756 $ 1,063 Net income per share $ 0.06 $ 0.06 $ 0.04 $ 0.03 $ 0.02 Wtd. avg. basic and diluted common shares (GAAP) 64,326 64,204 61,194 52,671 48,496 FFO* $ 15,587 $ 15,828 $ 14,108 $ 12,694 $ 11,249 FFO per share and unit* $ 0.23 $ 0.23 $ 0.22 $ 0.23 $ 0.22 AFFO* $ 16,380 $ 16,429 $ 14,998 $ 13,556 $ 12,383 AFFO per share and unit* $ 0.24 $ 0.24 $ 0.23 $ 0.24 $ 0.24 Wtd. avg. common shares, OP and LTIP units 68,214 68,109 65,113 56,317 52,076
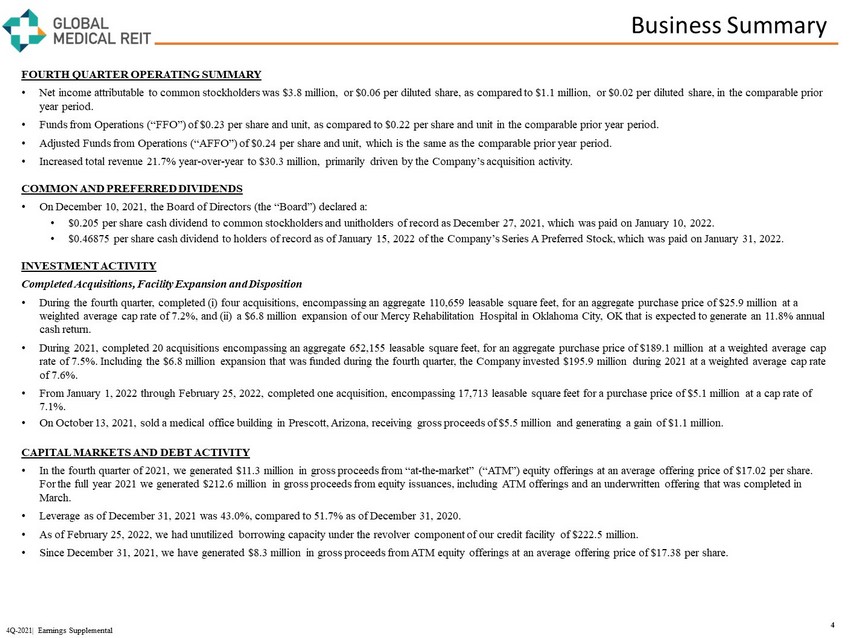
Business Summary 4 4Q - 2021| Earnings Supplemental FOURTH QUARTER OPERATING SUMMARY • Net income attributable to common stockholders was $3.8 million, or $0.06 per diluted share, as compared to $1.1 million, or $0. 02 per diluted share, in the comparable prior year period. • Funds from Operations (“FFO”) of $0.23 per share and unit, as compared to $0.22 per share and unit in the comparable prior ye ar period. • Adjusted Funds from Operations (“AFFO”) of $0.24 per share and unit, which is the same as the comparable prior year period. • Increased total revenue 21.7% year - over - year to $30.3 million, primarily driven by the Company’s acquisition activity. COMMON AND PREFERRED DIVIDENDS • On December 10, 2021, the Board of Directors (the “Board”) declared a: • $0.205 per share cash dividend to common stockholders and unitholders of record as December 27, 2021, which was paid on Janua ry 10, 2022. • $0.46875 per share cash dividend to holders of record as of January 15, 2022 of the Company’s Series A Preferred Stock, which wa s paid on January 31, 2022. INVESTMENT ACTIVITY Completed Acquisitions, Facility Expansion and Disposition • During the fourth quarter, completed (i) four acquisitions, encompassing an aggregate 110,659 leasable square feet, for an ag gre gate purchase price of $25.9 million at a weighted average cap rate of 7.2%, and (ii) a $6.8 million expansion of our Mercy Rehabilitation Hospital in Oklahoma City, O K t hat is expected to generate an 11.8% annual cash return. • During 2021, completed 20 acquisitions encompassing an aggregate 652,155 leasable square feet, for an aggregate purchase pric e o f $189.1 million at a weighted average cap rate of 7.5%. Including the $6.8 million expansion that was funded during the fourth quarter, the Company invested $195.9 mil lio n during 2021 at a weighted average cap rate of 7.6%. • From January 1, 2022 through February 25, 2022, completed one acquisition, encompassing 17,713 leasable square feet for a pur cha se price of $5.1 million at a cap rate of 7.1%. • On October 13, 2021, sold a medical office building in Prescott, Arizona, receiving gross proceeds of $5.5 million and genera tin g a gain of $1.1 million. CAPITAL MARKETS AND DEBT ACTIVITY • In the fourth quarter of 2021, we generated $11.3 million in gross proceeds from “at - the - market” (“ATM”) equity offerings at an average offering price of $17.02 per share. F or the full year 2021 we generated $212.6 million in gross proceeds from equity issuances, including ATM offerings and an und erw ritten offering that was completed in March. • Leverage as of December 31, 2021 was 43.0%, compared to 51.7% as of December 31, 2020. • As of February 25, 2022, we had unutilized borrowing capacity under the revolver component of our credit facility of $222.5 m ill ion. • Since December 31, 2021, we have generated $8.3 million in gross proceeds from ATM equity offerings at an average offering pr ice of $17.38 per share.
ESG Summary 5 4Q - 2021| Earnings Supplemental ENVIRONMENTAL, SOCIAL AND GOVERNANCE (ESG) UPDATE • Our business values integrate environmental sustainability, social responsibility, and strong governance practices throughout ou r Company. We base our ESG approach on three pillars: alignment, access and authenticity. • On February 1, 2022, we issued our inaugural Corporate Social Responsibility Report, which is available at https://www.globalmedicalreit.com/about/corporate - responsibility/ Environment • Our 2020 GRESB score was 42, compared to our 2019 GRESB score of 21. We believe this increase is due to our continued effort s t o collect and document our tenants’ energy usage data. • We incorporate climate risks and environmental sustainability assessments in our due diligence process. During the fourth quarter of 2021, we initiated the implementation of utility and energy audits to be performed by third - party engineering consultants during the due diligence phase of our acquisiti ons. The energy consumption data that we collect will be used to assess facilities’ carbon emission levels. Capturing and tracking this information will help inform future mi tig ation and remediation efforts where possible. • We are exploring ways to mitigate climate risk, should it be present, in our acquisition strategy, as well as ways to contrib ute to the reduction of climate impact through proactive asset management that looks for ways to incorporate renewable energy resources and energy utilization reduction. • We stand with our communities, tenants, and stockholders in supporting meaningful solutions that address this global challeng e a nd contribute to the sustainability of our business objectives. Social • Our commitment to employee engagement remains a high - priority, as we continue to make accommodations for health, safety, and wor k - life balance. With this commitment in mind, and with the compensation committee of the Board’s leadership, we conducted an employee survey that covered a comprehen siv e range of subjects related to our employees’ attitudes about our work culture, compensation components, as well as demographic and identification data. • On November 1, 2021, we signed a partnership agreement with United Way to conduct a pilot program that has since provided ove r 1 ,000 rides for non - emergency medical appointments and other healthcare - related necessities in the Greater Phoenix Metro Area. Rides are available to anyone in the co verage area with demonstrated need and are provided to any qualified healthcare - related destination. The leading use case for these rides has been for travel to and from medical, dental, and eye appointments at 60%, followed by pharmacy - related travel at 15%. • Our Board continues to lead our social and governance efforts. With its diverse composition, our Board is a strong example of inc lus ive leadership. Our Board has been recognized by Women on Boards and our executive team reflects our demographically diverse staff. Governance • The Board has continued to improve our corporate governance structure by adopting an anti - hedging and anti - pledging policy, exec utive equity ownership guidelines, and an incentive compensation recoupment ( clawback ) policy. The Board has also formed a standing ESG committee that will oversee the Company’s environmental, social, governance and resilience efforts. Previously, our Board provided this oversight through an informal ESG working group.
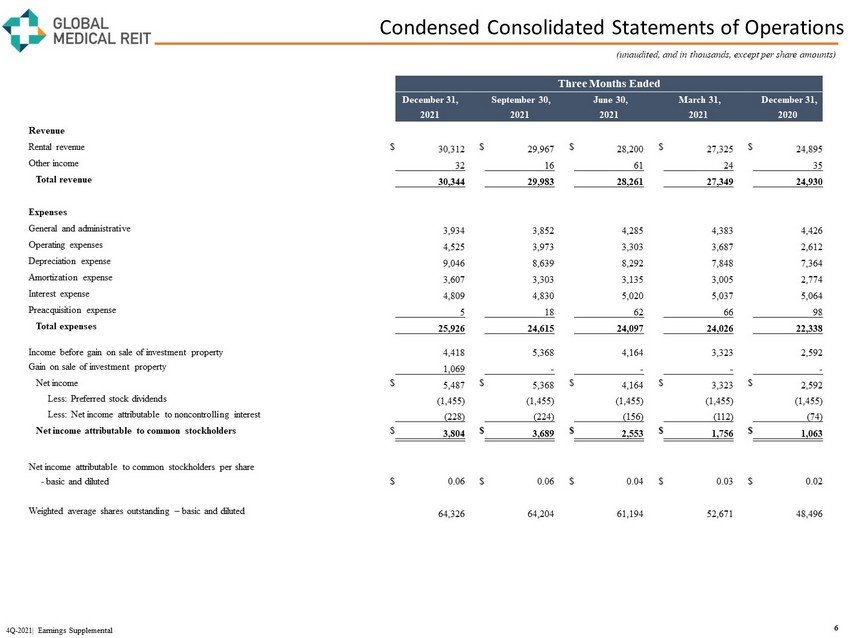
Condensed Consolidated Statements of Operations 6 4Q - 2021| Earnings Supplemental (unaudited, and in thousands, except per share amounts) Three Months Ended December 31, September 30, June 30, March 31, December 31, 2021 2021 2021 2021 2020 Revenue Rental revenue $ 30,312 $ 29,967 $ 28,200 $ 27,325 $ 24,895 Other income 32 16 61 24 35 Total revenue 30,344 29,983 28,261 27,349 24,930 Expenses General and administrative 3,934 3,852 4,285 4,383 4,426 Operating expenses 4,525 3,973 3,303 3,687 2,612 Depreciation expense 9,046 8,639 8,292 7,848 7,364 Amortization expense 3,607 3,303 3,135 3,005 2,774 Interest expense 4,809 4,830 5,020 5,037 5,064 Preacquisition expense 5 18 62 66 98 Total expenses 25,926 24,615 24,097 24,026 22,338 Income before gain on sale of investment property 4,418 5,368 4,164 3,323 2,592 Gain on sale of investment property 1,069 - - - - Net income $ 5,487 $ 5,368 $ 4,164 $ 3,323 $ 2,592 Less: Preferred stock dividends (1,455) (1,455) (1,455) (1,455) (1,455) Less: Net income attributable to noncontrolling interest (228) (224) (156) (112) (74) Net income attributable to common stockholders $ 3,804 $ 3,689 $ 2,553 $ 1,756 $ 1,063 Net income attributable to common stockholders per share - basic and diluted $ 0.06 $ 0.06 $ 0.04 $ 0.03 $ 0.02 Weighted average shares outstanding – basic and diluted 64,326 64,204 61,194 52,671 48,496
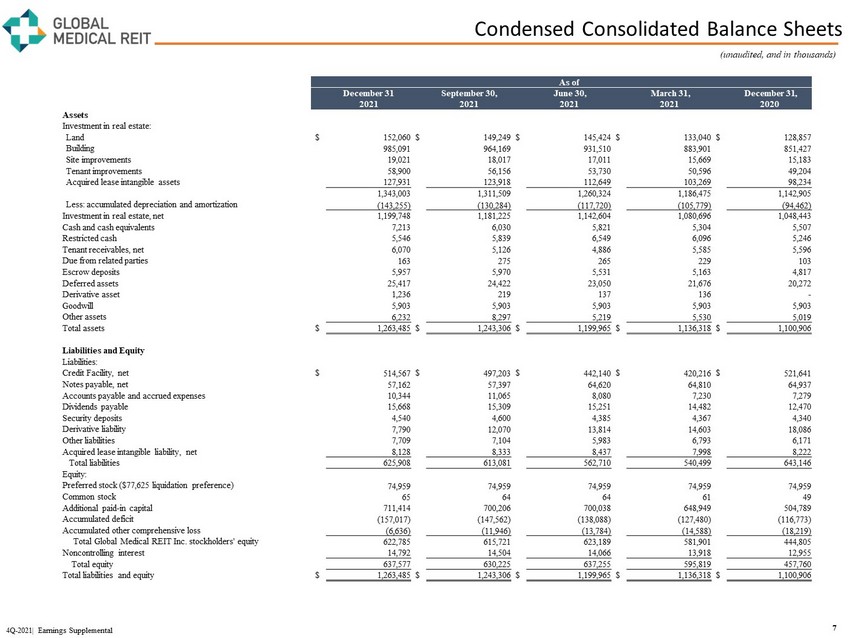
Condensed Consolidated Balance Sheets 7 4Q - 2021| Earnings Supplemental (unaudited, and in thousands) As of December 31 September 30, June 30, March 31, December 31, 2021 2021 2021 2021 2020 Assets Investment in real estate: Land $ 152,060 $ 149,249 $ 145,424 $ 133,040 $ 128,857 Building 985,091 964,169 931,510 883,901 851,427 Site improvements 19,021 18,017 17,011 15,669 15,183 Tenant improvements 58,900 56,156 53,730 50,596 49,204 Acquired lease intangible assets 127,931 123,918 112,649 103,269 98,234 1,343,003 1,311,509 1,260,324 1,186,475 1,142,905 Less: accumulated depreciation and amortization (143,255) (130,284) (117,720) (105,779) (94,462) Investment in real estate, net 1,199,748 1,181,225 1,142,604 1,080,696 1,048,443 Cash and cash equivalents 7,213 6,030 5,821 5,304 5,507 Restricted cash 5,546 5,839 6,549 6,096 5,246 Tenant receivables, net 6,070 5,126 4,886 5,585 5,596 Due from related parties 163 275 265 229 103 Escrow deposits 5,957 5,970 5,531 5,163 4,817 Deferred assets 25,417 24,422 23,050 21,676 20,272 Derivative asset 1,236 219 137 136 - Goodwill 5,903 5,903 5,903 5,903 5,903 Other assets 6,232 8,297 5,219 5,530 5,019 Total assets $ 1,263,485 $ 1,243,306 $ 1,199,965 $ 1,136,318 $ 1,100,906 Liabilities and Equity Liabilities: Credit Facility, net $ 514,567 $ 497,203 $ 442,140 $ 420,216 $ 521,641 Notes payable, net 57,162 57,397 64,620 64,810 64,937 Accounts payable and accrued expenses 10,344 11,065 8,080 7,230 7,279 Dividends payable 15,668 15,309 15,251 14,482 12,470 Security deposits 4,540 4,600 4,385 4,367 4,340 Derivative liability 7,790 12,070 13,814 14,603 18,086 Other liabilities 7,709 7,104 5,983 6,793 6,171 Acquired lease intangible liability, net 8,128 8,333 8,437 7,998 8,222 Total liabilities 625,908 613,081 562,710 540,499 643,146 Equity: Preferred stock ($77,625 liquidation preference) 74,959 74,959 74,959 74,959 74,959 Common stock 65 64 64 61 49 Additional paid - in capital 711,414 700,206 700,038 648,949 504,789 Accumulated deficit (157,017) (147,562) (138,088) (127,480) (116,773) Accumulated other comprehensive loss (6,636) (11,946) (13,784) (14,588) (18,219) Total Global Medical REIT Inc. stockholders' equity 622,785 615,721 623,189 581,901 444,805 Noncontrolling interest 14,792 14,504 14,066 13,918 12,955 Total equity 637,577 630,225 637,255 595,819 457,760 Total liabilities and equity $ 1,263,485 $ 1,243,306 $ 1,199,965 $ 1,136,318 $ 1,100,906
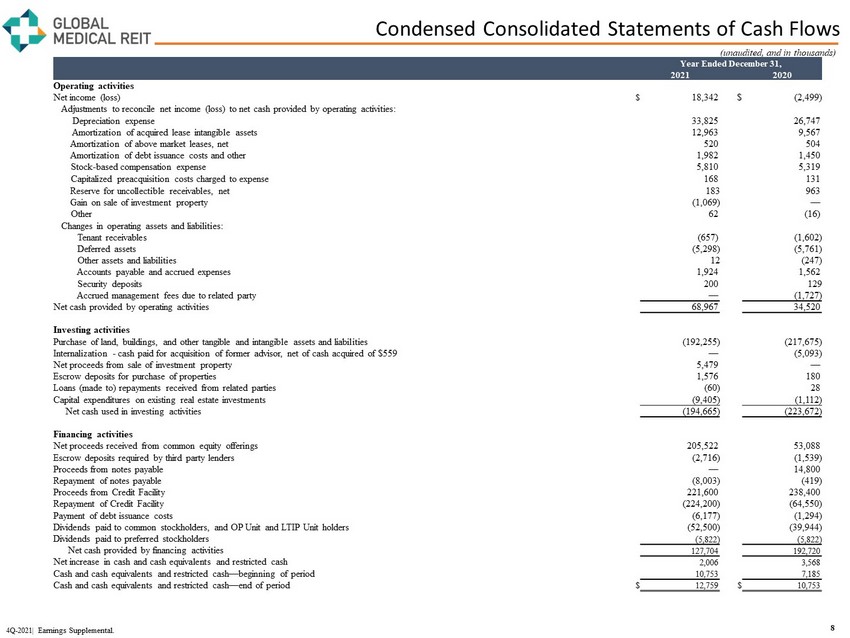
Condensed Consolidated Statements of Cash Flows 8 (unaudited, and in thousands) Year Ended December 31, 2021 2020 Operating activities Net income (loss) $ 18,342 $ (2,499) Adjustments to reconcile net income (loss) to net cash provided by operating activities: Depreciation expense 33,825 26,747 Amortization of acquired lease intangible assets 12,963 9,567 Amortization of above market leases, net 520 504 Amortization of debt issuance costs and other 1,982 1,450 Stock - based compensation expense 5,810 5,319 Capitalized preacquisition costs charged to expense 168 131 Reserve for uncollectible receivables, net 183 963 Gain on sale of investment property (1,069) — Other 62 (16) Changes in operating assets and liabilities: Tenant receivables (657) (1,602) Deferred assets (5,298) (5,761) Other assets and liabilities 12 (247) Accounts payable and accrued expenses 1,924 1,562 Security deposits 200 129 Accrued management fees due to related party — (1,727) Net cash provided by operating activities 68,967 34,520 Investing activities Purchase of land, buildings, and other tangible and intangible assets and liabilities (192,255) (217,675) Internalization - cash paid for acquisition of former advisor, net of cash acquired of $559 — (5,093) Net proceeds from sale of investment property 5,479 — Escrow deposits for purchase of properties 1,576 180 Loans (made to) repayments received from related parties (60) 28 Capital expenditures on existing real estate investments (9,405) (1,112) Net cash used in investing activities (194,665) (223,672) Financing activities Net proceeds received from common equity offerings 205,522 53,088 Escrow deposits required by third party lenders (2,716) (1,539) Proceeds from notes payable — 14,800 Repayment of notes payable (8,003) (419) Proceeds from Credit Facility 221,600 238,400 Repayment of Credit Facility (224,200) (64,550) Payment of debt issuance costs (6,177) (1,294) Dividends paid to common stockholders, and OP Unit and LTIP Unit holders (52,500) (39,944) Dividends paid to preferred stockholders (5,822) (5,822) Net cash provided by financing activities 127,704 192,720 Net increase in cash and cash equivalents and restricted cash 2,006 3,568 Cash and cash equivalents and restricted cash — beginning of period 10,753 7,185 Cash and cash equivalents and restricted cash — end of period $ 12,759 $ 10,753 4Q - 2021| Earnings Supplemental.
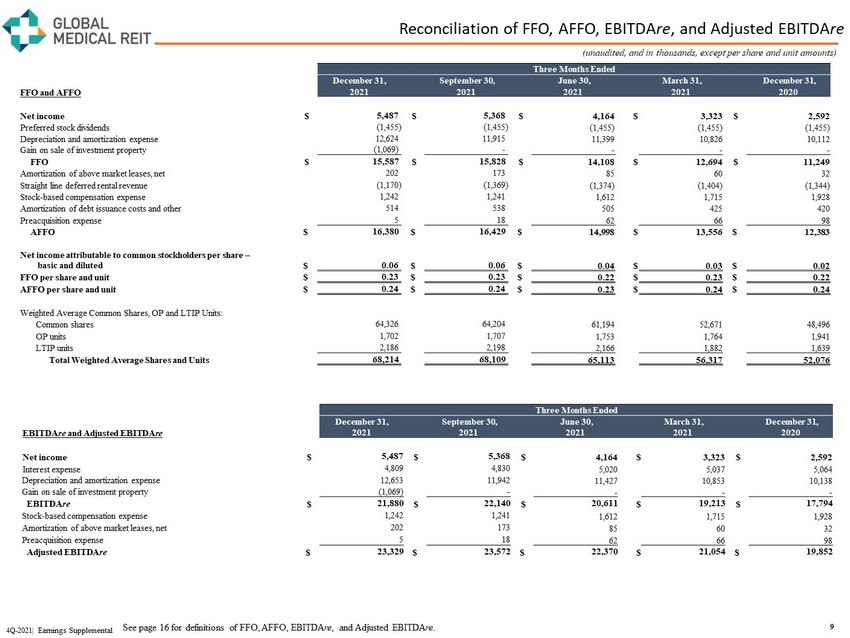
Reconciliation of FFO, AFFO, EBITDA re , and Adjusted EBITDA re 9 4Q - 2021| Earnings Supplemental (unaudited, and in thousands, except per share and unit amounts) Three Months Ended December 31, September 30, June 30, March 31, December 31, FFO and AFFO 2021 2021 2021 2021 2020 Net income $ 5,487 $ 5,368 $ 4,164 $ 3,323 $ 2,592 Preferred stock dividends (1,455) (1,455) (1,455) (1,455) (1,455) Depreciation and amortization expense 12,624 11,915 11,399 10,826 10,112 Gain on sale of investment property (1,069) - - - - FFO $ 15,587 $ 15,828 $ 14,108 $ 12,694 $ 11,249 Amortization of above market leases, net 202 173 85 60 32 Straight line deferred rental revenue (1,170) (1,369) (1,374) (1,404) (1,344) Stock - based compensation expense 1,242 1,241 1,612 1,715 1,928 Amortization of debt issuance costs and other 514 538 505 425 420 Preacquisition expense 5 18 62 66 98 AFFO $ 16,380 $ 16,429 $ 14,998 $ 13,556 $ 12,383 Net income attributable to common stockholders per share – basic and diluted $ 0.06 $ 0.06 $ 0.04 $ 0.03 $ 0.02 FFO per share and unit $ 0.23 $ 0.23 $ 0.22 $ 0.23 $ 0.22 AFFO per share and unit $ 0.24 $ 0.24 $ 0.23 $ 0.24 $ 0.24 Weighted Average Common Shares, OP and LTIP Units: Common shares 64,326 64,204 61,194 52,671 48,496 OP units 1,702 1,707 1,753 1,764 1,941 LTIP units 2,186 2,198 2,166 1,882 1,639 Total Weighted Average Shares and Units 68,214 68,109 65,113 56,317 52,076 Three Months Ended December 31, September 30, June 30, March 31, December 31, EBITDA re and Adjusted EBITDA re 2021 2021 2021 2021 2020 Net income $ 5,487 $ 5,368 $ 4,164 $ 3,323 $ 2,592 Interest expense 4,809 4,830 5,020 5,037 5,064 Depreciation and amortization expense 12,653 11,942 11,427 10,853 10,138 Gain on sale of investment property (1,069) - - - - EBITDA re $ 21,880 $ 22,140 $ 20,611 $ 19,213 $ 17,794 Stock - based compensation expense 1,242 1,241 1,612 1,715 1,928 Amortization of above market leases, net 202 173 85 60 32 Preacquisition expense 5 18 62 66 98 Adjusted EBITDA re $ 23,329 $ 23,572 $ 22,370 $ 21,054 $ 19,852 See page 16 for definitions of FFO, AFFO, EBITDA re , and Adjusted EBITDA re .
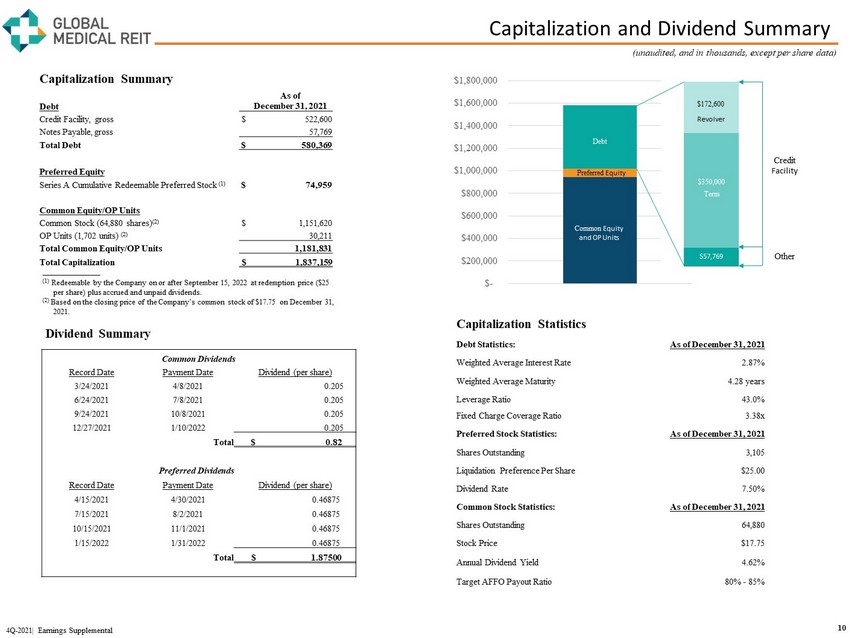
Capitalization and Dividend Summary 10 4Q - 2021| Earnings Supplemental (unaudited, and in thousands, except per share data) (1) Redeemable by the Company on or after September 15, 2022 at redemption price ($25 per share) plus accrued and unpaid dividends. (2) Based on the closing price of the Company’s common stock of $17.75 on December 31, 2021. $- $200,000 $400,000 $600,000 $800,000 $1,000,000 $1,200,000 $1,400,000 $1,600,000 $1,800,000 Debt Preferred Equity Common Equity and OP Units $57,769 $350,000 $172,600 Revolver Term Credit Facility Other Capitalization Summary Debt As of December 31, 2021 Credit Facility, gross $ 522,600 Notes Payable, gross 57,769 Total Debt $ 580,369 Preferred Equity Series A Cumulative Redeemable Preferred Stock (1) $ 74,959 Common Equity/OP Units Common Stock (64,880 shares) (2) $ 1,151,620 OP Units (1,702 units) (2) 30,211 Total Common Equity/OP Units 1,181,831 Total Capitalization $ 1,837,159 Capitalization Statistics Debt Statistics: As of December 31, 2021 Weighted Average Interest Rate 2.87% Weighted Average Maturity 4.28 years Leverage Ratio 43.0% Fixed Charge Coverage Ratio 3.38x Preferred Stock Statistics: As of December 31, 2021 Shares Outstanding 3,105 Liquidation Preference Per Share $25.00 Dividend Rate 7.50% Common Stock Statistics: As of December 31, 2021 Shares Outstanding 64,880 Stock Price $17.75 Annual Dividend Yield 4.62% Target AFFO Payout Ratio 80% - 85% Dividend Summary Common Dividends Record Date Payment Date Dividend (per share) 3/24/2021 4/8/2021 0.205 6/24/2021 7/8/2021 0.205 9/24/2021 10/8/2021 0.205 12/27/2021 1/10/2022 0.205 Total $ 0.82 Preferred Dividends Record Date Payment Date Dividend (per share) 4/15/2021 4/30/2021 0.46875 7/15/2021 8/2/2021 0.46875 10/15/2021 11/1/2021 0.46875 1/15/2022 1/31/2022 0.46875 Total $ 1.87500
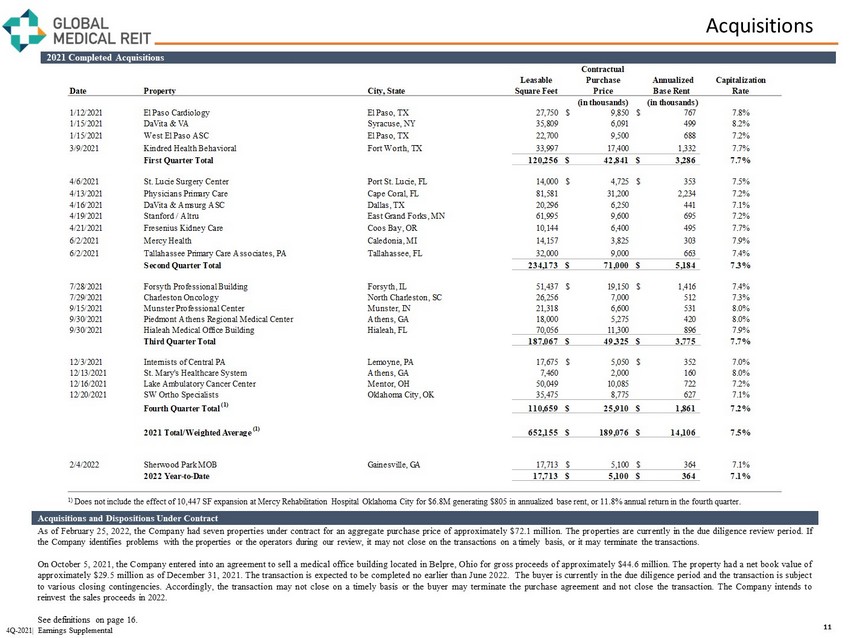
Contractual Leasable Purchase Annualized Capitalization Date Property City, State Square Feet Price Base Rent Rate (in thousands) (in thousands) 1/12/2021 El Paso Cardiology El Paso, TX 27,750 $ 9,850 $ 767 7.8% 1/15/2021 DaVita & VA Syracuse, NY 35,809 6,091 499 8.2% 1/15/2021 West El Paso ASC El Paso, TX 22,700 9,500 688 7.2% 3/9/2021 Kindred Health Behavioral Fort Worth, TX 33,997 17,400 1,332 7.7% First Quarter Total 120,256 $ 42,841 $ 3,286 7.7% 4/6/2021 St. Lucie Surgery Center Port St. Lucie, FL 14,000 $ 4,725 $ 353 7.5% 4/13/2021 Physicians Primary Care Cape Coral, FL 81,581 31,200 2,234 7.2% 4/16/2021 DaVita & Amsurg ASC Dallas, TX 20,296 6,250 441 7.1% 4/19/2021 Stanford / Altru East Grand Forks, MN 61,995 9,600 695 7.2% 4/21/2021 Fresenius Kidney Care Coos Bay, OR 10,144 6,400 495 7.7% 6/2/2021 Mercy Health Caledonia, MI 14,157 3,825 303 7.9% 6/2/2021 Tallahassee Primary Care Associates, PA Tallahassee, FL 32,000 9,000 663 7.4% Second Quarter Total 234,173 $ 71,000 $ 5,184 7.3% 7/28/2021 Forsyth Professional Building Forsyth, IL 51,437 $ 19,150 $ 1,416 7.4% 7/29/2021 Charleston Oncology North Charleston, SC 26,256 7,000 512 7.3% 9/15/2021 Munster Professional Center Munster, IN 21,318 6,600 531 8.0% 9/30/2021 Piedmont Athens Regional Medical Center Athens, GA 18,000 5,275 420 8.0% 9/30/2021 Hialeah Medical Office Building Hialeah, FL 70,056 11,300 896 7.9% Third Quarter Total 187,067 $ 49,325 $ 3,775 7.7% 12/3/2021 Internists of Central PA Lemoyne, PA 17,675 $ 5,050 $ 352 7.0% 12/13/2021 St. Mary's Healthcare System Athens, GA 7,460 2,000 160 8.0% 12/16/2021 Lake Ambulatory Cancer Center Mentor, OH 50,049 10,085 722 7.2% 12/20/2021 SW Ortho Specialists Oklahoma City, OK 35,475 8,775 627 7.1% Fourth Quarter Total (1) 110,659 $ 25,910 $ 1,861 7.2% 2021 Total/Weighted Average (1) 652,155 $ 189,076 $ 14,106 7.5% 2/4/2022 Sherwood Park MOB Gainesville, GA 17,713 $ 5,100 $ 364 7.1% 2022 Year-to-Date 17,713 $ 5,100 $ 364 7.1% Acquisitions 11 2021 Completed Acquisitions Acquisitions and Dispositions Under Contract As of February 25 , 2022 , the Company had seven properties under contract for an aggregate purchase price of approximately $ 72 . 1 million . The properties are currently in the due diligence review period . If the Company identifies problems with the properties or the operators during our review, it may not close on the transactions on a timely basis, or it may terminate the transactions . On October 5 , 2021 , the Company entered into an agreement to sell a medical office building located in Belpre, Ohio for gross proceeds of approximately $ 44 . 6 million . The property had a net book value of approximately $ 29 . 5 million as of December 31 , 2021 . The transaction is expected to be completed no earlier than June 2022 . The buyer is currently in the due diligence period and the transaction is subject to various closing contingencies . Accordingly, the transaction may not close on a timely basis or the buyer may terminate the purchase agreement and not close the transaction . The Company intends to reinvest the sales proceeds in 2022 . See definitions on page 16 . 4Q - 2021| Earnings Supplemental 1) Does not include the effect of 10,447 SF expansion at Mercy Rehabilitation Hospital Oklahoma City for $6.8M generating $805 i n annualized base rent, or 11.8% annual return in the fourth quarter.
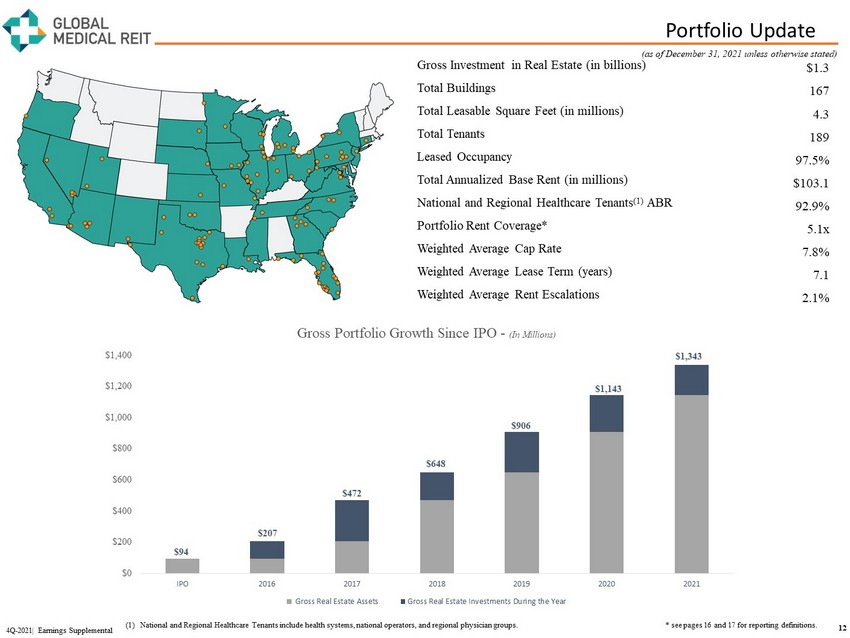
Portfolio Update 12 Gross Investment in Real Estate (in billions) $1.3 Total Buildings 167 Total Leasable Square Feet (in millions) 4.3 Total Tenants 189 Leased Occupancy 97.5% Total Annualized Base Rent (in millions) $103.1 National and Regional Healthcare Tenants (1) ABR 92.9% Portfolio Rent Coverage* 5.1x Weighted Average Cap Rate 7.8% Weighted Average Lease Term (years) 7.1 Weighted Average Rent Escalations 2.1% (as of December 31, 2021 unless otherwise stated) 4Q - 2021| Earnings Supplemental (1) National and Regional Healthcare Tenants include health systems, national operators, and regional physician groups. * see pages 16 and 17 for reporting definitions. $94 $207 $472 $648 $906 $1,143 $1,343 $0 $200 $400 $600 $800 $1,000 $1,200 $1,400 IPO 2016 2017 2018 2019 2020 2021 Gross Portfolio Growth Since IPO - (In Millions) Gross Real Estate Assets Gross Real Estate Investments During the Year
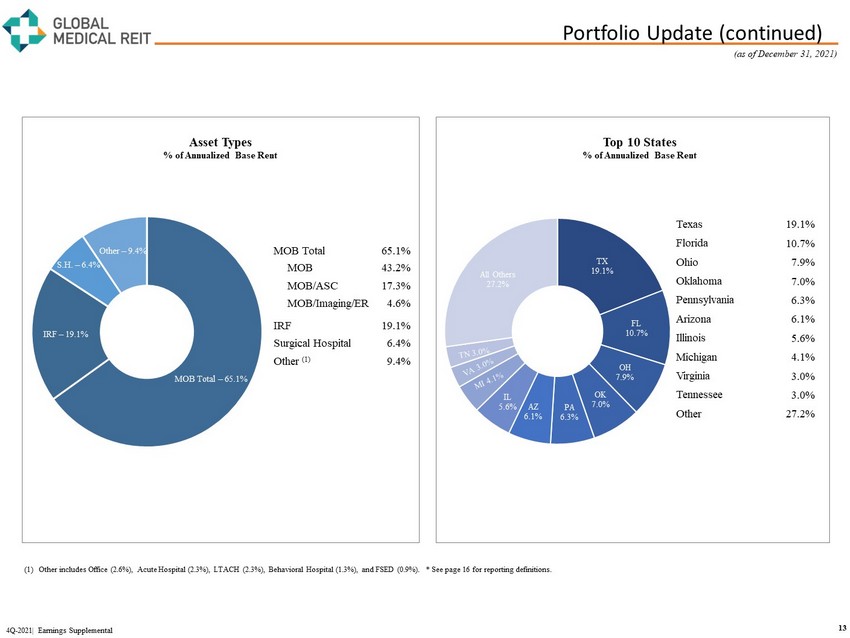
Portfolio Update (continued) 13 4Q - 2021| Earnings Supplemental (1) Other includes Office (2.6%), Acute Hospital (2.3%), LTACH (2.3%), Behavioral Hospital (1.3%), and FSED (0.9%). * See page 1 6 f or reporting definitions. MOB Total – 65.1% IRF – 19.1% S.H. – 6.4% Other – 9.4% Texas 19.1% Florida 10.7% Ohio 7.9% Oklahoma 7.0% Pennsylvania 6.3% Arizona 6.1% Illinois 5.6% Michigan 4.1% Virginia 3.0% Tennessee 3.0% Other 27.2% TX 19.1% FL 10.7% OH 7.9% OK 7.0% PA 6.3% AZ 6.1% IL 5.6% All Others 27.2% Top 10 States % of Annualized Base Rent Asset Types % of Annualized Base Rent (as of December 31, 2021) MOB Total 65.1% MOB 43.2% MOB/ASC 17.3% MOB/Imaging/ER 4.6% IRF 19.1% Surgical Hospital 6.4% Other (1) 9.4%
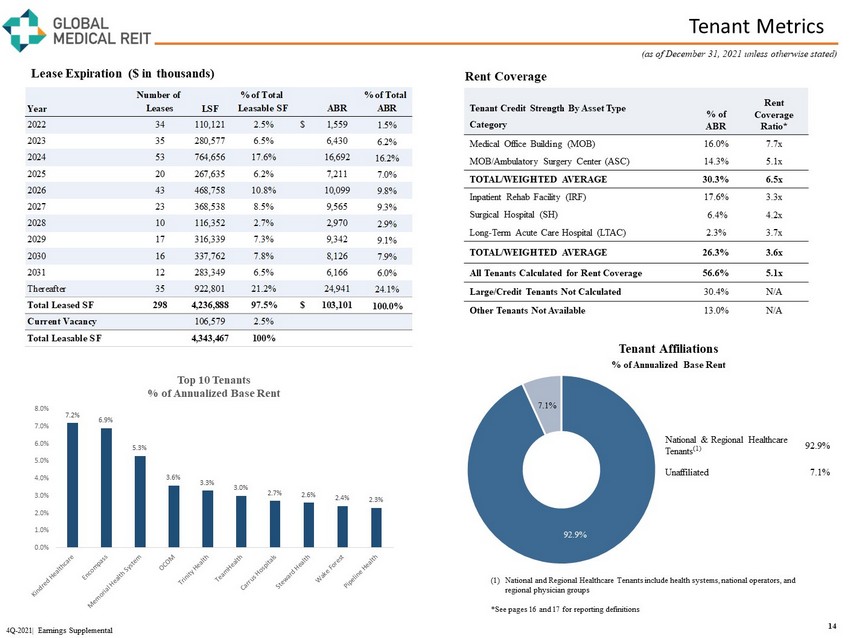
Tenant Metrics 14 4Q - 2021| Earnings Supplemental (as of December 31, 2021 unless otherwise stated) Tenant Credit Strength By Asset Type Category % of ABR Rent Coverage Ratio* Medical Office Building (MOB) 16.0% 7.7x MOB/Ambulatory Surgery Center (ASC) 14.3% 5.1x TOTAL/WEIGHTED AVERAGE 30.3% 6.5x Inpatient Rehab Facility (IRF) 17.6% 3.3x Surgical Hospital (SH) 6.4% 4.2x Long - Term Acute Care Hospital (LTAC) 2.3% 3.7x TOTAL/WEIGHTED AVERAGE 26.3% 3.6x All Tenants Calculated for Rent Coverage 56.6% 5.1x Large/Credit Tenants Not Calculated 30.4% N/A Other Tenants Not Available 13.0% N/A Lease Expiration ($ in thousands) Rent Coverage 92.9% 7.1% National & Regional Healthcare Tenants (1) 92.9% Unaffiliated 7.1% Tenant Affiliations % of Annualized Base Rent (1) National and Regional Healthcare Tenants include health systems, national operators, and regional physician groups *See pages 16 and 17 for reporting definitions 7.2% 6.9% 5.3% 3.6% 3.3% 3.0% 2.7% 2.6% 2.4% 2.3% 0.0% 1.0% 2.0% 3.0% 4.0% 5.0% 6.0% 7.0% 8.0% Top 10 Tenants % of Annualized Base Rent Year Number of Leases LSF % of Total Leasable SF ABR % of Total ABR 2022 34 110,121 2.5% $ 1,559 1.5% 2023 35 280,577 6.5% 6,430 6.2% 2024 53 764,656 17.6% 16,692 16.2% 2025 20 267,635 6.2% 7,211 7.0% 2026 43 468,758 10.8% 10,099 9.8% 2027 23 368,538 8.5% 9,565 9.3% 2028 10 116,352 2.7% 2,970 2.9% 2029 17 316,339 7.3% 9,342 9.1% 2030 16 337,762 7.8% 8,126 7.9% 2031 12 283,349 6.5% 6,166 6.0% Thereafter 35 922,801 21.2% 24,941 24.1% Total Leased SF 298 4,236,888 97.5% $ 103,101 100.0% Current Vacancy 106,579 2.5% Total Leasable SF 4,343,467 100%
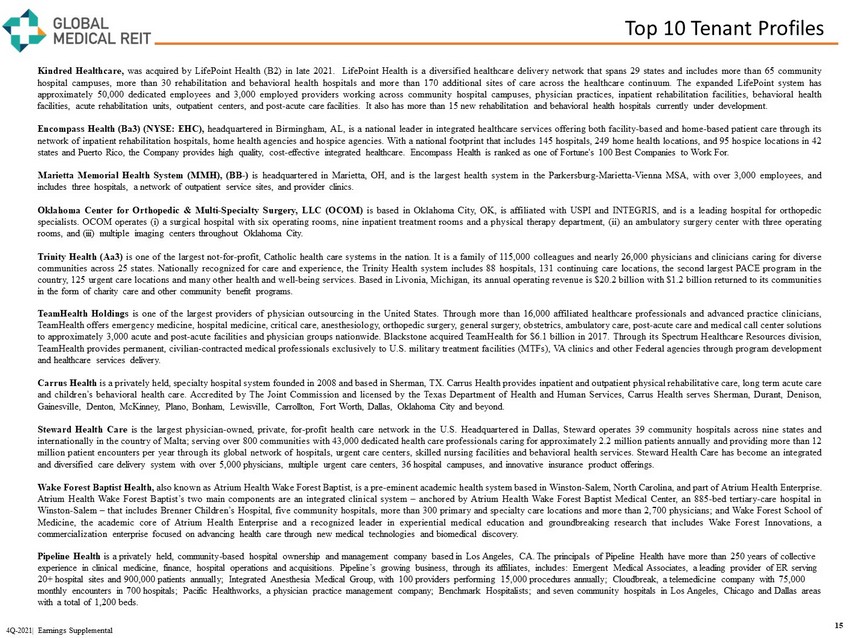
Top 10 Tenant Profiles 15 4Q - 2021| Earnings Supplemental Kindred Healthcare, was acquired by LifePoint Health (B 2 ) in late 2021 . LifePoint Health is a diversified healthcare delivery network that spans 29 states and includes more than 65 community hospital campuses, more than 30 rehabilitation and behavioral health hospitals and more than 170 additional sites of care across the healthcare continuum . The expanded LifePoint system has approximately 50 , 000 dedicated employees and 3 , 000 employed providers working across community hospital campuses, physician practices, inpatient rehabilitation facilities, behavioral health facilities, acute rehabilitation units, outpatient centers, and post - acute care facilities . It also has more than 15 new rehabilitation and behavioral health hospitals currently under development . Encompass Health (Ba 3 ) (NYSE : EHC), headquartered in Birmingham, AL, is a national leader in integrated healthcare services offering both facility - based and home - based patient care through its network of inpatient rehabilitation hospitals, home health agencies and hospice agencies . With a national footprint that includes 145 hospitals, 249 home health locations, and 95 hospice locations in 42 states and Puerto Rico, the Company provides high quality, cost - effective integrated healthcare . Encompass Health is ranked as one of Fortune's 100 Best Companies to Work For . Marietta Memorial Health System (MMH), (BB - ) is headquartered in Marietta, OH, and is the largest health system in the Parkersburg - Marietta - Vienna MSA, with over 3 , 000 employees, and includes three hospitals, a network of outpatient service sites, and provider clinics . Oklahoma Center for Orthopedic & Multi - Specialty Surgery, LLC (OCOM) is based in Oklahoma City, OK, is affiliated with USPI and INTEGRIS, and is a leading hospital for orthopedic specialists . OCOM operates ( i ) a surgical hospital with six operating rooms, nine inpatient treatment rooms and a physical therapy department, (ii) an ambulatory surgery center with three operating rooms, and (iii) multiple imaging centers throughout Oklahoma City . Trinity Health (Aa 3 ) is one of the largest not - for - profit, Catholic health care systems in the nation . It is a family of 115 , 000 colleagues and nearly 26 , 000 physicians and clinicians caring for diverse communities across 25 states . Nationally recognized for care and experience, the Trinity Health system includes 88 hospitals, 131 continuing care locations, the second largest PACE program in the country, 125 urgent care locations and many other health and well - being services . Based in Livonia, Michigan, its annual operating revenue is $ 20 . 2 billion with $ 1 . 2 billion returned to its communities in the form of charity care and other community benefit programs . TeamHealth Holdings is one of the largest providers of physician outsourcing in the United States . Through more than 16 , 000 affiliated healthcare professionals and advanced practice clinicians, TeamHealth offers emergency medicine, hospital medicine, critical care, anesthesiology, orthopedic surgery, general surgery, obstetrics, ambulatory care, post - acute care and medical call center solutions to approximately 3 , 000 acute and post - acute facilities and physician groups nationwide . Blackstone acquired TeamHealth for $ 6 . 1 billion in 2017 . Through its Spectrum Healthcare Resources division, TeamHealth provides permanent, civilian - contracted medical professionals exclusively to U . S . military treatment facilities (MTFs), VA clinics and other Federal agencies through program development and healthcare services delivery . Carrus Health is a privately held, specialty hospital system founded in 2008 and based in Sherman, TX . Carrus Health provides inpatient and outpatient physical rehabilitative care, long term acute care and children’s behavioral health care . Accredited by The Joint Commission and licensed by the Texas Department of Health and Human Services, Carrus Health serves Sherman, Durant, Denison, Gainesville, Denton, McKinney, Plano, Bonham, Lewisville, Carrollton, Fort Worth, Dallas, Oklahoma City and beyond . Steward Health Care is the largest physician - owned, private, for - profit health care network in the U . S . Headquartered in Dallas, Steward operates 39 community hospitals across nine states and internationally in the country of Malta ; serving over 800 communities with 43 , 000 dedicated health care professionals caring for approximately 2 . 2 million patients annually and providing more than 12 million patient encounters per year through its global network of hospitals, urgent care centers, skilled nursing facilities and behavioral health services . Steward Health Care has become an integrated and diversified care delivery system with over 5 , 000 physicians, multiple urgent care centers, 36 hospital campuses, and innovative insurance product offerings . Wake Forest Baptist Health, also known as Atrium Health Wake Forest Baptist, is a pre - eminent academic health system based in Winston - Salem, North Carolina, and part of Atrium Health Enterprise . Atrium Health Wake Forest Baptist’s two main components are an integrated clinical system – anchored by Atrium Health Wake Forest Baptist Medical Center, an 885 - bed tertiary - care hospital in Winston - Salem – that includes Brenner Children’s Hospital, five community hospitals, more than 300 primary and specialty care locations and more than 2 , 700 physicians ; and Wake Forest School of Medicine, the academic core of Atrium Health Enterprise and a recognized leader in experiential medical education and groundbreaking research that includes Wake Forest Innovations, a commercialization enterprise focused on advancing health care through new medical technologies and biomedical discovery . Pipeline Health is a privately held, community-based hospital ownership and management company based in Los Angeles, CA. The principals of Pi pe line Health have more than 250 years of collective experience in clinical medicine, finance, hospital operations and acquisitions. Pipeline’s growing business, through its affi lia tes, includes: Emergent Medical Associates, a leading provider of ER serving 20+ hospital sites and 900,000 patients annually; Integrated Anesthesia Medical Group, with 100 providers performing 15,000 p roc edures annually; Cloudbreak , a telemedicine company with 75,000 monthly encounters in 700 hospitals; Pacific Healthworks, a physician practice management company; Benchmark Hospitalists; an d s even community hospitals in Los Angeles, Chicago and Dallas areas with a total of 1,200 beds.
Reporting Definitions and Other Disclosures Reporting Definitions Annualized Base Rent Annualized base rent represents monthly base rent for most recent month or month of acquisition, multiplied by 12 (or actual NOI where more reflective of property performance) . Accordingly, this methodology produces an annualized amount as of a point in time but does not take into account future contractual rental rate increases . Additionally, properties that are accounted for on a cash - collected basis are not included annualized base rent . Capitalization Rate The capitalization rate (“Cap Rate”) for an acquisition is calculated by dividing current Annualized Base Rent by contractual purchase price . For the portfolio capitalization rate, certain adjustments, including for subsequent capital invested, are made to the contractual purchase price . Earnings Before Interest, Taxes, Depreciation and Amortization for Real Estate ( EBITDA re and Adjusted EBITDA re ) We calculate EBITDA re in accordance with standards established by NAREIT and define EBITDA re as net income or loss computed in accordance with GAAP plus depreciation and amortization, interest expense, gain or loss on the sale of investment properties, and impairment loss, as applicable . We define Adjusted EBITDA re as EBITDA re plus non - cash stock compensation expense, non - cash intangible amortization related to above and below market leases, preacquisition expense and other normalizing items . Management considers EBITDA re and Adjusted EBITDA re important measures because they provide additional information to allow management, investors, and our current and potential creditors to evaluate and compare our core operating results and our ability to service debt . Funds from Operations and Adjusted Funds from Operations Funds from operations (“FFO”) and adjusted funds from operations (“AFFO”) are non - GAAP financial measures within the meaning of the rules of the SEC . The Company considers FFO and AFFO to be important supplemental measures of its operating performance and believes FFO is frequently used by securities analysts, investors, and other interested parties in the evaluation of REITs, many of which present FFO when reporting their results . In accordance with the National Association of Real Estate Investment Trusts’ (“NAREIT”) definition, FFO means net income or loss computed in accordance with GAAP before noncontrolling interests of holders of OP units and LTIP units, excluding gains (or losses) from sales of property and extraordinary items, less preferred stock dividends, plus real estate - related depreciation and amortization (excluding amortization of debt issuance costs and the amortization of above and below market leases), and after adjustments for unconsolidated partnerships and joint ventures . Because FFO excludes real estate - related depreciation and amortization (other than amortization of debt issuance costs and above and below market lease amortization expense), the Company believes that FFO provides a performance measure that, when compared period - over - period, reflects the impact to operations from trends in occupancy rates, rental rates, operating costs, development activities and interest expense, providing perspective not immediately apparent from the closest GAAP measurement, net income or loss . AFFO is a non - GAAP measure used by many investors and analysts to measure a real estate company’s operating performance by removing the effect of items that do not reflect ongoing property operations . Management calculates AFFO by modifying the NAREIT computation of FFO by adjusting it for certain cash and non - cash items and certain recurring and non - recurring items . For the Company these items include recurring acquisition and disposition costs, loss on the extinguishment of debt, recurring straight line deferred rental revenue, recurring stock - based compensation expense, recurring amortization of above and below market leases, recurring amortization of debt issuance costs, recurring lease commissions, management internalization costs, and other items . Management believes that reporting AFFO in addition to FFO is a useful supplemental measure for the investment community to use when evaluating the operating performance of the Company on a comparative basis . 16 (as of December 31, 2021) 4Q - 2021| Earnings Supplemental
Reporting Definitions and Other Disclosures Reporting Definitions (continued) Rent Coverage Ratio For purposes of calculating our portfolio weighted - average EBITDARM coverage ratio (“Rent Coverage Ratio”), we excluded credit - rated tenants or their subsidiaries for which financial statements were either not available or not sufficiently detailed . These ratios are based on latest available information only . Most tenant financial statements are unaudited and we have not independently verified any tenant financial information (audited or unaudited) and, therefore, we cannot assure you that such information is accurate or complete . Certain other tenants (approximately 13 % of our portfolio) are excluded from the calculation due to (i) lack of available financial information or (ii) receipt of significant COVID - 19 relief funds that may cause reported coverage to differ materially from underlying performance . Additionally, our Rent Coverage Ratio adds back physician distributions and compensation . Management believes all adjustments are reasonable and necessary . Other Disclosures Non - GAAP Financial Measures Management considers certain non - GAAP financial measures to be useful supplemental measures of the Company's operating performance . For the Company, non - GAAP measures consist of EBITDA re , Adjusted EBITDA re , FFO and AFFO . A non - GAAP financial measure is generally defined as one that purports to measure financial performance, financial position or cash flows, but excludes or includes amounts that would not be so adjusted in the most comparable measure determined in accordance with GAAP . The Company reports non - GAAP financial measures because these measures are observed by management to also be among the most predominant measures used by the REIT industry and by industry analysts to evaluate REITs . For these reasons, management deems it appropriate to disclose and discuss these non - GAAP financial measures . The non - GAAP financial measures presented herein are not necessarily identical to those presented by other real estate companies due to the fact that not all real estate companies use the same definitions . These measures should not be considered as alternatives to net income, as indicators of the Company's financial performance, or as alternatives to cash flow from operating activities as measures of the Company's liquidity, nor are these measures necessarily indicative of sufficient cash flow to fund all of the Company's needs . Management believes that in order to facilitate a clear understanding of the Company's historical consolidated operating results, these measures should be examined in conjunction with net income and cash flows from operations as presented elsewhere herein . Forward - Looking Statements Certain statements contained herein may be considered “forward - looking statements” within the meaning of the Private Securities Litigation Reform Act of 1995 , and it is the Company’s intent that any such statements be protected by the safe harbor created thereby . These forward - looking statements are identified by their use of terms and phrases such as "anticipate," "believe," "could," "estimate," "expect," "intend," "may," "should," "plan," "predict," "project," "will," "continue" and other similar terms and phrases, including references to assumptions and forecasts of future results . Except for historical information, the statements set forth herein including, but not limited to, any statements regarding our earnings, our tenants’ ability to pay rent to us, expected financial performance (including future cash flows associated with new tenants or the expansion of current properties), future dividends or other financial items ; any other statements concerning our plans, strategies, objectives and expectations for future operations, our pipeline of acquisition opportunities and expected acquisition activity, including the timing and/or successful completion of any acquisitions and expected rent receipts on these properties, our expected disposition activity, including the timing and/or successful completion of any dispositions and the expected use of proceeds therefrom, and any statements regarding future economic conditions or performance are forward - looking statements . These forward - looking statements are based on our current expectations, estimates and assumptions and are subject to certain risks and uncertainties . Although the Company believes that the expectations, estimates and assumptions reflected in its forward - looking statements are reasonable, actual results could differ materially from those projected or assumed in any of the Company’s forward - looking statements . Additional information concerning us and our business, including additional factors that could materially and adversely affect our financial results, include, without limitation, the risks described under Part I, Item 1 A - Risk Factors, in our Annual Report on Form 10 - K, our Quarterly Reports on Form 10 - Q, and in our other filings with the SEC . You are cautioned not to place undue reliance on forward - looking statements . The Company does not intend, and undertakes no obligation, to update any forward - looking statement . Additional Information The information in this document should be read in conjunction with the Company’s Annual Report on Form 10 - K, Quarterly Reports on Form 10 - Q, Current Reports on Form 8 - K, and other information filed with, or furnished to, the SEC . You can access the Company’s reports and amendments to those reports filed or furnished to the SEC pursuant to Section 13 (a) or 15 (d) of the Exchange Act in the “Investor Relations” section on the Company’s website (www . globalmedicalreit . com) under “SEC Filings” as soon as reasonably practicable after they are filed with, or furnished to, the SEC . The information on or connected to the Company’s website is not, and shall not be deemed to be, a part of, or incorporated into, this Earnings Supplemental . You also can review these SEC filings and other information by accessing the SEC’s website at http : //www . sec . gov . Certain information contained in this package, including, but not limited to, information contained in our Top 10 tenant profiles is derived from publicly - available third - party sources . The Company has not independently verified this information and there can be no assurance that such information is accurate or complete . 17 (as of December 31, 2021) 4Q - 2021| Earnings Supplemental
Stephen Swett stephen.swett@icrinc.com 203.682.8377 www.globalmedicalreit.com NYSE: GMRE INVESTOR RELATIONS