Exhibit 99.2
Second Quarter 2022 Earnings Supplemental Three and Six Months Ended June 30, 2022 www.globalmedicalreit.com NYSE: GMRE
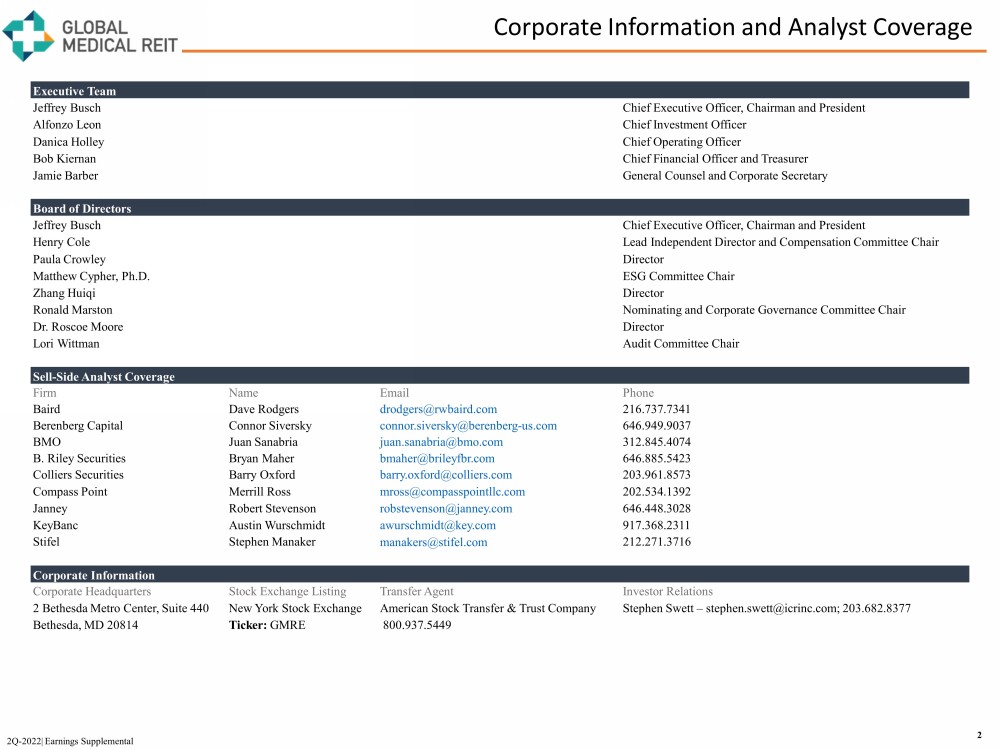
Corporate Information and Analyst Coverage 2 2Q - 2022| Earnings Supplemental Executive Team Jeffrey Busch Chief Executive Officer, Chairman and President Alfonzo Leon Chief Investment Officer Danica Holley Chief Operating Officer Bob Kiernan Chief Financial Officer and Treasurer Jamie Barber General Counsel and Corporate Secretary Board of Directors Jeffrey Busch Chief Executive Officer, Chairman and President Henry Cole Lead Independent Director and Compensation Committee Chair Paula Crowley Director Matthew Cypher, Ph.D. ESG Committee Chair Zhang Huiqi Director Ronald Marston Nominating and Corporate Governance Committee Chair Dr. Roscoe Moore Director Lori Wittman Audit Committee Chair Sell - Side Analyst Coverage Firm Name Email Phone Baird Dave Rodgers drodgers@rwbaird.com 216.737.7341 Berenberg Capital Connor Siversky connor.siversky@berenberg - us.com 646.949.9037 BMO Juan Sanabria juan.sanabria@bmo.com 312.845.4074 B. Riley Securities Bryan Maher bmaher@brileyfbr.com 646.885.5423 Colliers Securities Barry Oxford barry.oxford@colliers.com 203.961.8573 Compass Point Merrill Ross mross@compasspointllc.com 202.534.1392 Janney Robert Stevenson robstevenson@janney.com 646.448.3028 KeyBanc Austin Wurschmidt awurschmidt @key.com 917.368.2311 Stifel Stephen Manaker manakers@stifel.com 212.271.3716 Corporate Information Corporate Headquarters Stock Exchange Listing Transfer Agent Investor Relations 2 Bethesda Metro Center, Suite 440 New York Stock Exchange American Stock Transfer & Trust Company Stephen Swett – stephen.swett@icrinc.com; 203.682.8377 Bethesda, MD 20814 Ticker: GMRE 800.937.5449
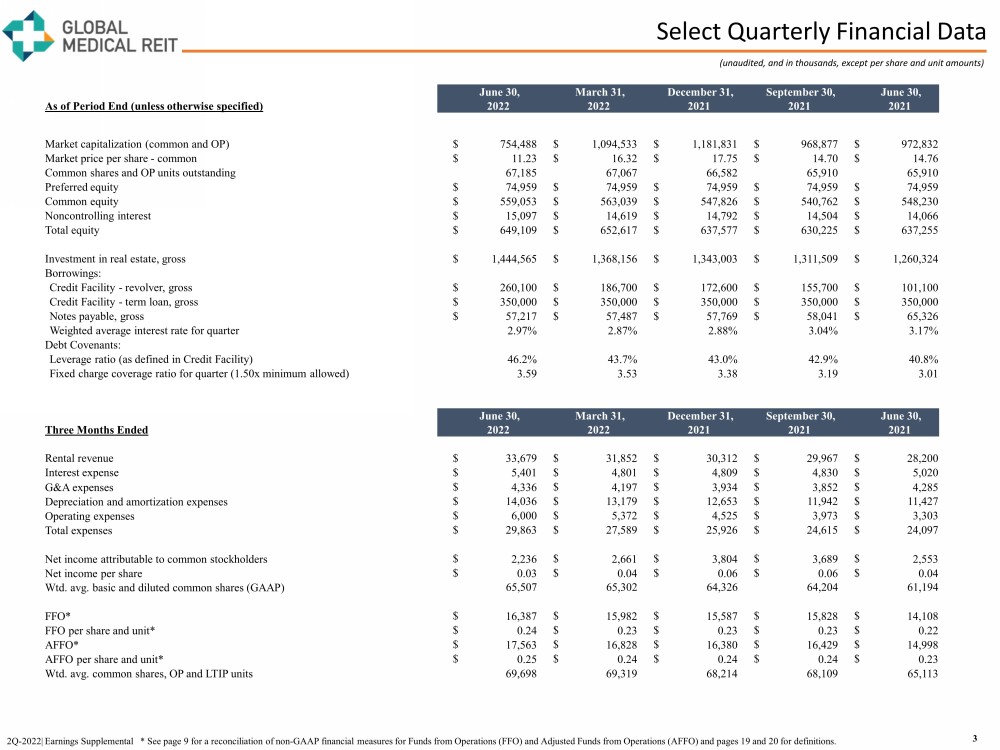
Select Quarterly Financial Data (unaudited, and in thousands, except per share and unit amounts) 3 2Q - 2022| Earnings Supplemental * See page 9 for a reconciliation of non - GAAP financial measures for Funds from Operations (FFO ) and Adjusted Funds from Operations (AFFO) and pages 19 and 20 for definitions. June 30, March 31, December 31, September 30, June 30, As of Period End (unless otherwise specified) 2022 2022 2021 2021 2021 Market capitalization (common and OP) $ 754,488 $ 1,094,533 $ 1,181,831 $ 968,877 $ 972,832 Market price per share - common $ 11.23 $ 16.32 $ 17.75 $ 14.70 $ 14.76 Common shares and OP units outstanding 67,185 67,067 66,582 65,910 65,910 Preferred equity $ 74,959 $ 74,959 $ 74,959 $ 74,959 $ 74,959 Common equity $ 559,053 $ 563,039 $ 547,826 $ 540,762 $ 548,230 Noncontrolling interest $ 15,097 $ 14,619 $ 14,792 $ 14,504 $ 14,066 Total equity $ 649,109 $ 652,617 $ 637,577 $ 630,225 $ 637,255 Investment in real estate, gross $ 1,444,565 $ 1,368,156 $ 1,343,003 $ 1,311,509 $ 1,260,324 Borrowings: Credit Facility - revolver, gross $ 260,100 $ 186,700 $ 172,600 $ 155,700 $ 101,100 Credit Facility - term loan, gross $ 350,000 $ 350,000 $ 350,000 $ 350,000 $ 350,000 Notes payable, gross $ 57,217 $ 57,487 $ 57,769 $ 58,041 $ 65,326 Weighted average interest rate for quarter 2.97% 2.87% 2.88% 3.04% 3.17% Debt Covenants: Leverage ratio (as defined in Credit Facility) 46.2% 43.7% 43.0% 42.9% 40.8% Fixed charge coverage ratio for quarter (1.50x minimum allowed) 3.59 3.53 3.38 3.19 3.01 June 30, March 31, December 31, September 30, June 30, Three Months Ended 2022 2022 2021 2021 2021 Rental revenue $ 33,679 $ 31,852 $ 30,312 $ 29,967 $ 28,200 Interest expense $ 5,401 $ 4,801 $ 4,809 $ 4,830 $ 5,020 G&A expenses $ 4,336 $ 4,197 $ 3,934 $ 3,852 $ 4,285 Depreciation and amortization expenses $ 14,036 $ 13,179 $ 12,653 $ 11,942 $ 11,427 Operating expenses $ 6,000 $ 5,372 $ 4,525 $ 3,973 $ 3,303 Total expenses $ 29,863 $ 27,589 $ 25,926 $ 24,615 $ 24,097 Net income attributable to common stockholders $ 2,236 $ 2,661 $ 3,804 $ 3,689 $ 2,553 Net income per share $ 0.03 $ 0.04 $ 0.06 $ 0.06 $ 0.04 Wtd. avg. basic and diluted common shares (GAAP) 65,507 65,302 64,326 64,204 61,194 FFO* $ 16,387 $ 15,982 $ 15,587 $ 15,828 $ 14,108 FFO per share and unit* $ 0.24 $ 0.23 $ 0.23 $ 0.23 $ 0.22 AFFO* $ 17,563 $ 16,828 $ 16,380 $ 16,429 $ 14,998 AFFO per share and unit* $ 0.25 $ 0.24 $ 0.24 $ 0.24 $ 0.23 Wtd. avg. common shares, OP and LTIP units 69,698 69,319 68,214 68,109 65,113
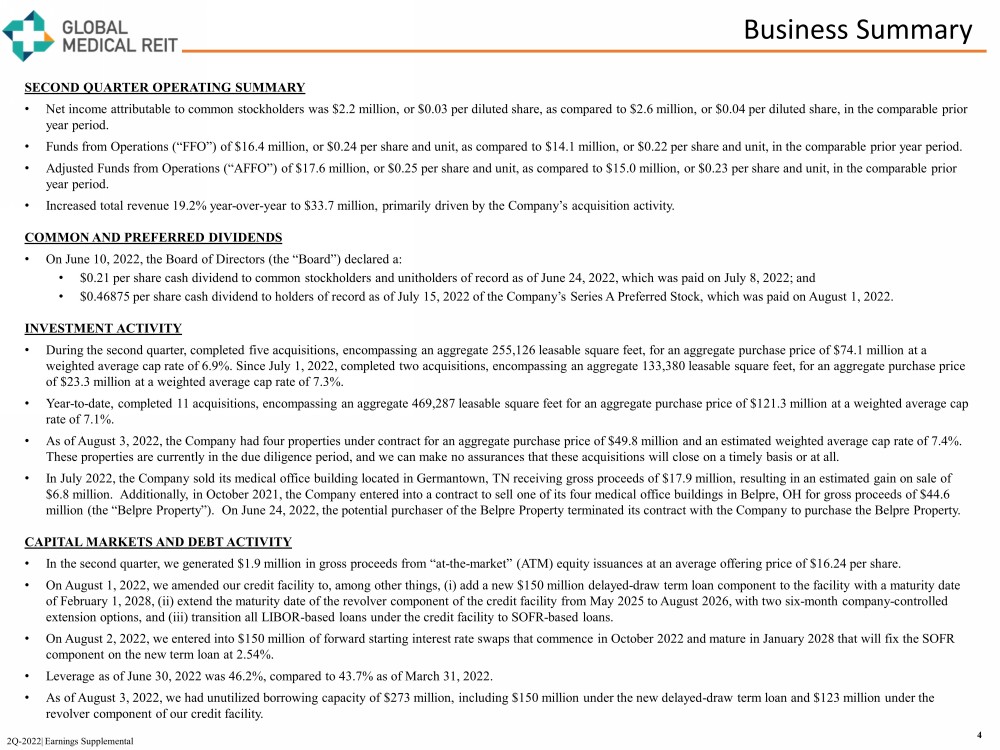
Business Summary 4 2Q - 2022| Earnings Supplemental SECOND QUARTER OPERATING SUMMARY • Net income attributable to common stockholders was $2.2 million, or $0.03 per diluted share, as compared to $2.6 million, or $0. 04 per diluted share, in the comparable prior year period. • Funds from Operations (“FFO”) of $16.4 million, or $0.24 per share and unit, as compared to $14.1 million, or $0.22 per share an d unit, in the comparable prior year period. • Adjusted Funds from Operations (“AFFO”) of $17.6 million, or $0.25 per share and unit, as compared to $15.0 million, or $0.23 pe r share and unit, in the comparable prior year period. • Increased total revenue 19.2% year - over - year to $33.7 million, primarily driven by the Company’s acquisition activity. COMMON AND PREFERRED DIVIDENDS • On June 10, 2022, the Board of Directors (the “Board”) declared a: • $0.21 per share cash dividend to common stockholders and unitholders of record as of June 24, 2022, which was paid on July 8, 20 22; and • $0.46875 per share cash dividend to holders of record as of July 15, 2022 of the Company’s Series A Preferred Stock, which wa s p aid on August 1, 2022. INVESTMENT ACTIVITY • During the second quarter, completed five acquisitions, encompassing an aggregate 255,126 leasable square feet, for an aggreg ate purchase price of $74.1 million at a weighted average cap rate of 6.9%. Since July 1, 2022, completed two acquisitions, encompassing an aggregate 133,380 leasable sq uare feet, for an aggregate purchase price of $23.3 million at a weighted average cap rate of 7.3%. • Year - to - date, completed 11 acquisitions, encompassing an aggregate 469,287 leasable square feet for an aggregate purchase price of $121.3 million at a weighted average cap rate of 7.1%. • As of August 3, 2022, the Company had four properties under contract for an aggregate purchase price of $49.8 million and an est imated weighted average cap rate of 7.4%. These properties are currently in the due diligence period, and we can make no assurances that these acquisitions will close on a timely basis or at all. • In July 2022, the Company sold its medical office building located in Germantown, TN receiving gross proceeds of $17.9 millio n, resulting in an estimated gain on sale of $6.8 million. Additionally, in October 2021, the Company entered into a contract to sell one of its four medical office buil din gs in Belpre, OH for gross proceeds of $44.6 million (the “Belpre Property”). On June 24, 2022, the potential purchaser of the Belpre Property terminated its contract wi th the Company to purchase the Belpre Property. CAPITAL MARKETS AND DEBT ACTIVITY • In the second quarter, we generated $1.9 million in gross proceeds from “ at - the - market” (ATM) equity issuances at an average offering price of $16.24 per share. • On August 1, 2022, we amended our credit facility to, among other things, (i) add a new $150 million delayed - draw term loan component to the facility with a maturity date of February 1, 2028, (ii) extend the maturity date of the revolver component of the credit facility from May 2025 to August 2026, with two s ix - month company - controlled extension options, and (iii) transition all LIBOR - based loans under the credit facility to SOFR - based loans. • On August 2, 2022, we entered into $150 million of forward starting interest rate swaps that commence in October 2022 and mat ure in January 2028 that will fix the SOFR component on the new term loan at 2.54%. • Leverage as of June 30, 2022 was 46.2%, compared to 43.7% as of March 31, 2022. • As of August 3, 2022, we had unutilized borrowing capacity of $273 million, including $150 million under the new delayed - draw te rm loan and $123 million under the revolver component of our credit facility.
ESG Summary 5 2Q - 2022| Earnings Supplemental ENVIRONMENTAL, SOCIAL AND GOVERNANCE (ESG) UPDATE • Our business values integrate environmental sustainability, social responsibility, and strong governance practices throughout ou r Company. We base our ESG approach on three pillars: alignment, access and authenticity. • During the first quarter, we issued our inaugural Corporate Social Responsibility Report, which is available at https://www.globalmedicalreit.com/about/corporate - responsibility/ Environment • We continue to improve and expand our efforts in the corporate sustainability arena through tenant outreach and data collecti on to benchmark our portfolio’s energy consumption and efficiency. We recently submitted our 2021 energy consumption information for the 2021 GRESB assessment repor t. • We incorporate climate risks and environmental sustainability assessments in our due diligence process. • We are exploring ways to mitigate climate risk, should it be present, in our acquisition strategy, as well as ways to contrib ute to the reduction of climate impact through proactive asset management that looks for ways to incorporate renewable energy resources and energy utilization reduction. • We stand with our communities, tenants, and stockholders in supporting meaningful solutions that address this global challeng e a nd contribute to the sustainability of our business objectives. Social • Our Board continues to lead our social and governance efforts. With its diverse composition, our Board is a strong example of inc lus ive leadership. Our Board has been recognized by “Women on Boards” and our executive team reflects our demographically diverse staff. • In 2021, we initiated a successful pilot project with a ride - share provider and national charitable organization in the greater Phoenix, Arizona metro area to provide transportation to healthcare facilities for those in need. We have continued this project during 2022. • Our commitment to employee engagement remains a high - priority, as we continue to make accommodations for health, safety, and wor k - life balance. With this commitment in mind, and with the compensation committee of the Board’s leadership, we conducted an employee survey that covered a comprehen siv e range of subjects related to our employees’ attitudes about our work culture, compensation components, as well as demographic and identification data. Governance • The Board continued to improve our corporate governance structure by adopting an incentive compensation recoupment ( clawback ) policy during the first quarter. • In February 2022, the Board formed a standing ESG committee that oversees the Company’s environmental, social, governance and resilience efforts. This committee provides oversight and support of our commitment to ESG matters by overseeing: (1) our general ESG strategy and policies as set by our m anagement, (2) communications with our employees, investors, and other stakeholders with respect to ESG matters, (3) developments relating to, and improving our und ers tanding of, ESG matters, (4) our compliance with certain ESG - related legal and regulatory requirements, and (5) coordination with other Board committees on ESG matters of c ommon import.
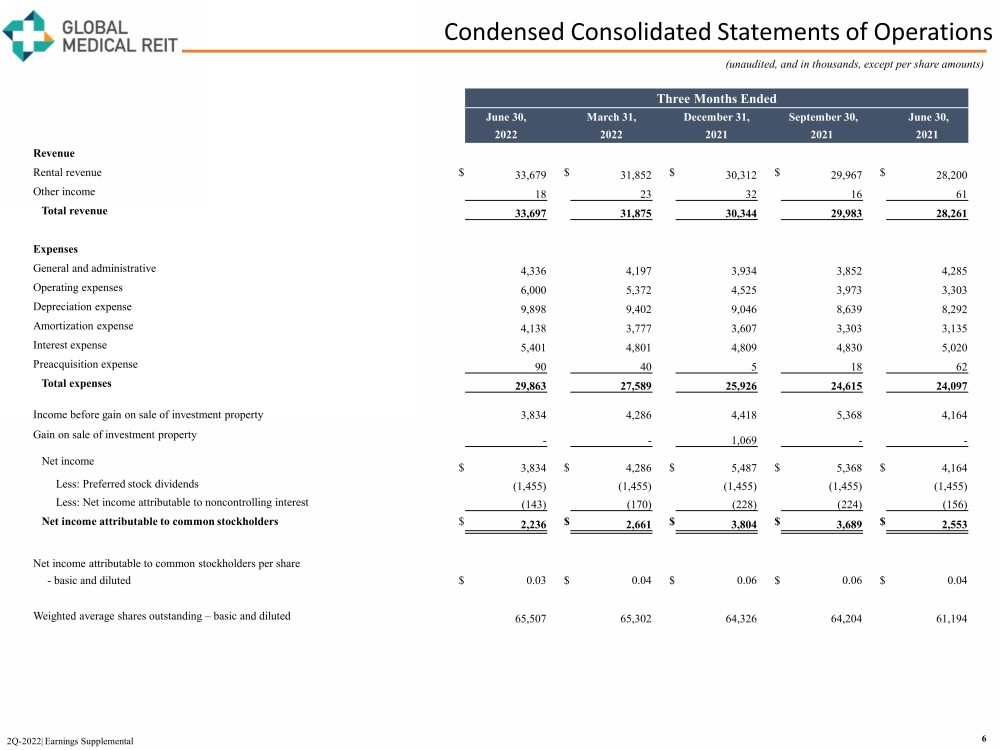
Condensed Consolidated Statements of Operations 6 2Q - 2022| Earnings Supplemental (unaudited, and in thousands, except per share amounts) Three Months Ended June 30, March 31, December 31, September 30, June 30, 2022 2022 2021 2021 2021 Revenue Rental revenue $ 33,679 $ 31,852 $ 30,312 $ 29,967 $ 28,200 Other income 18 23 32 16 61 Total revenue 33,697 31,875 30,344 29,983 28,261 Expenses General and administrative 4,336 4,197 3,934 3,852 4,285 Operating expenses 6,000 5,372 4,525 3,973 3,303 Depreciation expense 9,898 9,402 9,046 8,639 8,292 Amortization expense 4,138 3,777 3,607 3,303 3,135 Interest expense 5,401 4,801 4,809 4,830 5,020 Preacquisition expense 90 40 5 18 62 Total expenses 29,863 27,589 25,926 24,615 24,097 Income before gain on sale of investment property 3,834 4,286 4,418 5,368 4,164 Gain on sale of investment property - - 1,069 - - Net income $ 3,834 $ 4,286 $ 5,487 $ 5,368 $ 4,164 Less: Preferred stock dividends (1,455) (1,455) (1,455) (1,455) (1,455) Less: Net income attributable to noncontrolling interest (143) (170) (228) (224) (156) Net income attributable to common stockholders $ 2,236 $ 2,661 $ 3,804 $ 3,689 $ 2,553 Net income attributable to common stockholders per share - basic and diluted $ 0.03 $ 0.04 $ 0.06 $ 0.06 $ 0.04 Weighted average shares outstanding – basic and diluted 65,507 65,302 64,326 64,204 61,194
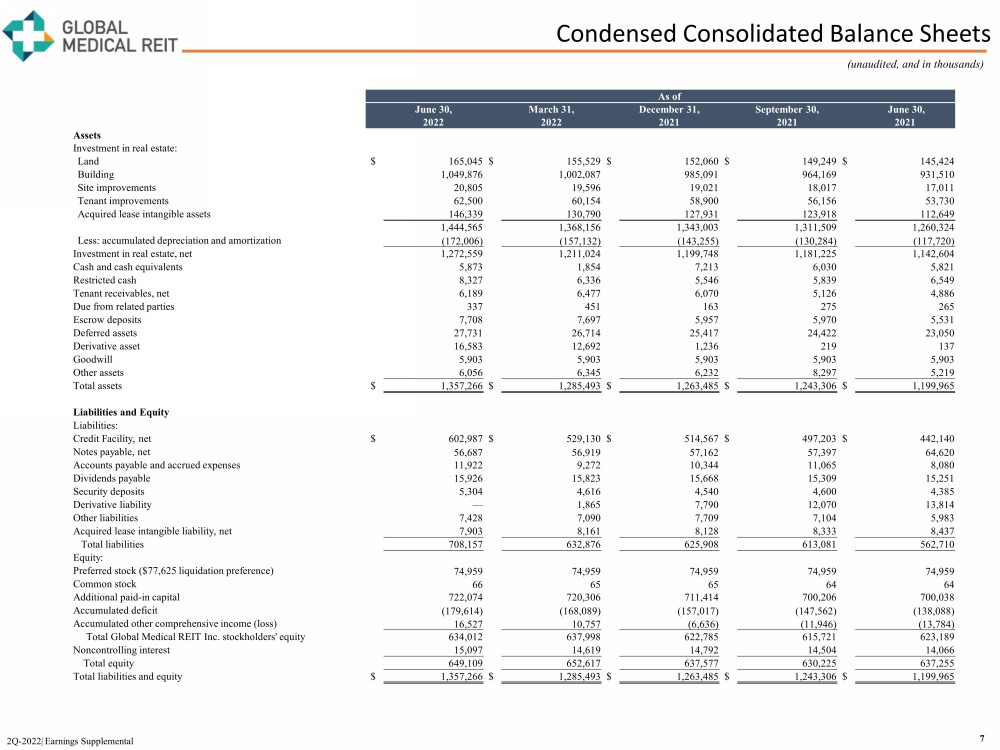
Condensed Consolidated Balance Sheets 7 2Q - 2022| Earnings Supplemental (unaudited, and in thousands) As of June 30, March 31, December 31, September 30, June 30, 2022 2022 2021 2021 2021 Assets Investment in real estate: Land $ 165,045 $ 155,529 $ 152,060 $ 149,249 $ 145,424 Building 1,049,876 1,002,087 985,091 964,169 931,510 Site improvements 20,805 19,596 19,021 18,017 17,011 Tenant improvements 62,500 60,154 58,900 56,156 53,730 Acquired lease intangible assets 146,339 130,790 127,931 123,918 112,649 1,444,565 1,368,156 1,343,003 1,311,509 1,260,324 Less: accumulated depreciation and amortization (172,006) (157,132) (143,255) (130,284) (117,720) Investment in real estate, net 1,272,559 1,211,024 1,199,748 1,181,225 1,142,604 Cash and cash equivalents 5,873 1,854 7,213 6,030 5,821 Restricted cash 8,327 6,336 5,546 5,839 6,549 Tenant receivables, net 6,189 6,477 6,070 5,126 4,886 Due from related parties 337 451 163 275 265 Escrow deposits 7,708 7,697 5,957 5,970 5,531 Deferred assets 27,731 26,714 25,417 24,422 23,050 Derivative asset 16,583 12,692 1,236 219 137 Goodwill 5,903 5,903 5,903 5,903 5,903 Other assets 6,056 6,345 6,232 8,297 5,219 Total assets $ 1,357,266 $ 1,285,493 $ 1,263,485 $ 1,243,306 $ 1,199,965 Liabilities and Equity Liabilities: Credit Facility, net $ 602,987 $ 529,130 $ 514,567 $ 497,203 $ 442,140 Notes payable, net 56,687 56,919 57,162 57,397 64,620 Accounts payable and accrued expenses 11,922 9,272 10,344 11,065 8,080 Dividends payable 15,926 15,823 15,668 15,309 15,251 Security deposits 5,304 4,616 4,540 4,600 4,385 Derivative liability — 1,865 7,790 12,070 13,814 Other liabilities 7,428 7,090 7,709 7,104 5,983 Acquired lease intangible liability, net 7,903 8,161 8,128 8,333 8,437 Total liabilities 708,157 632,876 625,908 613,081 562,710 Equity: Preferred stock ($77,625 liquidation preference) 74,959 74,959 74,959 74,959 74,959 Common stock 66 65 65 64 64 Additional paid - in capital 722,074 720,306 711,414 700,206 700,038 Accumulated deficit (179,614) (168,089) (157,017) (147,562) (138,088) Accumulated other comprehensive income (loss) 16,527 10,757 (6,636) (11,946) (13,784) Total Global Medical REIT Inc. stockholders' equity 634,012 637,998 622,785 615,721 623,189 Noncontrolling interest 15,097 14,619 14,792 14,504 14,066 Total equity 649,109 652,617 637,577 630,225 637,255 Total liabilities and equity $ 1,357,266 $ 1,285,493 $ 1,263,485 $ 1,243,306 $ 1,199,965
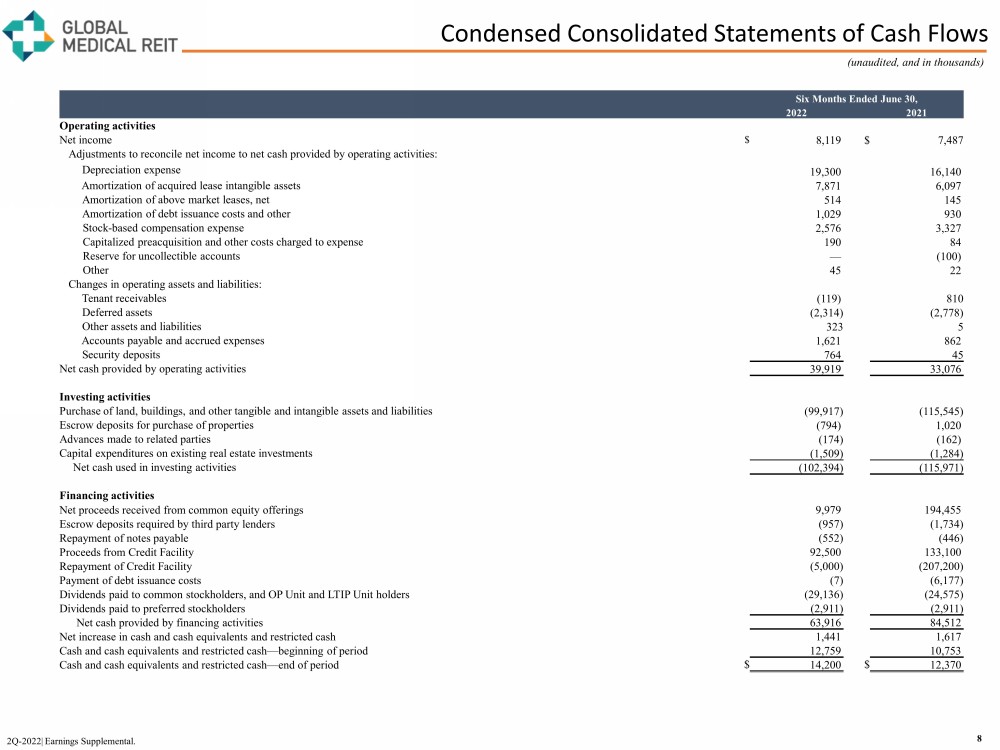
Condensed Consolidated Statements of Cash Flows 8 (unaudited, and in thousands) Six Months Ended June 30, 2022 2021 Operating activities Net income $ 8,119 $ 7,487 Adjustments to reconcile net income to net cash provided by operating activities: Depreciation expense 19,300 16,140 Amortization of acquired lease intangible assets 7,871 6,097 Amortization of above market leases, net 514 145 Amortization of debt issuance costs and other 1,029 930 Stock - based compensation expense 2,576 3,327 Capitalized preacquisition and other costs charged to expense 190 84 Reserve for uncollectible accounts — (100) Other 45 22 Changes in operating assets and liabilities: Tenant receivables (119) 810 Deferred assets (2,314) (2,778) Other assets and liabilities 323 5 Accounts payable and accrued expenses 1,621 862 Security deposits 764 45 Net cash provided by operating activities 39,919 33,076 Investing activities Purchase of land, buildings, and other tangible and intangible assets and liabilities (99,917) (115,545) Escrow deposits for purchase of properties (794) 1,020 Advances made to related parties (174) (162) Capital expenditures on existing real estate investments (1,509) (1,284) Net cash used in investing activities (102,394) (115,971) Financing activities Net proceeds received from common equity offerings 9,979 194,455 Escrow deposits required by third party lenders (957) (1,734) Repayment of notes payable (552) (446) Proceeds from Credit Facility 92,500 133,100 Repayment of Credit Facility (5,000) (207,200) Payment of debt issuance costs (7) (6,177) Dividends paid to common stockholders, and OP Unit and LTIP Unit holders (29,136) (24,575) Dividends paid to preferred stockholders (2,911) (2,911) Net cash provided by financing activities 63,916 84,512 Net increase in cash and cash equivalents and restricted cash 1,441 1,617 Cash and cash equivalents and restricted cash — beginning of period 12,759 10,753 Cash and cash equivalents and restricted cash — end of period $ 14,200 $ 12,370 2Q - 2022| Earnings Supplemental.
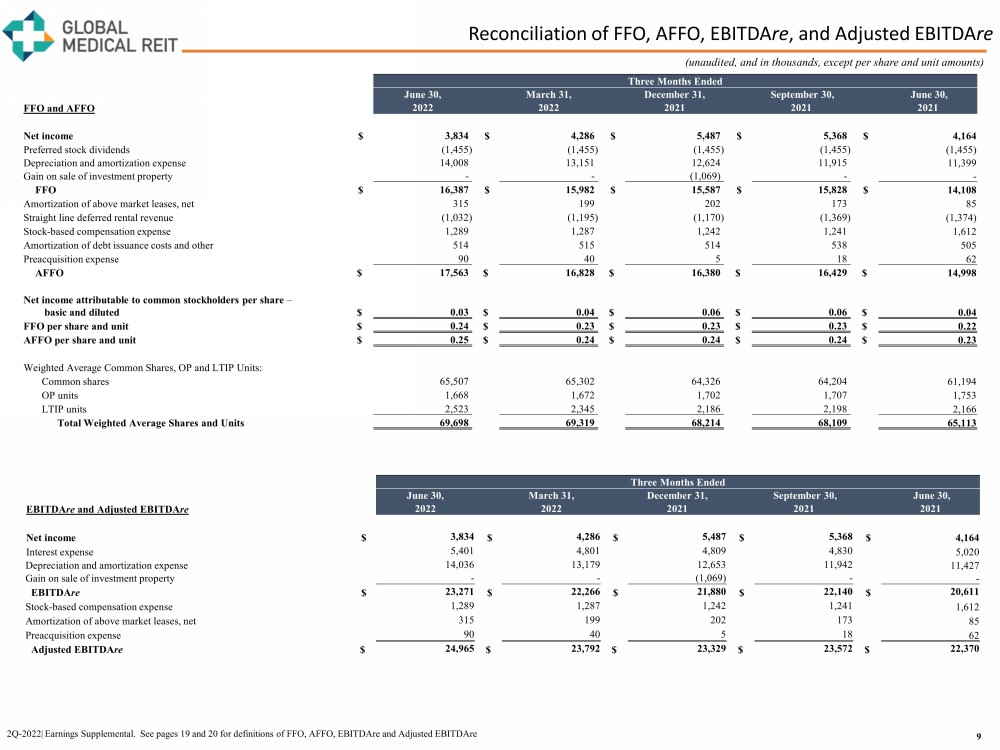
Reconciliation of FFO, AFFO, EBITDA re , and Adjusted EBITDA re 9 2Q - 2022| Earnings Supplemental. See pages 19 and 20 for definitions of FFO, AFFO, EBITDAre and Adjusted EBITDAre (unaudited, and in thousands, except per share and unit amounts) Three Months Ended June 30, March 31, December 31, September 30, June 30, FFO and AFFO 2022 2022 2021 2021 2021 Net income $ 3,834 $ 4,286 $ 5,487 $ 5,368 $ 4,164 Preferred stock dividends (1,455) (1,455) (1,455) (1,455) (1,455) Depreciation and amortization expense 14,008 13,151 12,624 11,915 11,399 Gain on sale of investment property - - (1,069) - - FFO $ 16,387 $ 15,982 $ 15,587 $ 15,828 $ 14,108 Amortization of above market leases, net 315 199 202 173 85 Straight line deferred rental revenue (1,032) (1,195) (1,170) (1,369) (1,374) Stock - based compensation expense 1,289 1,287 1,242 1,241 1,612 Amortization of debt issuance costs and other 514 515 514 538 505 Preacquisition expense 90 40 5 18 62 AFFO $ 17,563 $ 16,828 $ 16,380 $ 16,429 $ 14,998 Net income attributable to common stockholders per share – basic and diluted $ 0.03 $ 0.04 $ 0.06 $ 0.06 $ 0.04 FFO per share and unit $ 0.24 $ 0.23 $ 0.23 $ 0.23 $ 0.22 AFFO per share and unit $ 0.25 $ 0.24 $ 0.24 $ 0.24 $ 0.23 Weighted Average Common Shares, OP and LTIP Units: Common shares 65,507 65,302 64,326 64,204 61,194 OP units 1,668 1,672 1,702 1,707 1,753 LTIP units 2,523 2,345 2,186 2,198 2,166 Total Weighted Average Shares and Units 69,698 69,319 68,214 68,109 65,113 Three Months Ended June 30, March 31, December 31, September 30, June 30, EBITDA re and Adjusted EBITDA re 2022 2022 2021 2021 2021 Net income $ 3,834 $ 4,286 $ 5,487 $ 5,368 $ 4,164 Interest expense 5,401 4,801 4,809 4,830 5,020 Depreciation and amortization expense 14,036 13,179 12,653 11,942 11,427 Gain on sale of investment property - - (1,069) - - EBITDA re $ 23,271 $ 22,266 $ 21,880 $ 22,140 $ 20,611 Stock - based compensation expense 1,289 1,287 1,242 1,241 1,612 Amortization of above market leases, net 315 199 202 173 85 Preacquisition expense 90 40 5 18 62 Adjusted EBITDA re $ 24,965 $ 23,792 $ 23,329 $ 23,572 $ 22,370
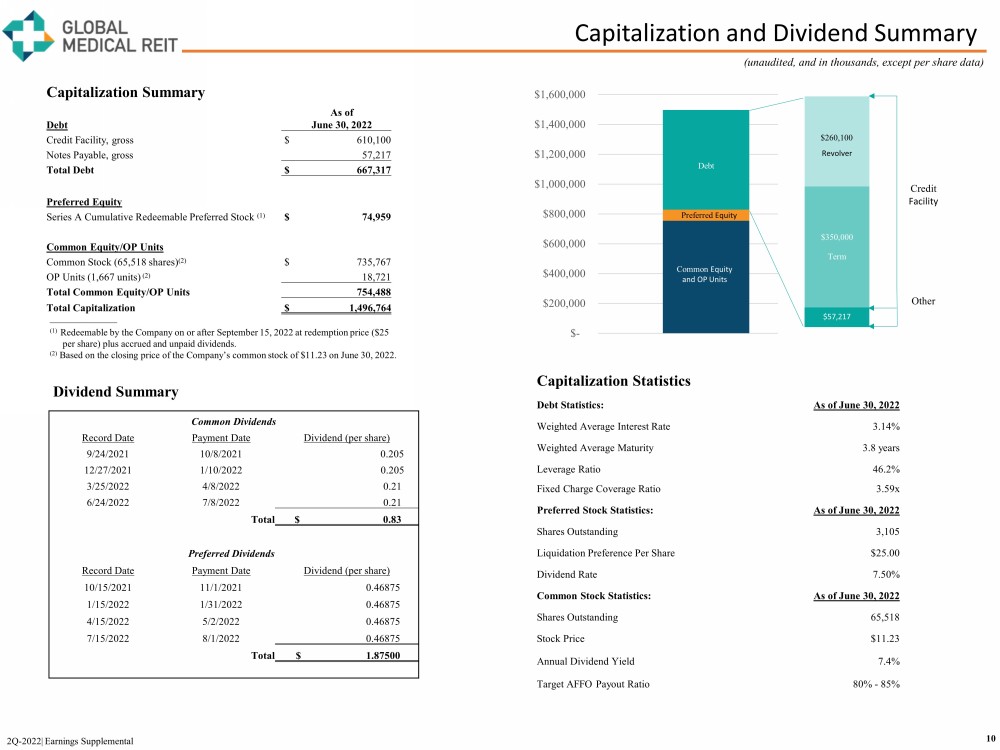
Capitalization and Dividend Summary 10 2Q - 2022| Earnings Supplemental (unaudited, and in thousands, except per share data) (1) Redeemable by the Company on or after September 15, 2022 at redemption price ($25 per share) plus accrued and unpaid dividends. (2) Based on the closing price of the Company’s common stock of $11.23 on June 30, 2022. $- $200,000 $400,000 $600,000 $800,000 $1,000,000 $1,200,000 $1,400,000 $1,600,000 Debt Preferred Equity Common Equity and OP Units $57,217 $350,000 $260,100 Revolver Term Credit Facility Other Capitalization Summary Debt As of June 30, 2022 Credit Facility, gross $ 610,100 Notes Payable, gross 57,217 Total Debt $ 667,317 Preferred Equity Series A Cumulative Redeemable Preferred Stock (1) $ 74,959 Common Equity/OP Units Common Stock (65,518 shares) (2) $ 735,767 OP Units (1,667 units) (2) 18,721 Total Common Equity/OP Units 754,488 Total Capitalization $ 1,496,764 Capitalization Statistics Debt Statistics: As of June 30, 2022 Weighted Average Interest Rate 3.14% Weighted Average Maturity 3.8 years Leverage Ratio 46.2% Fixed Charge Coverage Ratio 3.59x Preferred Stock Statistics: As of June 30, 2022 Shares Outstanding 3,105 Liquidation Preference Per Share $25.00 Dividend Rate 7.50% Common Stock Statistics: As of June 30, 2022 Shares Outstanding 65,518 Stock Price $11.23 Annual Dividend Yield 7.4% Target AFFO Payout Ratio 80% - 85% Dividend Summary Common Dividends Record Date Payment Date Dividend (per share) 9/24/2021 10/8/2021 0.205 12/27/2021 1/10/2022 0.205 3/25/2022 4/8/2022 0.21 6/24/2022 7/8/2022 0.21 Total $ 0.83 Preferred Dividends Record Date Payment Date Dividend (per share) 10/15/2021 11/1/2021 0.46875 1/15/2022 1/31/2022 0.46875 4/15/2022 5/2/2022 0.46875 7/15/2022 8/1/2022 0.46875 Total $ 1.87500
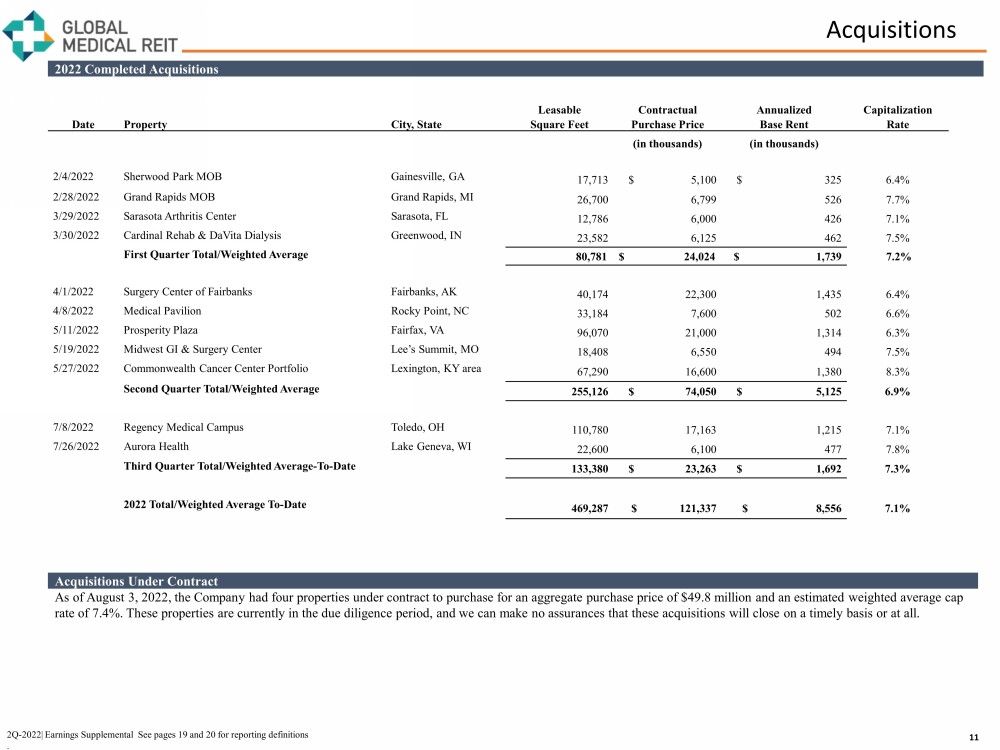
Acquisitions 11 2022 Completed Acquisitions Acquisitions Under Contract As of August 3, 2022, the Company had four properties under contract to purchase for an aggregate purchase price of $49.8 mil lio n and an estimated weighted average cap rate of 7.4%. These properties are currently in the due diligence period, and we can make no assurances that these acquisitio ns will close on a timely basis or at all. 2Q - 2022| Earnings Supplemental See pages 19 and 20 for reporting definitions . Date Property City, State Leasable Square Feet Contractual Purchase Price Annualized Base Rent Capitalization Rate (in thousands) (in thousands) 2/4/2022 Sherwood Park MOB Gainesville, GA 17,713 $ 5,100 $ 325 6.4% 2/28/2022 Grand Rapids MOB Grand Rapids, MI 26,700 6,799 526 7.7% 3/29/2022 Sarasota Arthritis Center Sarasota, FL 12,786 6,000 426 7.1% 3/30/2022 Cardinal Rehab & DaVita Dialysis Greenwood, IN 23,582 6,125 462 7.5% First Quarter Total/Weighted Average 80,781 $ 24,024 $ 1,739 7.2% 4/1/2022 Surgery Center of Fairbanks Fairbanks, AK 40,174 22,300 1,435 6.4% 4/8/2022 Medical Pavilion Rocky Point, NC 33,184 7,600 502 6.6% 5/11/2022 Prosperity Plaza Fairfax, VA 96,070 21,000 1,314 6.3% 5/19/2022 Midwest GI & Surgery Center Lee’s Summit, MO 18,408 6,550 494 7.5% 5/27/2022 Commonwealth Cancer Center Portfolio Lexington, KY area 67,290 16,600 1,380 8.3% Second Quarter Total/Weighted Average 255,126 $ 74,050 $ 5,125 6.9% 7/8/2022 Regency Medical Campus Toledo, OH 110,780 17,163 1,215 7.1% 7/26/2022 Aurora Health Lake Geneva, WI 22,600 6,100 477 7.8% Third Quarter Total/Weighted Average - To - Date 133,380 $ 23,263 $ 1,692 7.3% 2022 Total/Weighted Average To - Date 469,287 $ 121,337 $ 8,556 7.1%
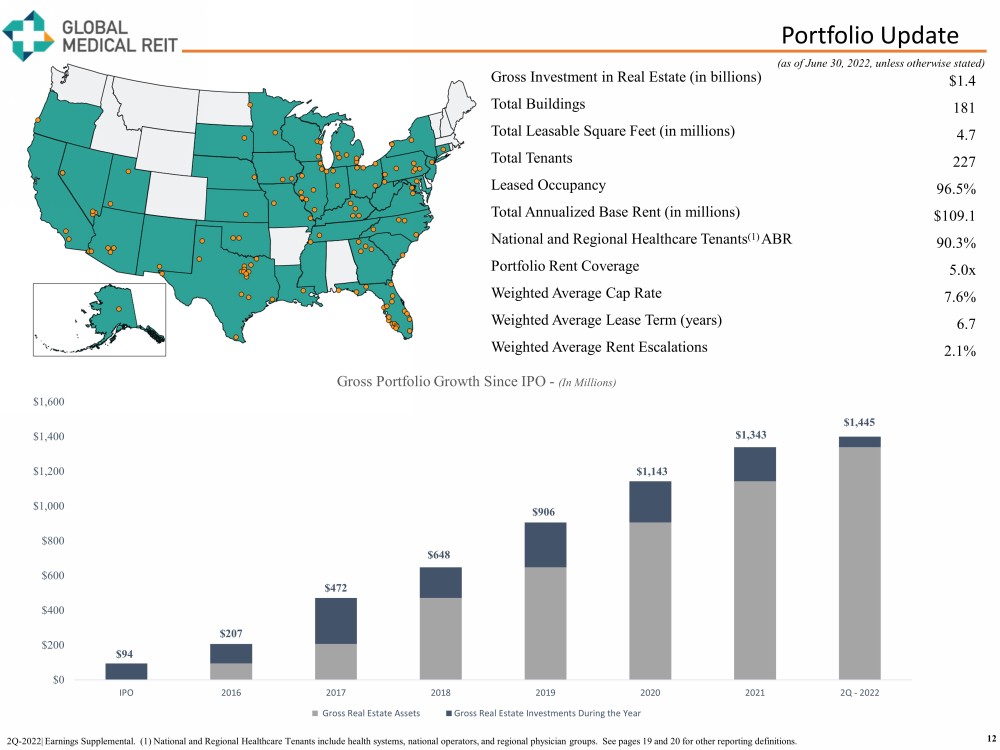
Portfolio Update 12 Gross Investment in Real Estate (in billions) $1.4 Total Buildings 181 Total Leasable Square Feet (in millions) 4.7 Total Tenants 227 Leased Occupancy 96.5% Total Annualized Base Rent (in millions) $109.1 National and Regional Healthcare Tenants (1) ABR 90.3% Portfolio Rent Coverage 5.0x Weighted Average Cap Rate 7.6% Weighted Average Lease Term (years) 6.7 Weighted Average Rent Escalations 2.1% (as of June 30, 2022, unless otherwise stated) 2Q - 2022| Earnings Supplemental. (1) National and Regional Healthcare Tenants include health systems, national operators, and re gional physician groups. See pages 19 and 20 for other reporting definitions. $94 $207 $472 $648 $906 $1,143 $1,343 $1,445 $0 $200 $400 $600 $800 $1,000 $1,200 $1,400 $1,600 IPO 2016 2017 2018 2019 2020 2021 2Q - 2022 Gross Portfolio Growth Since IPO - (In Millions) Gross Real Estate Assets Gross Real Estate Investments During the Year
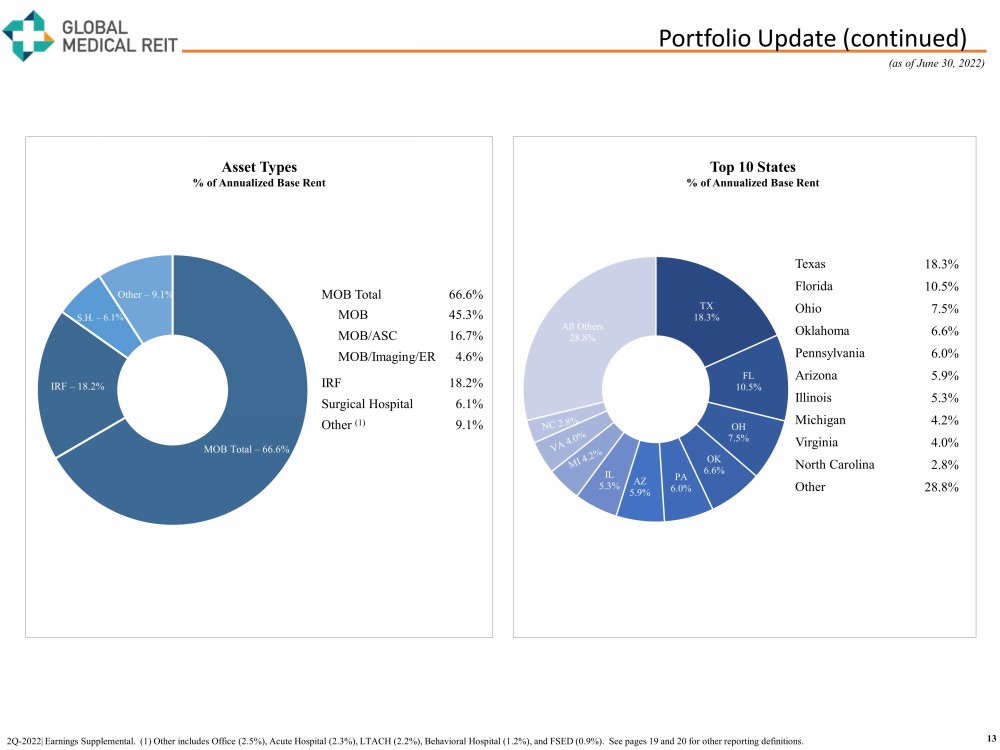
Portfolio Update (continued) 13 2Q - 2022| Earnings Supplemental. (1) Other includes Office (2.5%), Acute Hospital (2.3%), LTACH (2.2%), Behavioral Hospital (1.2 %), and FSED (0.9%). See pages 19 and 20 for other reporting definitions. MOB Total – 66.6% IRF – 18.2% Other – 9.1% Texas 18.3% Florida 10.5% Ohio 7.5% Oklahoma 6.6% Pennsylvania 6.0% Arizona 5.9% Illinois 5.3% Michigan 4.2% Virginia 4.0% North Carolina 2.8% Other 28.8% TX 18.3% FL 10.5% OH 7.5% OK 6.6% PA 6.0% AZ 5.9% IL 5.3% All Others 28.8% Top 10 States % of Annualized Base Rent Asset Types % of Annualized Base Rent (as of June 30, 2022) MOB Total 66.6% MOB 45.3% MOB/ASC 16.7% MOB/Imaging/ER 4.6% IRF 18.2% Surgical Hospital 6.1% Other (1) 9.1%
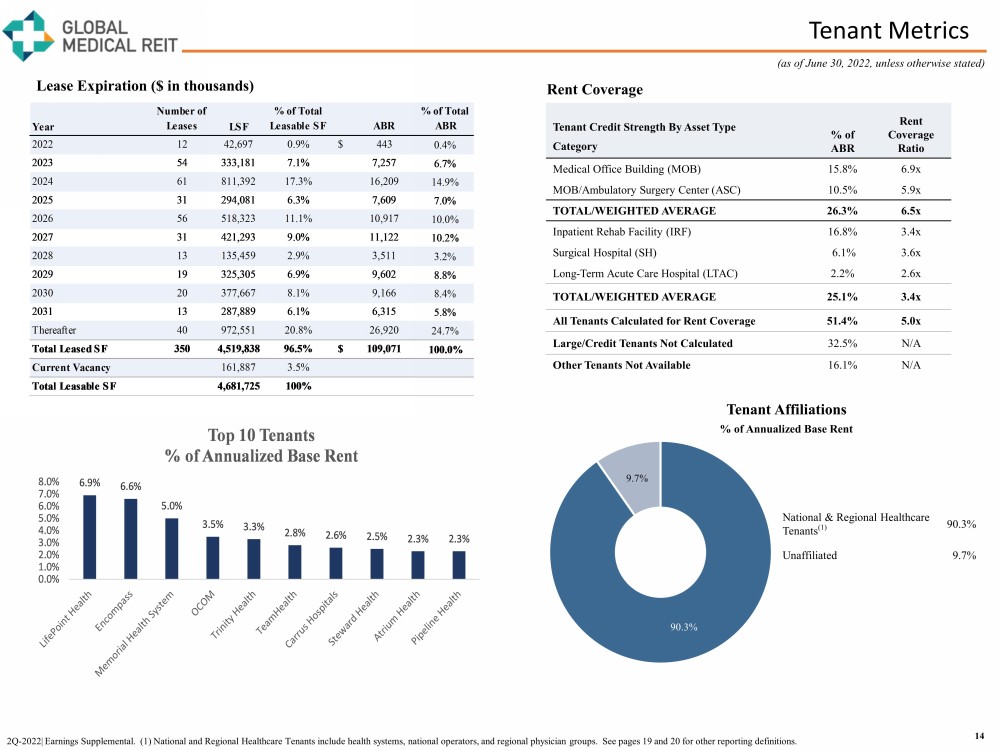
Tenant Metrics 14 2Q - 2022| Earnings Supplemental. (1) National and Regional Healthcare Tenants include health systems, national operators, and re gional physician groups. See pages 19 and 20 for other reporting definitions. (as of June 30, 2022, unless otherwise stated) Tenant Credit Strength By Asset Type Category % of ABR Rent Coverage Ratio Medical Office Building (MOB) 15.8% 6.9x MOB/Ambulatory Surgery Center (ASC) 10.5% 5.9x TOTAL/WEIGHTED AVERAGE 26.3% 6.5x Inpatient Rehab Facility (IRF) 16.8% 3.4x Surgical Hospital (SH) 6.1% 3.6x Long - Term Acute Care Hospital (LTAC) 2.2% 2.6x TOTAL/WEIGHTED AVERAGE 25.1% 3.4x All Tenants Calculated for Rent Coverage 51.4% 5.0x Large/Credit Tenants Not Calculated 32.5% N/A Other Tenants Not Available 16.1% N/A Lease Expiration ($ in thousands) Rent Coverage 90.3% 9.7% National & Regional Healthcare Tenants (1) 90.3% Unaffiliated 9.7% Tenant Affiliations % of Annualized Base Rent 6.9% 6.6% 5.0% 3.5% 3.3% 2.8% 2.6% 2.5% 2.3% 2.3% 0.0% 1.0% 2.0% 3.0% 4.0% 5.0% 6.0% 7.0% 8.0% Top 10 Tenants % of Annualized Base Rent Year Number of Leases LSF % of Total Leasable SF ABR % of Total ABR 2022 12 42,697 0.9% $ 443 0.4% 2023 54 333,181 7.1% 7,257 6.7% 2024 61 811,392 17.3% 16,209 14.9% 2025 31 294,081 6.3% 7,609 7.0% 2026 56 518,323 11.1% 10,917 10.0% 2027 31 421,293 9.0% 11,122 10.2% 2028 13 135,459 2.9% 3,511 3.2% 2029 19 325,305 6.9% 9,602 8.8% 2030 20 377,667 8.1% 9,166 8.4% 2031 13 287,889 6.1% 6,315 5.8% Thereafter 40 972,551 20.8% 26,920 24.7% Total Leased SF 350 4,519,838 96.5% $ 109,071 100.0% Current Vacancy 161,887 3.5% Total Leasable SF 4,681,725 100%
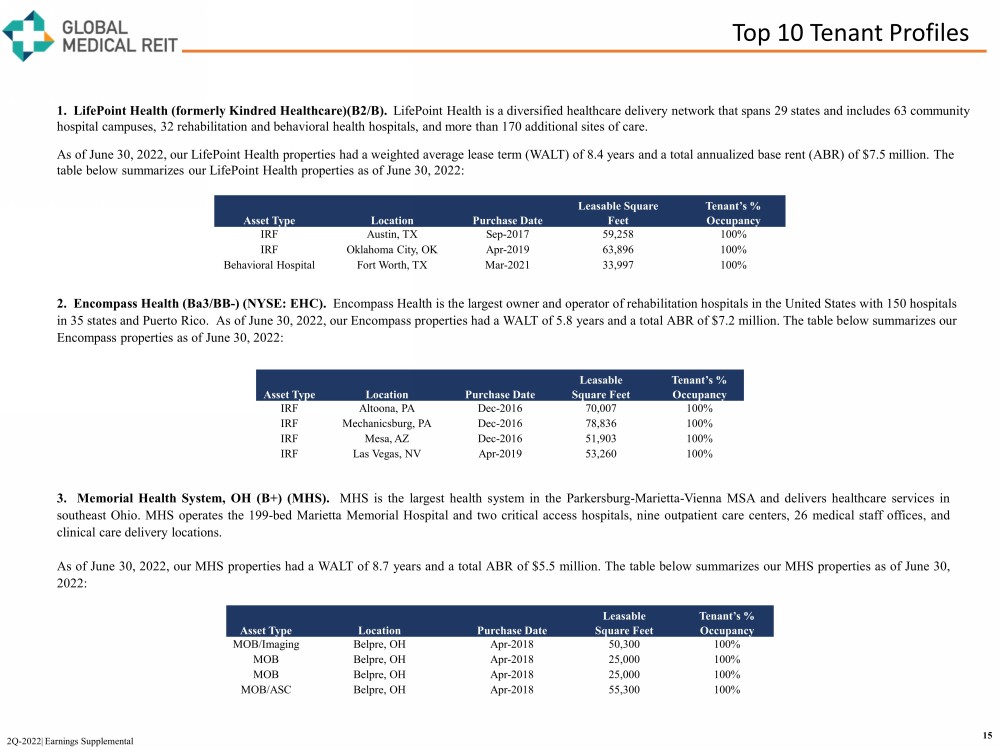
Top 10 Tenant Profiles 15 2Q - 2022| Earnings Supplemental 1. LifePoint Health (formerly Kindred Healthcare)(B2/B). LifePoint Health is a diversified healthcare delivery network that spans 29 states and includes 63 community hospital campuses, 32 rehabilitation and behavioral health hospitals, and more than 170 additional sites of care. As of June 30, 2022, our LifePoint Health properties had a weighted average lease term (WALT) of 8.4 years and a total annual ize d base rent (ABR) of $7.5 million. The table below summarizes our LifePoint Health properties as of June 30, 2022: 2 . Encompass Health (Ba 3 /BB - ) (NYSE : EHC) . Encompass Health is the largest owner and operator of rehabilitation hospitals in the United States with 150 hospitals in 35 states and Puerto Rico . As of June 30 , 2022 , our Encompass properties had a WALT of 5 . 8 years and a total ABR of $ 7 . 2 million . The table below summarizes our Encompass properties as of June 30 , 2022 : 3 . Memorial Health System, OH (B+) (MHS) . MHS is the largest health system in the Parkersburg - Marietta - Vienna MSA and delivers healthcare services in southeast Ohio . MHS operates the 199 - bed Marietta Memorial Hospital and two critical access hospitals, nine outpatient care centers, 26 medical staff offices, and clinical care delivery locations . As of June 30 , 2022 , our MHS properties had a WALT of 8 . 7 years and a total ABR of $ 5 . 5 million . The table below summarizes our MHS properties as of June 30 , 2022 : Asset Type Location Purchase Date Leasable Square Feet Tenant’s % Occupancy IRF Austin, TX Sep - 2017 59,258 100% IRF Oklahoma City, OK Apr - 2019 63,896 100% Behavioral Hospital Fort Worth, TX Mar - 2021 33,997 100% Asset Type Location Purchase Date Leasable Square Feet Tenant’s % Occupancy IRF Altoona, PA Dec - 2016 70,007 100% IRF Mechanicsburg, PA Dec - 2016 78,836 100% IRF Mesa, AZ Dec - 2016 51,903 100% IRF Las Vegas, NV Apr - 2019 53,260 100% Asset Type Location Purchase Date Leasable Square Feet Tenant’s % Occupancy MOB/Imaging Belpre, OH Apr - 2018 50,300 100% MOB Belpre, OH Apr - 2018 25,000 100% MOB Belpre, OH Apr - 2018 25,000 100% MOB/ASC Belpre, OH Apr - 2018 55,300 100%
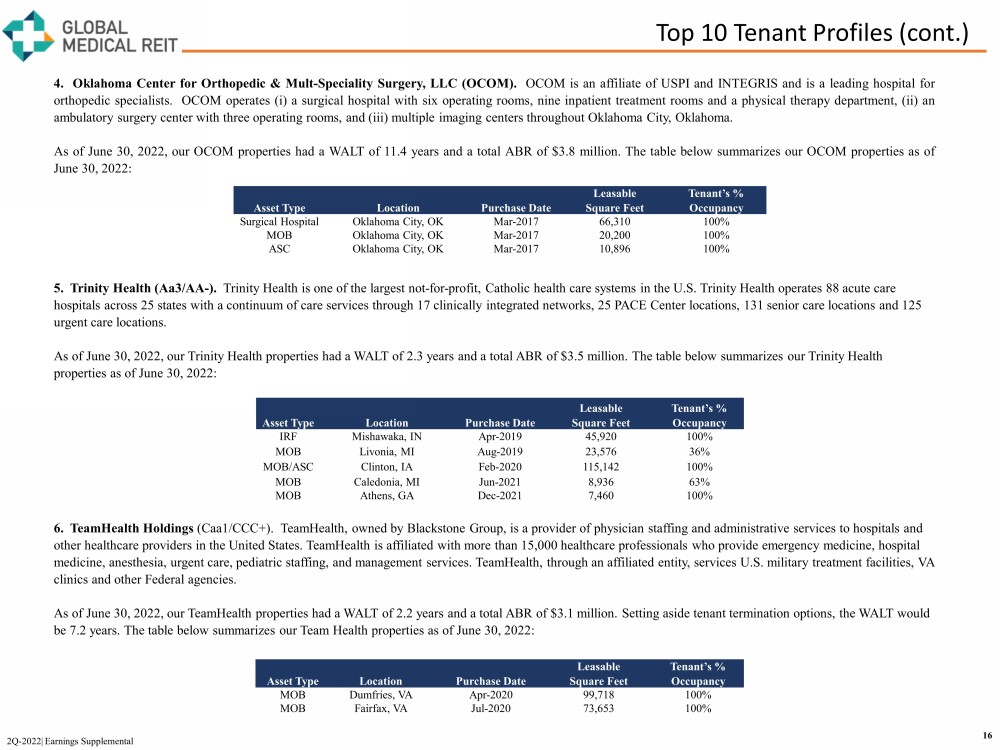
5. Trinity Health (Aa3/AA - ). Trinity Health is one of the largest not - for - profit, Catholic health care systems in the U.S. Trinity Health operates 88 acute c are hospitals across 25 states with a continuum of care services through 17 clinically i ntegrated n etworks, 25 PACE Center locations, 131 senior c are locations and 125 urgent c are locations. As of June 30, 2022, our Trinity Health properties had a WALT of 2.3 years and a total ABR of $3.5 million . The table below summarizes our Trinity Health properties as of June 30, 2022: Top 10 Tenant Profiles (cont.) 6. TeamHealth Holdings (Caa1/CCC+). TeamHealth, owned by Blackstone Group, is a provider of physician staffing and administrative services to hospitals and other healthcare providers in the United States. TeamHealth is affiliated with more than 15,000 healthcare professionals who pro vide emergency medicine, hospital medicine, anesthesia, urgent care, pediatric staffing, and management services. TeamHealth, through an affiliated entity, ser vic es U.S. military treatment facilities, VA clinics and other Federal agencies. As of June 30, 2022, our TeamHealth properties had a WALT of 2.2 years and a total ABR of $3.1 million . Setting aside tenant termination options, the WALT would be 7.2 years. The table below summarizes our Team Health properties as of June 30, 2022: 2Q - 2022| Earnings Supplemental 16 4 . Oklahoma Center for Orthopedic & Mult - Speciality Surgery, LLC (OCOM) . OCOM is an affiliate of USPI and INTEGRIS and is a leading hospital for orthopedic specialists . OCOM operates (i) a surgical hospital with six operating rooms, nine inpatient treatment rooms and a physical therapy department, (ii) an ambulatory surgery center with three operating rooms, and (iii) multiple imaging centers throughout Oklahoma City, Oklahoma . As of June 30 , 2022 , our OCOM properties had a WALT of 11 . 4 years and a total ABR of $ 3 . 8 million . The table below summarizes our OCOM properties as of June 30 , 2022 : Asset Type Location Purchase Date Leasable Square Feet Tenant’s % Occupancy Surgical Hospital Oklahoma City, OK Mar - 2017 66,310 100% MOB Oklahoma City, OK Mar - 2017 20,200 100% ASC Oklahoma City, OK Mar - 2017 10,896 100% Asset Type Location Purchase Date Leasable Square Feet Tenant’s % Occupancy IRF Mishawaka, IN Apr - 2019 45,920 100% MOB Livonia, MI Aug - 2019 23,576 36% MOB/ASC Clinton, IA Feb - 2020 115,142 100% MOB Caledonia, MI Jun - 2021 8,936 63% MOB Athens, GA Dec - 2021 7,460 100% Asset Type Location Purchase Date Leasable Square Feet Tenant’s % Occupancy MOB Dumfries, VA Apr - 2020 99,718 100% MOB Fairfax, VA Jul - 2020 73,653 100%
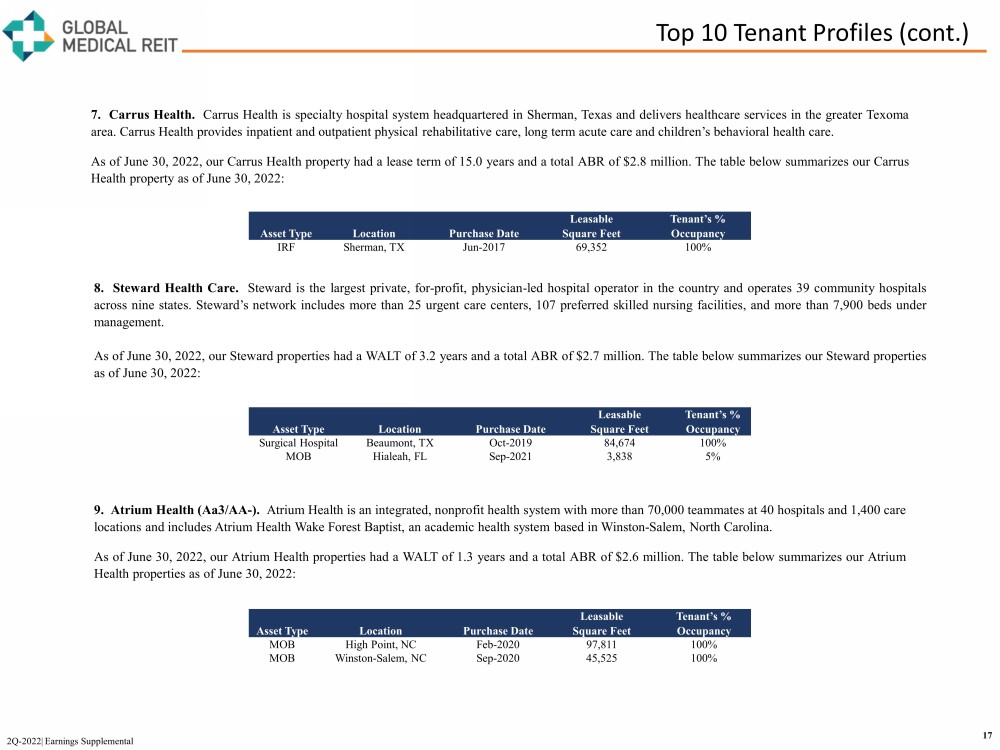
8 . Steward Health Care . Steward is the largest private, for - profit , physician - led hospital operator in the country and operates 39 community hospitals across nine states . Steward’s network includes more than 25 urgent c are c enters, 107 preferred skilled nursing facilities, and more than 7 , 900 beds under management . A s of June 30 , 2022 , our Steward properties had a WALT of 3 . 2 years and a total ABR of $ 2 . 7 million . The table below summarizes our Steward properties as of June 30 , 2022 : 9 . Atrium Health (Aa 3 /AA - ) . Atrium Health is an integrated, nonprofit health system with more than 70 , 000 teammates at 40 hospitals and 1 , 400 care locations and includes Atrium Health Wake Forest Baptist, an academic health system based in Winston - Salem, North Carolina . As of June 30 , 2022 , our Atrium Health properties had a WALT of 1 . 3 years and a total ABR of $ 2 . 6 million . The table below summarizes our Atrium Health properties as of June 30 , 2022 : Top 10 Tenant Profiles (cont.) 2Q - 2022| Earnings Supplemental 17 7 . Carrus Health . Carrus Health is specialty hospital system headquartered in Sherman, Texas and delivers healthcare services in the greater Texoma area . Carrus Health provides inpatient and outpatient physical rehabilitative care, long term acute care and children’s behavioral health care . As of June 30 , 2022 , our Carrus Health property had a lease term of 15 . 0 years and a total ABR of $ 2 . 8 million . The table below summarizes our Carrus Health property as of June 30 , 2022 : Asset Type Location Purchase Date Leasable Square Feet Tenant’s % Occupancy IRF Sherman, TX Jun - 2017 69,352 100% Asset Type Location Purchase Date Leasable Square Feet Tenant’s % Occupancy Surgical Hospital Beaumont, TX Oct - 2019 84,674 100% MOB Hialeah, FL Sep - 2021 3,838 5% Asset Type Location Purchase Date Leasable Square Feet Tenant’s % Occupancy MOB High Point, NC Feb - 2020 97,811 100% MOB Winston - Salem, NC Sep - 2020 45,525 100%
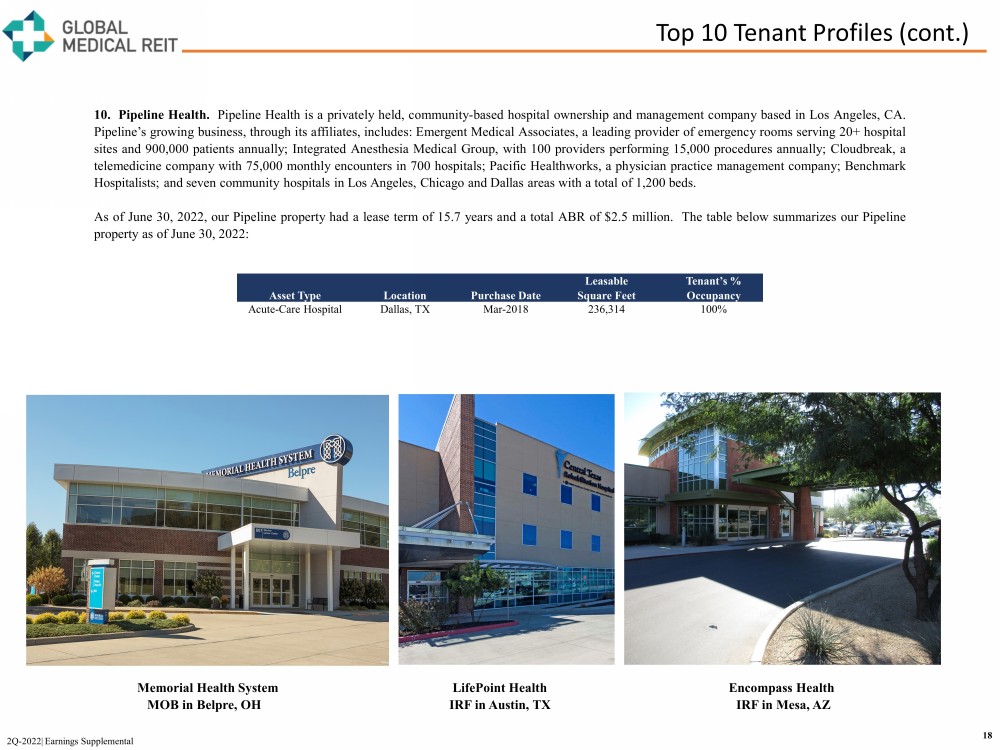
10 . Pipeline Health . Pipeline Health is a privately held, community-based hospital ownership and management company based in Los Angeles, CA . Pipeline’s growing business, through its affiliates, includes : Emergent Medical Associates, a leading provider of emergency rooms serving 20 + hospital sites and 900 , 000 patients annually ; Integrated Anesthesia Medical Group, with 100 providers performing 15 , 000 procedures annually ; Cloudbreak , a telemedicine company with 75 , 000 monthly encounters in 700 hospitals ; Pacific Healthworks, a physician practice management company ; Benchmark Hospitalists ; and seven community hospitals in Los Angeles, Chicago and Dallas areas with a total of 1 , 200 beds . As of June 30 , 2022 , our Pipeline property had a lease term of 15 . 7 years and a total ABR of $ 2 . 5 million . The table below summarizes our Pipeline property as of June 30 , 2022 : Top 10 Tenant Profiles (cont.) 18 2Q - 2022| Earnings Supplemental Asset Type Location Purchase Date Leasable Square Feet Tenant’s % Occupancy Acute - Care Hospital Dallas, TX Mar - 2018 236,314 100% Memorial Health System LifePoint Health Encompass Health MOB in Belpre, OH IRF in Austin, TX IRF in Mesa, AZ
Reporting Definitions and Other Disclosures Reporting Definitions Annualized Base Rent Annualized base rent represents monthly base rent for most recent month or month of acquisition, multiplied by 12 (or actual NOI where more reflective of property performance) . Accordingly, this methodology produces an annualized amount as of a point in time but does not take into account future contractual rental rate increases . Additionally, properties that are accounted for on a cash - collected basis are not included annualized base rent . Capitalization Rate The capitalization rate (“Cap Rate”) for an acquisition is calculated by dividing current Annualized Base Rent by contractual purchase price . For the portfolio capitalization rate, certain adjustments, including for subsequent capital invested, are made to the contractual purchase price . Earnings Before Interest, Taxes, Depreciation and Amortization for Real Estate ( EBITDA re and Adjusted EBITDA re ) We calculate EBITDA re in accordance with standards established by NAREIT and define EBITDA re as net income or loss computed in accordance with GAAP plus depreciation and amortization, interest expense, gain or loss on the sale of investment properties, and impairment loss, as applicable . We define Adjusted EBITDA re as EBITDA re plus non - cash stock compensation expense, non - cash intangible amortization related to above and below market leases, preacquisition expense and other normalizing items . Management considers EBITDA re and Adjusted EBITDA re important measures because they provide additional information to allow management, investors, and our current and potential creditors to evaluate and compare our core operating results and our ability to service debt . Funds from Operations and Adjusted Funds from Operations Funds from operations (“FFO”) and adjusted funds from operations (“AFFO”) are non - GAAP financial measures within the meaning of the rules of the SEC . The Company considers FFO and AFFO to be important supplemental measures of its operating performance and believes FFO is frequently used by securities analysts, investors, and other interested parties in the evaluation of REITs, many of which present FFO when reporting their results . In accordance with the National Association of Real Estate Investment Trusts’ (“NAREIT”) definition, FFO means net income or loss computed in accordance with GAAP before noncontrolling interests of holders of OP units and LTIP units, excluding gains (or losses) from sales of property and extraordinary items, less preferred stock dividends, plus real estate - related depreciation and amortization (excluding amortization of debt issuance costs and the amortization of above and below market leases), and after adjustments for unconsolidated partnerships and joint ventures . Because FFO excludes real estate - related depreciation and amortization (other than amortization of debt issuance costs and above and below market lease amortization expense), the Company believes that FFO provides a performance measure that, when compared period - over - period, reflects the impact to operations from trends in occupancy rates, rental rates, operating costs, development activities and interest expense, providing perspective not immediately apparent from the closest GAAP measurement, net income or loss . AFFO is a non - GAAP measure used by many investors and analysts to measure a real estate company’s operating performance by removing the effect of items that do not reflect ongoing property operations . Management calculates AFFO by modifying the NAREIT computation of FFO by adjusting it for certain cash and non - cash items and certain recurring and non - recurring items . For the Company these items include recurring acquisition and disposition costs, loss on the extinguishment of debt, recurring straight line deferred rental revenue, recurring stock - based compensation expense, recurring amortization of above and below market leases, recurring amortization of debt issuance costs, recurring lease commissions, and other items . Management believes that reporting AFFO in addition to FFO is a useful supplemental measure for the investment community to use when evaluating the operating performance of the Company on a comparative basis . 19 (as of June 30, 2022) 2Q - 2022| Earnings Supplemental
Reporting Definitions and Other Disclosures Reporting Definitions (continued) Rent Coverage Ratio For purposes of calculating our portfolio weighted - average EBITDARM coverage ratio (“Rent Coverage Ratio”), we excluded credit - rated tenants or their subsidiaries for which financial statements were either not available or not sufficiently detailed . These ratios are based on latest available information only . Most tenant financial statements are unaudited and we have not independently verified any tenant financial information (audited or unaudited) and, therefore, we cannot assure you that such information is accurate or complete . Certain other tenants (approximately 16 % of our portfolio) are excluded from the calculation due to (i) lack of available financial information, (ii) small tenant size or (iii) receipt of significant COVID - 19 relief funds that may cause reported coverage to differ materially from underlying performance . Additionally, our Rent Coverage Ratio adds back physician distributions and compensation . Management believes all adjustments are reasonable and necessary . Other Disclosures Non - GAAP Financial Measures Management considers certain non - GAAP financial measures to be useful supplemental measures of the Company's operating performance . For the Company, non - GAAP measures consist of EBITDA re , Adjusted EBITDA re , FFO and AFFO . A non - GAAP financial measure is generally defined as one that purports to measure financial performance, financial position or cash flows, but excludes or includes amounts that would not be so adjusted in the most comparable measure determined in accordance with GAAP . The Company reports non - GAAP financial measures because these measures are observed by management to also be among the most predominant measures used by the REIT industry and by industry analysts to evaluate REITs . For these reasons, management deems it appropriate to disclose and discuss these non - GAAP financial measures . The non - GAAP financial measures presented herein are not necessarily identical to those presented by other real estate companies due to the fact that not all real estate companies use the same definitions . These measures should not be considered as alternatives to net income, as indicators of the Company's financial performance, or as alternatives to cash flow from operating activities as measures of the Company's liquidity, nor are these measures necessarily indicative of sufficient cash flow to fund all of the Company's needs . Management believes that in order to facilitate a clear understanding of the Company's historical consolidated operating results, these measures should be examined in conjunction with net income and cash flows from operations as presented elsewhere herein . Forward - Looking Statements Certain statements contained herein may be considered “forward - looking statements” within the meaning of the Private Securities Litigation Reform Act of 1995 , and it is the Company’s intent that any such statements be protected by the safe harbor created thereby . These forward - looking statements are identified by their use of terms and phrases such as "anticipate," "believe," "could," "estimate," "expect," "intend," "may," "should," "plan," "predict," "project," "will," "continue" and other similar terms and phrases, including references to assumptions and forecasts of future results . Except for historical information, the statements set forth herein including, but not limited to, any statements regarding our earnings, our liquidity, our tenants’ ability to pay rent to us, expected financial performance (including future cash flows associated with new tenants or the expansion of current properties), future dividends or other financial items ; any other statements concerning our plans, strategies, objectives and expectations for future operations, our pipeline of acquisition opportunities and expected acquisition activity, including the timing and/or successful completion of any acquisitions and expected rent receipts on these properties, our expected disposition activity, including the timing and/or successful completion of any dispositions and the expected use of proceeds therefrom, and any statements regarding future economic conditions or performance are forward - looking statements . These forward - looking statements are based on our current expectations, estimates and assumptions and are subject to certain risks and uncertainties . Although the Company believes that the expectations, estimates and assumptions reflected in its forward - looking statements are reasonable, actual results could differ materially from those projected or assumed in any of the Company’s forward - looking statements . Additional information concerning us and our business, including additional factors that could materially and adversely affect our financial results, include, without limitation, the risks described under Part I, Item 1 A - Risk Factors, in our Annual Report on Form 10 - K, our Quarterly Reports on Form 10 - Q, and in our other filings with the SEC . You are cautioned not to place undue reliance on forward - looking statements . The Company does not intend, and undertakes no obligation, to update any forward - looking statement . Additional Information The information in this document should be read in conjunction with the Company’s Annual Report on Form 10 - K, Quarterly Reports on Form 10 - Q, Current Reports on Form 8 - K, and other information filed with, or furnished to, the SEC . You can access the Company’s reports and amendments to those reports filed or furnished to the SEC pursuant to Section 13 (a) or 15 (d) of the Exchange Act in the “Investor Relations” section on the Company’s website (www . globalmedicalreit . com) under “SEC Filings” as soon as reasonably practicable after they are filed with, or furnished to, the SEC . The information on or connected to the Company’s website is not, and shall not be deemed to be, a part of, or incorporated into, this Earnings Supplemental . You also can review these SEC filings and other information by accessing the SEC’s website at http : //www . sec . gov . Certain information contained in this package, including, but not limited to, information contained in our Top 10 tenant profiles is derived from publicly - available third - party sources . The Company has not independently verified this information and there can be no assurance that such information is accurate or complete . 20 (as of June 30, 2022) 2Q - 2022| Earnings Supplemental
Stephen Swett stephen.swett@icrinc.com 203.682.8377 www.globalmedicalreit.com NYSE: GMRE INVESTOR RELATIONS