Exhibit 99.2
Third Quarter 2022 Earnings Supplemental www.globalmedicalreit.com NYSE: GMRE Wake Forest Medical – Winston - Salem, NC Atrium Health – Winston - Salem, NC
Table of Contents Table of Contents Company Overview 3 - 5 Select Quarterly Financial Data 6 Business Summary 7 ESG Summary 8 Acquisitions 9 Portfolio Summary 10 - 11 Top 10 Tenants 12 - 14 Debt and Hedging Summary 15 Total Capitalization and Equity Summary 16 Condensed Consolidated Statements of Operations 17 Condensed Consolidated Balance Sheets 18 Condensed Consolidated Statements of Cash Flows 19 Non - GAAP Reconciliations 20 Reporting Definitions and Other Disclosures 21 - 22 2 Forward - Looking Statements Certain statements contained herein may be considered “forward - looking statements” within the meaning of the Private Securities Litigation Reform Act of 1995 , and it is the Company’s intent that any such statements be protected by the safe harbor created thereby . These forward - looking statements are identified by their use of terms and phrases such as "anticipate," "believe," "could," "estimate," "expect," "intend," "may," "should," "plan," "predict," "project," "will," "continue" and other similar terms and phrases, including references to assumptions and forecasts of future results . Except for historical information, the statements set forth herein including, but not limited to, any statements regarding our earnings, our liquidity, our tenants’ ability to pay rent to us, expected financial performance (including future cash flows associated with new tenants or the expansion of current properties), future dividends or other financial items ; any other statements concerning our plans, strategies, objectives and expectations for future operations and future portfolio occupancy rates, our pipeline of acquisition opportunities and expected acquisition activity, including the timing and/or successful completion of any acquisitions and expected rent receipts on these properties, our expected disposition activity, including the timing and/or successful completion of any dispositions and the expected use of proceeds therefrom, and any statements regarding future economic conditions or performance are forward - looking statements . These forward - looking statements are based on our current expectations, estimates and assumptions and are subject to certain risks and uncertainties . Although the Company believes that the expectations, estimates and assumptions reflected in its forward - looking statements are reasonable, actual results could differ materially from those projected or assumed in any of the Company’s forward - looking statements . Additional information concerning us and our business, including additional factors that could materially and adversely affect our financial results, include, without limitation, the risks described under Part I, Item 1 A - Risk Factors, in our Annual Report on Form 10 - K, our Quarterly Reports on Form 10 - Q, and in our other filings with the SEC . You are cautioned not to place undue reliance on forward - looking statements . The Company does not intend, and undertakes no obligation, to update any forward - looking statement . 3Q - 2022| Earnings Supplemental Legent Hospital for Special Surgery – Plano, TX Associates in Ophthalmology – West Mifflin, PA
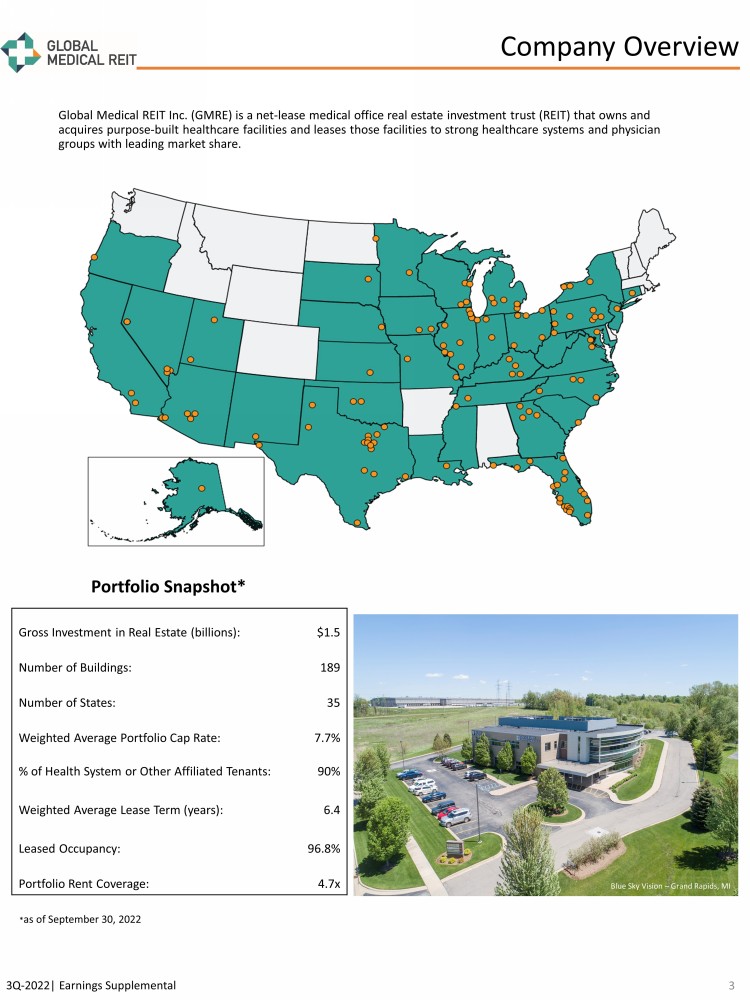
Company Overview Global Medical REIT Inc. (GMRE) is a net - lease medical office real estate investment trust (REIT) that owns and acquires purpose - built healthcare facilities and leases those facilities to strong healthcare systems and physician groups with leading market share. Gross Investment in Real Estate (billions): $1.5 Number of Buildings: 189 Number of States: 35 Weighted Average Portfolio Cap Rate: 7.7% % of Health System or Other Affiliated Tenants: 90% Weighted Average Lease Term (years): 6.4 Leased Occupancy: 96.8% Portfolio Rent Coverage: 4.7x Portfolio Snapshot* South Lake Heart & Vascular – Claremont, FL * as of September 30, 2022 Blue Sky Vision – Grand Rapids, MI 3Q - 2022| Earnings Supplemental 3 Blue Sky Vision – Grand Rapids, MI
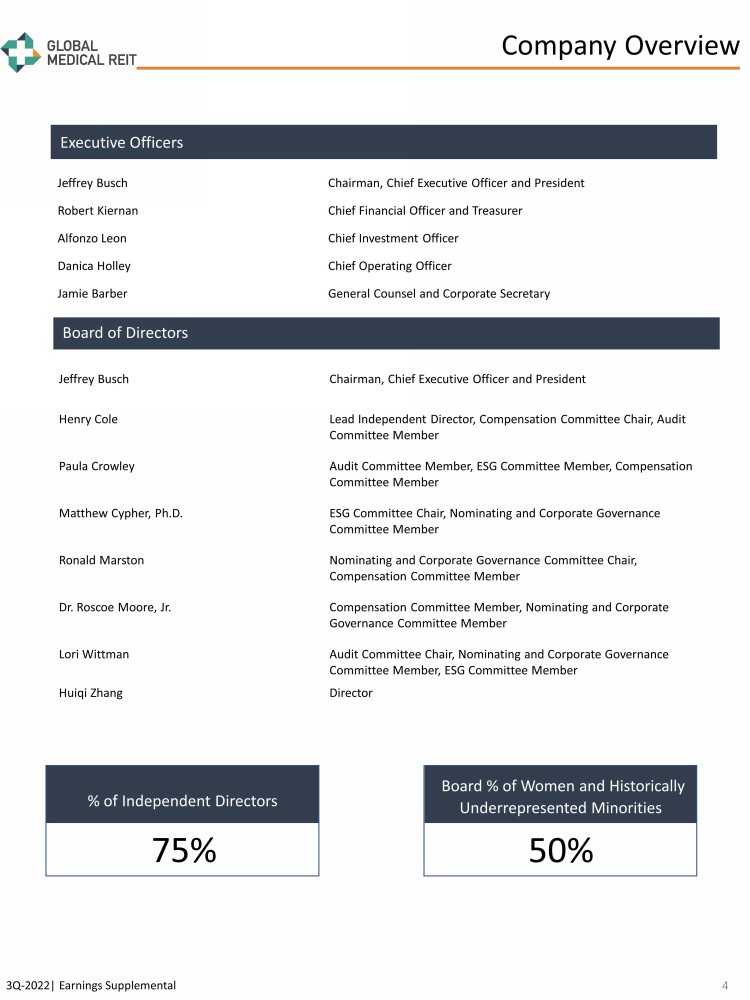
3Q - 2022| Earnings Supplemental Executive Officers Jeffrey Busch Chairman, Chief Executive Officer and President Robert Kiernan Chief Financial Officer and Treasurer Alfonzo Leon Chief Investment Officer Danica Holley Chief Operating Officer Jamie Barber General Counsel and Corporate Secretary Board of Directors Executive Officers Jeffrey Busch Chairman, Chief Executive Officer and President Henry Cole Lead Independent Director, Compensation Committee Chair, Audit Committee Member Paula Crowley Audit Committee Member, ESG Committee Member, Compensation Committee Member Matthew Cypher, Ph.D. ESG Committee Chair, Nominating and Corporate Governance Committee Member Ronald Marston Nominating and Corporate Governance Committee Chair, Compensation Committee Member Dr. Roscoe Moore, Jr. Compensation Committee Member, Nominating and Corporate Governance Committee Member Lori Wittman Audit Committee Chair, Nominating and Corporate Governance Committee Member, ESG Committee Member Huiqi Zhang Director % of Independent Directors 75% Board % of Women and Historically Underrepresented Minorities 50% Company Overview 4
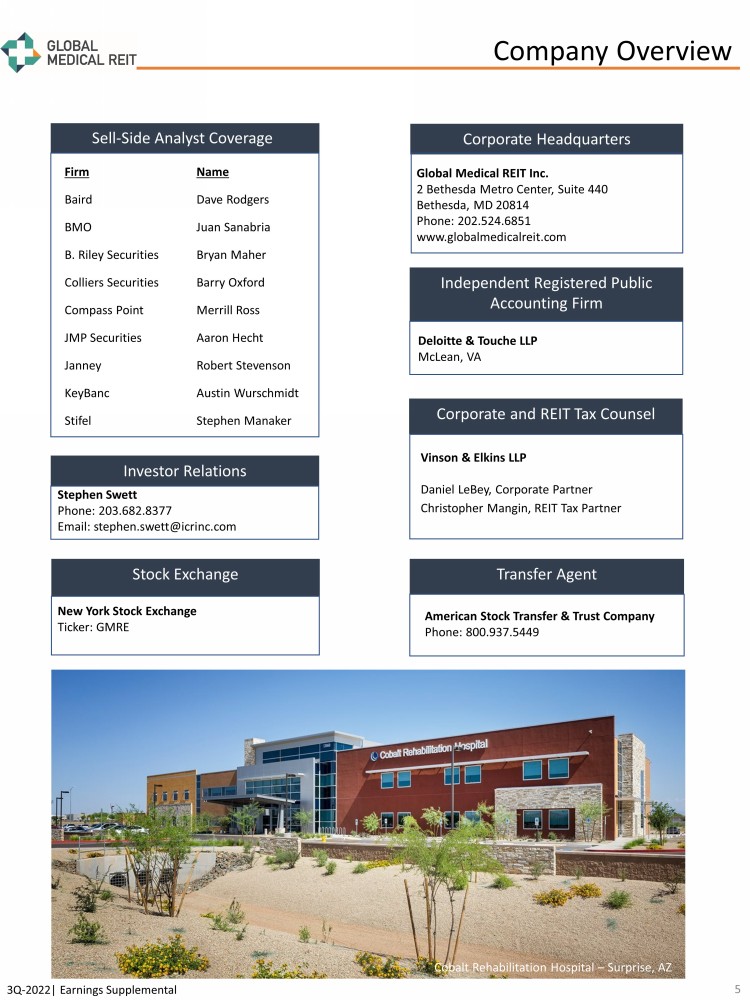
3Q - 2022| Earnings Supplemental Executive Officers Firm Name Baird Dave Rodgers BMO Juan Sanabria B. Riley Securities Bryan Maher Colliers Securities Barry Oxford Compass Point Merrill Ross JMP Securities Aaron Hecht Janney Robert Stevenson KeyBanc Austin Wurschmidt Stifel Stephen Manaker Sell - Side Analyst Coverage Corporate Headquarters Global Medical REIT Inc. 2 Bethesda Metro Center, Suite 440 Bethesda, MD 20814 Phone: 202.524.6851 www.globalmedicalreit.com Investor Relations Deloitte & Touche LLP McLean, VA Independent Registered Public Accounting Firm Corporate and REIT Tax Counsel Vinson & Elkins LLP Daniel LeBey, Corporate Partner Christopher Mangin, REIT Tax Partner Stephen Swett Phone: 203.682.8377 Email: stephen.swett@icrinc.com Stock Exchange New York Stock Exchange Ticker: GMRE Transfer Agent American Stock Transfer & Trust Company Phone: 800.937.5449 Thumb Butte Medical Center Prescott, Az Cobalt Rehabilitation Hospital – Surprise, AZ Company Overview 5
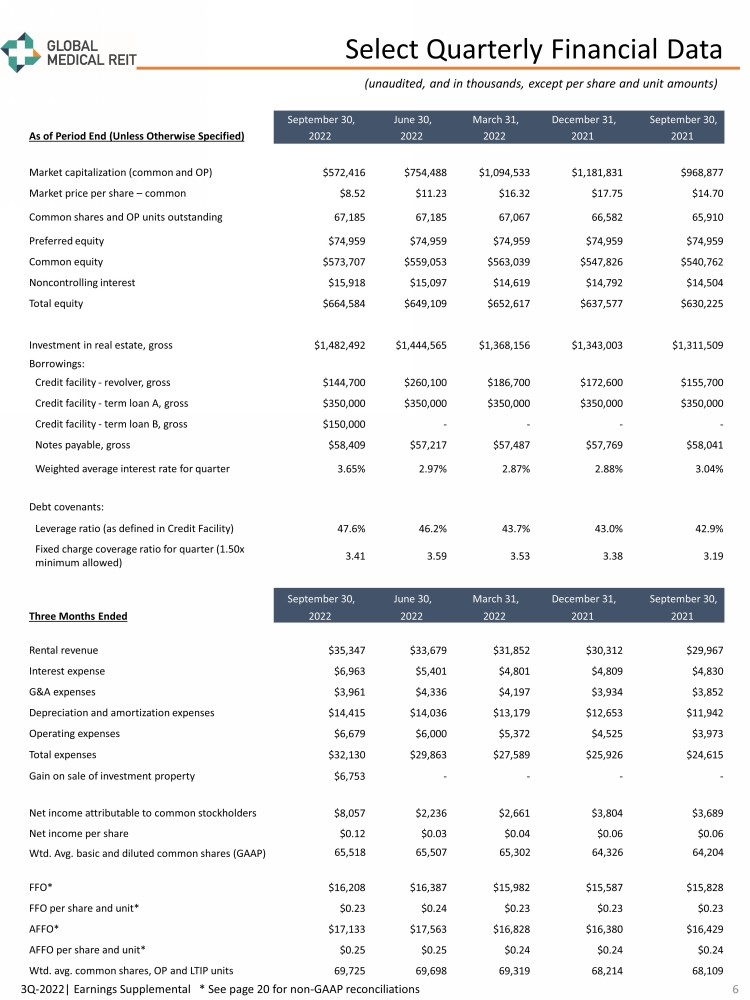
(unaudited, and in thousands, except per share and unit amounts) 3Q - 2022| Earnings Supplemental * See page 20 for non - GAAP reconciliations September 30, June 30, March 31, December 31, September 30, As of Period End (Unless Otherwise Specified) 2022 2022 2022 2021 2021 Market capitalization (common and OP) $572,416 $754,488 $1,094,533 $1,181,831 $968,877 Market price per share – common $8.52 $11.23 $16.32 $17.75 $14.70 Common shares and OP units outstanding 67,185 67,185 67,067 66,582 65,910 Preferred equity $74,959 $74,959 $74,959 $74,959 $74,959 Common equity $573,707 $559,053 $563,039 $547,826 $540,762 Noncontrolling interest $15,918 $15,097 $14,619 $14,792 $14,504 Total equity $664,584 $649,109 $652,617 $637,577 $630,225 Investment in real estate, gross $1,482,492 $1,444,565 $1,368,156 $1,343,003 $1,311,509 Borrowings: Credit facility - revolver, gross $144,700 $260,100 $186,700 $172,600 $155,700 Credit facility - term loan A, gross $350,000 $350,000 $350,000 $350,000 $350,000 Credit facility - term loan B, gross $150,000 - - - - Notes payable, gross $58,409 $57,217 $57,487 $57,769 $58,041 Weighted average interest rate for quarter 3.65% 2.97% 2.87% 2.88% 3.04% Debt covenants: Leverage ratio (as defined in Credit Facility) 47.6% 46.2% 43.7% 43.0% 42.9% Fixed charge coverage ratio for quarter (1.50x minimum allowed) 3.41 3.59 3.53 3.38 3.19 September 30, June 30, March 31, December 31, September 30, Three Months Ended 2022 2022 2022 2021 2021 Rental revenue $35,347 $33,679 $31,852 $30,312 $29,967 Interest expense $6,963 $5,401 $4,801 $4,809 $4,830 G&A expenses $3,961 $4,336 $4,197 $3,934 $3,852 Depreciation and amortization expenses $14,415 $14,036 $13,179 $12,653 $11,942 Operating expenses $6,679 $6,000 $5,372 $4,525 $3,973 Total expenses $32,130 $29,863 $27,589 $25,926 $24,615 Gain on sale of investment property $6,753 - - - - Net income attributable to common stockholders $8,057 $2,236 $2,661 $3,804 $3,689 Net income per share $0.12 $0.03 $0.04 $0.06 $0.06 Wtd . Avg. basic and diluted common shares (GAAP) 65,518 65,507 65,302 64,326 64,204 FFO* $16,208 $16,387 $15,982 $15,587 $15,828 FFO per share and unit* $0.23 $0.24 $0.23 $0.23 $0.23 AFFO* $17,133 $17,563 $16,828 $16,380 $16,429 AFFO per share and unit* $0.25 $0.25 $0.24 $0.24 $0.24 Wtd . avg. common shares, OP and LTIP units 69,725 69,698 69,319 68,214 68,109 Select Quarterly Financial Data 6
3Q - 2022| Earnings Supplemental • Net income attributable to common stockholders was $8.1 million, or $0.12 per diluted share, as compared to $3.7 million, or $0. 06 per diluted share, in the comparable prior year period. • Funds from Operations (“FFO”) of $16.2 million, or $0.23 per share and unit, as compared to $15.8 million, or $0.23 per share an d unit, in the comparable prior year period. • Adjusted Funds from Operations (“AFFO”) of $17.1 million, or $0.25 per share and unit, as compared to $16.4 million, or $0.24 pe r share and unit, in the comparable prior year period. • Increased total revenue 18.1% year - over - year to $35.4 million, primarily driven by the Company’s acquisition activity. • Sold a medical office building located in Germantown, Tennessee, receiving gross proceeds of $17.9 million, resulting in a ga in on sale of $6.8 million. • On September 9, 2022, the Board of Directors (the “Board”) declared a: • $0.21 per share cash dividend to common stockholders and unitholders of record as of September 23, 2022, which was paid on October 11, 2022; and • $0.46875 per share cash dividend to holders of record as of October 15, 2022, of the Company’s Series A Preferred Stock, whic h w as paid on October 31, 2022. • During the third quarter, completed five acquisitions, encompassing an aggregate 247,346 leasable square feet, for an aggrega te purchase price of $50.8 million at a weighted average cap rate of 7.1%. • Year - to - date, completed 14 acquisitions, encompassing an aggregate 583,253 leasable square feet for an aggregate purchase price of $148.9 million at a weighted average cap rate of 7.2%. • On August 1, 2022, we amended our credit facility to, among other things, (i) add a new $150 million term loan to the facility with a maturity date of February 1, 2028, (ii) extend the maturity date of the revolver component of the credit facility from May 2025 to Aug ust 2026, with two six - month company - controlled extension options, and (iii) transition all LIBOR - based loans under the credit facility to SOFR - based loans. • In connection with the new term loan, we entered into $150 million of interest rate swaps that fix the SOFR component on the new term loan at 2.54% through the loan’s maturity. Based on our leverage as of September 30, 2022, and inclusive of a 10 - basis point LIBOR - to - SOFR spread adjustment, our interest rate on the new term loan is 4.15%. • As a result of this quarter’s debt activity, including the Company’s credit facility amendment, new term loan and related int ere st rate swaps, the Company’s total indebtedness consists of approximately 80% fixed debt at September 30, 2022. The fixed debt totaled $558.4 million on a gross basis at September 30, 2022, with a weighted average interest rate of 3.75% at current leverage and weighted average mat urity of 4.0 years. Due to the Company’s forward swap structures, the weighted average interest rate on fixed debt will improve over the nex t few years. Weighted average interest rates on the Company’s fixed debt are expected to decrease to approximately 3.67% in 2023, 3.5 0% in 2024, and 3.43% in 2025, based on the Company’s current leverage. • During the quarter we transitioned all our current and forward - starting interest rate swaps (aggregate $350 million notional val ue, which equals the total principal amount of the original $350 million term loan in our credit facility) from LIBOR - based swaps to SOFR - based swaps. See page 15 for detail related to our interest rate swaps. • Leverage as of September 30, 2022 was 47.6%, compared to 46.2% as of June 30, 2022. • As of November 1, 2022, we had unutilized borrowing capacity of $243.8 million. Third Quarter 2022 Operating Summary Common and Preferred Dividends Investment Activity Capital Markets and Debt Activity Business Summary 7
Environmental Social Governance During the first quarter, we issued our inaugural Corporate Social Responsibility Report, which is available at https://www.globalmedicalreit.com/about/corporate - responsibility/ ESG Summary 8 3Q - 2022| Earnings Supplemental • We continue our efforts to quantify the energy consumption of our portfolio. For the 2021 GRESB assessment report we were able to increased our portfolio reporting coverage area to 51% and received an increased score of 46. • We utilize the ENERGY STAR platform to collect and track our energy consumption data and have identified properties that are strong candidates for the ENERGY STAR certificate program. • We successfully completed our third project with Georgetown University Steers Center for Global Real Estate, Steers Advisory Services program. This engagement evaluated the means and methods of our utility data collection and provided actionable recommendations on improving the process for consistent quality assurance and impact. This work product will be used to establish methodology for future consumption reduction plans, and improved uniformity of data for reporting and communication purposes. • We incorporate climate risks and environmental sustainability assessments in our due diligence process. This has yielded actionable energy consumption mitigation recommendations and immediate access to utility consumption information. Collecting this information as part of our asset evaluation supports our ESG approach of Alignment. Our Board continues to lead our social and governance efforts. With its diverse composition, our Board is a strong example of inclusive leadership with their composition of 33% women and 55% of individuals from underrepresented groups. • Our Board has been recognized by “Women on Boards” and our executive team reflects our demographically diverse staff. • Our Phoenix, Arizona metro area pilot project with Ride United continued with great success. We provided 1,070 healthcare related rides to individuals in need. 60% of the rides were to medical, dental and eye appointments; 15% were to pharmacy appointments; 12% to substance use support; 10% to mental health support. We will continue to support this program in Phoenix and expect to expand to support a similar program in Orlando, Florida. • Our commitment to employee engagement remains a high - priority, as we continue to make accommodations for health, safety, and work - life balance. With this commitment in mind, and with the compensation committee of the Board’s leadership, we conducted an employee survey that covered a comprehensive range of subjects related to our employees’ attitudes about our work culture, compensation components, as well as demographic and identification data. • The Board continued to improve our corporate governance structure by adopting an incentive compensation recoupment ( clawback ) policy during the first quarter. • The Board formed a standing ESG committee that oversees the Company’s environmental, social, governance and resilience efforts. • GMRE is a member of National Association of Corporate Directors.
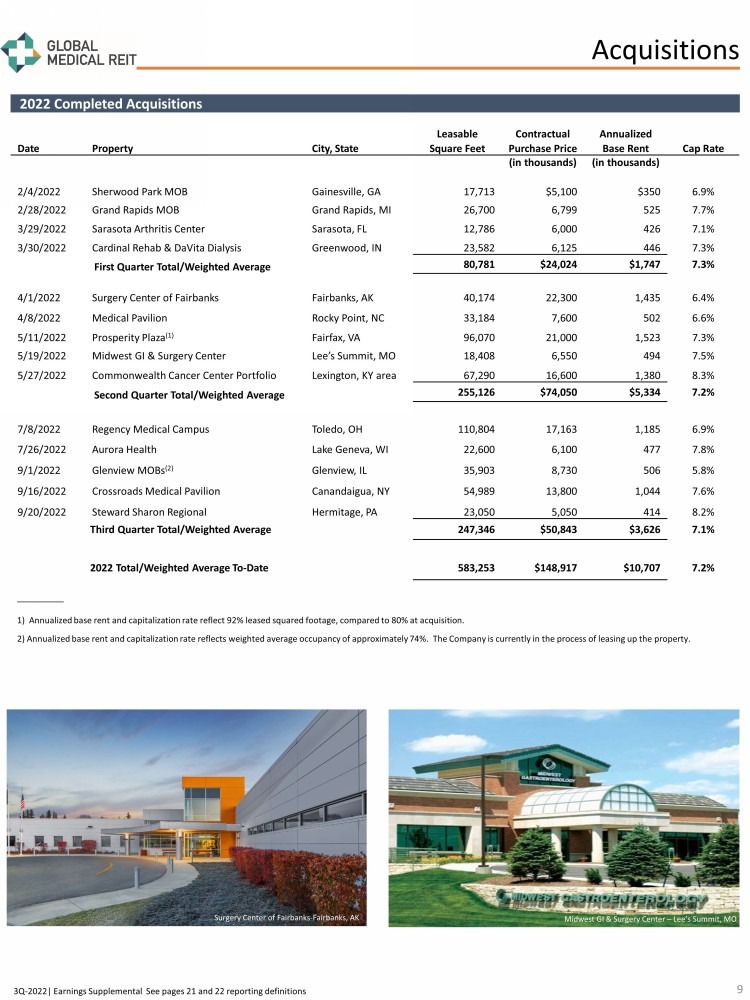
2022 Completed Acquisitions 3Q - 2022| Earnings Supplemental See pages 21 and 22 reporting definitions . Date Property City, State Leasable Square Feet Contractual Purchase Price Annualized Base Rent Cap Rate (in thousands) (in thousands) 2/4/2022 Sherwood Park MOB Gainesville, GA 17,713 $5,100 $350 6.9% 2/28/2022 Grand Rapids MOB Grand Rapids, MI 26,700 6,799 525 7.7% 3/29/2022 Sarasota Arthritis Center Sarasota, FL 12,786 6,000 426 7.1% 3/30/2022 Cardinal Rehab & DaVita Dialysis Greenwood, IN 23,582 6,125 446 7.3% First Quarter Total/Weighted Average 80,781 $24,024 $1,747 7.3% 4/1/2022 Surgery Center of Fairbanks Fairbanks, AK 40,174 22,300 1,435 6.4% 4/8/2022 Medical Pavilion Rocky Point, NC 33,184 7,600 502 6.6% 5/11/2022 Prosperity Plaza (1) Fairfax, VA 96,070 21,000 1,523 7.3% 5/19/2022 Midwest GI & Surgery Center Lee’s Summit, MO 18,408 6,550 494 7.5% 5/27/2022 Commonwealth Cancer Center Portfolio Lexington, KY area 67,290 16,600 1,380 8.3% Second Quarter Total/Weighted Average 255,126 $74,050 $5,334 7.2% 7/8/2022 Regency Medical Campus Toledo, OH 110,804 17,163 1,185 6.9% 7/26/2022 Aurora Health Lake Geneva, WI 22,600 6,100 477 7.8% 9/1/2022 Glenview MOBs (2) Glenview, IL 35,903 8,730 506 5.8% 9/16/2022 Crossroads Medical Pavilion Canandaigua, NY 54,989 13,800 1,044 7.6% 9/20/2022 Steward Sharon Regional Hermitage, PA 23,050 5,050 414 8.2% Third Quarter Total/Weighted Average 247,346 $50,843 $3,626 7.1% 2022 Total/Weighted Average To - Date 583,253 $148,917 $10,707 7.2% Acquisitions 9 __________ 1) Annualized base rent and capitalization rate reflect 92% leased squared footage, compared to 80% at acquisition. 2) Annualized base rent and capitalization rate reflects weighted average occupancy of approximately 74%. The Company is cur ren tly in the process of leasing up the property. Surgery Center of Fairbanks - Fairbanks, AK Midwest GI & Surgery Center – Lee’s Summit, MO
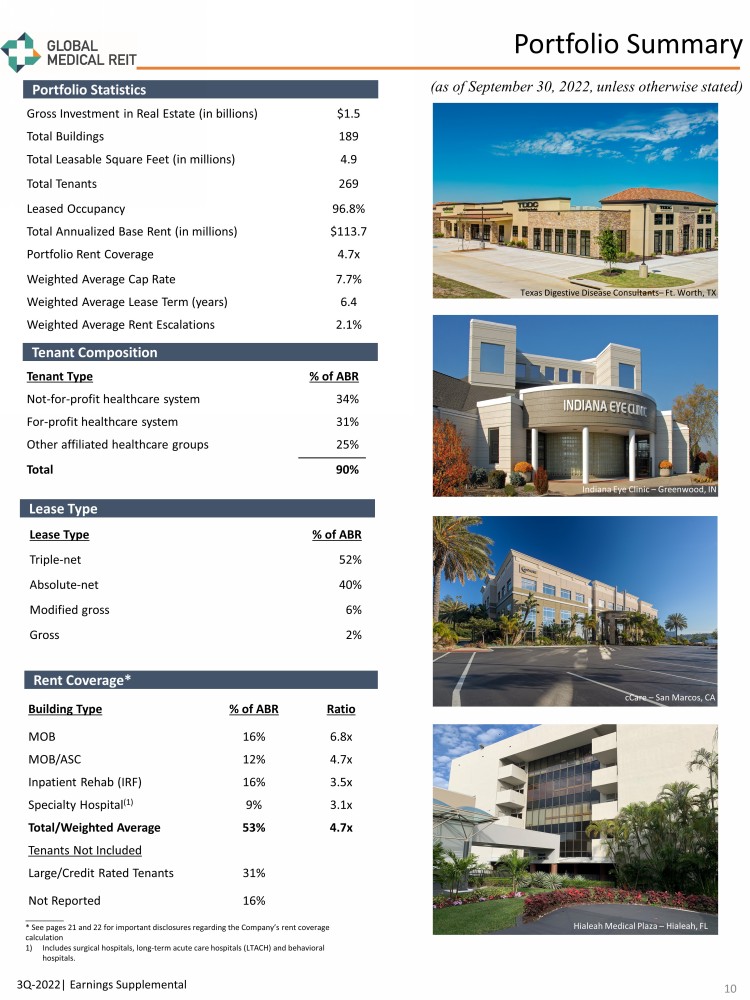
Gross Investment in Real Estate (in billions) $1.5 Total Buildings 189 Total Leasable Square Feet (in millions) 4.9 Total Tenants 269 Leased Occupancy 96.8% Total Annualized Base Rent (in millions) $113.7 Portfolio Rent Coverage 4.7x Weighted Average Cap Rate 7.7% Weighted Average Lease Term (years) 6.4 Weighted Average Rent Escalations 2.1% (as of September 30, 2022, unless otherwise stated) Lease Type % of ABR Triple - net 52% Absolute - net 40% Modified gross 6% Gross 2% Building Type % of ABR Ratio MOB 16% 6.8x MOB/ASC 12% 4.7x Inpatient Rehab (IRF) 16% 3.5x Specialty Hospital (1) 9% 3.1x Total/Weighted Average 53% 4.7x Tenants Not Included Large/Credit Rated Tenants 31% Not Reported 16% Portfolio Statistics Lease Type Rent Coverage* Portfolio Summary 10 3Q - 2022| Earnings Supplemental Indiana Eye Clinic – Greenwood, IN Texas Digestive Disease Consultants – Ft. Worth, TX cCare – San Marcos, CA cCare – San Marcos, CA _________ * See pages 21 and 22 for important disclosures regarding the Company’s rent coverage calculation 1) Includes surgical hospitals, long - term acute care hospitals (LTACH) and behavioral hospitals. Tenant Composition Tenant Type % of ABR Not - for - profit healthcare system 34% For - profit healthcare system 31% Other affiliated healthcare groups 25% Total 90% Hialeah Medical Plaza – Hialeah, FL
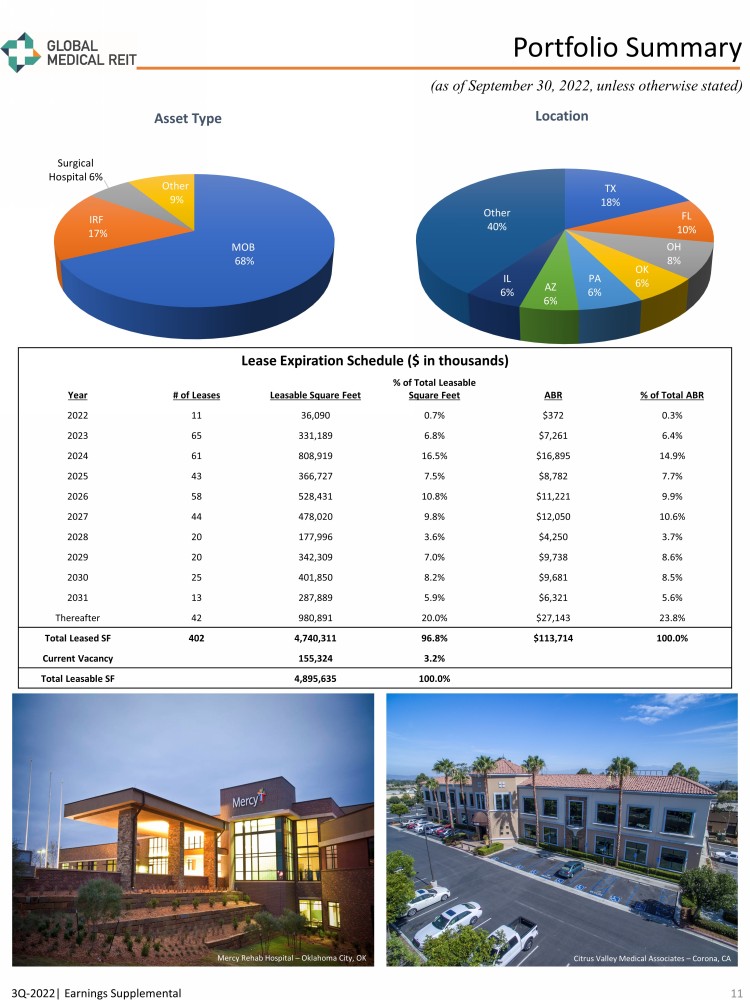
(as of September 30, 2022, unless otherwise stated) MOB 68% IRF 17% Surgical Hospital 6% Other 9% Asset Type TX 18% FL 10% OH 8% OK 6% PA 6% AZ 6% IL 6% Other 40% Location Citrus Valley – Corona CA Citrus Valley Medical Building – Corona, CA Portfolio Summary 11 3Q - 2022| Earnings Supplemental Lease Expiration Schedule ($ in thousands) Year # of Leases Leasable Square Feet % of Total Leasable Square Feet ABR % of Total ABR 2022 11 36,090 0.7% $372 0.3% 2023 65 331,189 6.8% $7,261 6.4% 2024 61 808,919 16.5% $16,895 14.9% 2025 43 366,727 7.5% $8,782 7.7% 2026 58 528,431 10.8% $11,221 9.9% 2027 44 478,020 9.8% $12,050 10.6% 2028 20 177,996 3.6% $4,250 3.7% 2029 20 342,309 7.0% $9,738 8.6% 2030 25 401,850 8.2% $9,681 8.5% 2031 13 287,889 5.9% $6,321 5.6% Thereafter 42 980,891 20.0% $27,143 23.8% Total Leased SF 402 4,740,311 96.8% $113,714 100.0% Current Vacancy 155,324 3.2% Total Leasable SF 4,895,635 100.0% Mercy Rehab Hospital – Oklahoma City, OK Citrus Valley Medical Associates – Corona, CA
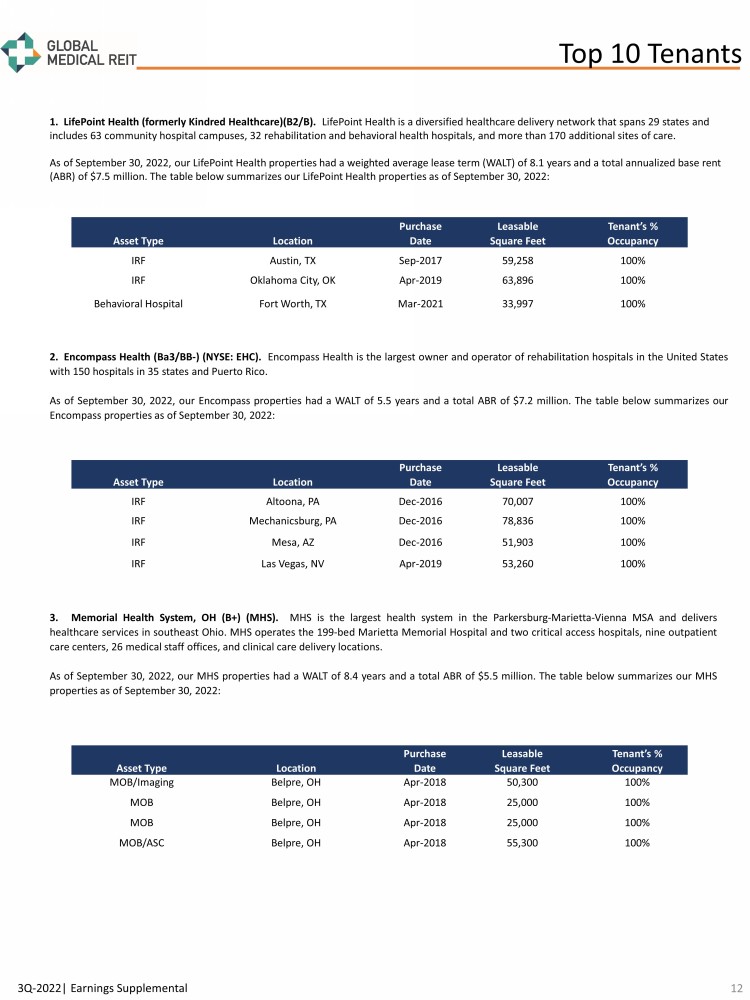
2. Encompass Health (Ba 3 /BB - ) (NYSE : EHC) . Encompass Health is the largest owner and operator of rehabilitation hospitals in the United States with 150 hospitals in 35 states and Puerto Rico . As of September 30 , 2022 , our Encompass properties had a WALT of 5 . 5 years and a total ABR of $ 7 . 2 million . The table below summarizes our Encompass properties as of September 30 , 2022 : 3Q - 2022| Earnings Supplemental 1. LifePoint Health (formerly Kindred Healthcare)(B2/B). LifePoint Health is a diversified healthcare delivery network that spans 29 states and includes 63 community hospital campuses, 32 rehabilitation and behavioral health hospitals, and more than 170 additional site s o f care. As of September 30, 2022, our LifePoint Health properties had a weighted average lease term (WALT) of 8.1 years and a total a nnu alized base rent (ABR) of $7.5 million. The table below summarizes our LifePoint Health properties as of September 30, 2022: Asset Type Location Purchase Date Leasable Square Feet Tenant’s % Occupancy IRF Austin, TX Sep - 2017 59,258 100% IRF Oklahoma City, OK Apr - 2019 63,896 100% Behavioral Hospital Fort Worth, TX Mar - 2021 33,997 100% Asset Type Location Purchase Date Leasable Square Feet Tenant’s % Occupancy IRF Altoona, PA Dec - 2016 70,007 100% IRF Mechanicsburg, PA Dec - 2016 78,836 100% IRF Mesa, AZ Dec - 2016 51,903 100% IRF Las Vegas, NV Apr - 2019 53,260 100% Top 10 Tenant s 12 3. Memorial Health System, OH (B+) (MHS) . MHS is the largest health system in the Parkersburg - Marietta - Vienna MSA and delivers healthcare services in southeast Ohio . MHS operates the 199 - bed Marietta Memorial Hospital and two critical access hospitals, nine outpatient care centers, 26 medical staff offices, and clinical care delivery locations . As of September 30 , 2022 , our MHS properties had a WALT of 8 . 4 years and a total ABR of $ 5 . 5 million . The table below summarizes our MHS properties as of September 30 , 2022 : Asset Type Location Purchase Date Leasable Square Feet Tenant’s % Occupancy MOB/Imaging Belpre, OH Apr - 2018 50,300 100% MOB Belpre, OH Apr - 2018 25,000 100% MOB Belpre, OH Apr - 2018 25,000 100% MOB/ASC Belpre, OH Apr - 2018 55,300 100%
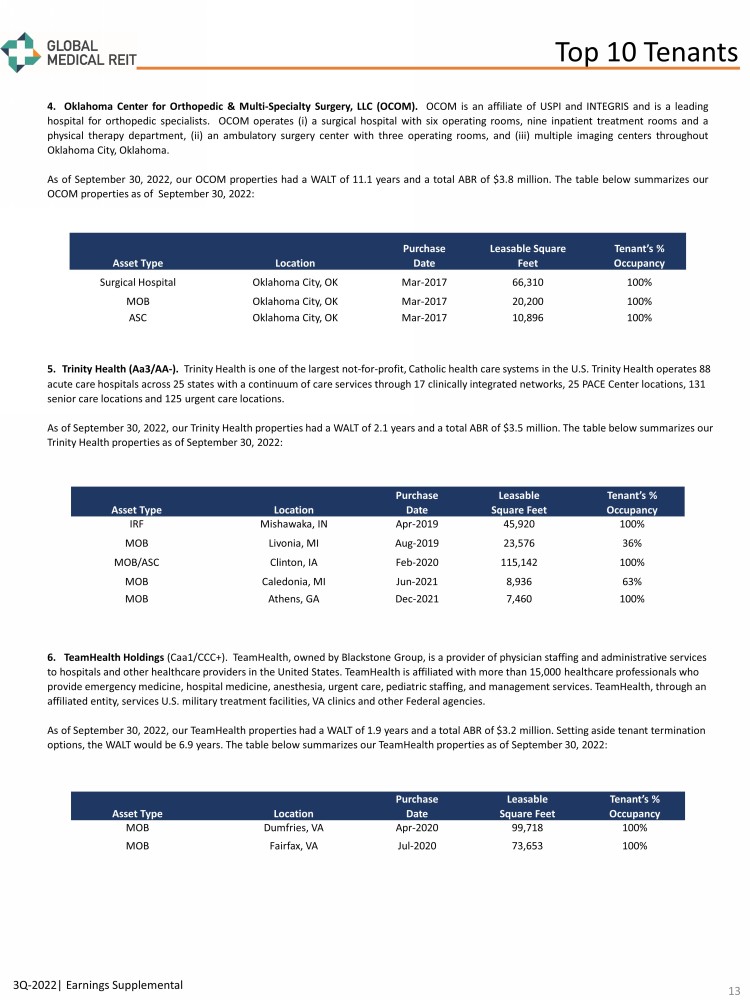
3Q - 2022| Earnings Supplemental 4 . Oklahoma Center for Orthopedic & Multi - Specialty Surgery, LLC (OCOM) . OCOM is an affiliate of USPI and INTEGRIS and is a leading hospital for orthopedic specialists . OCOM operates (i) a surgical hospital with six operating rooms, nine inpatient treatment rooms and a physical therapy department, (ii) an ambulatory surgery center with three operating rooms, and (iii) multiple imaging centers throughout Oklahoma City, Oklahoma . As of September 30 , 2022 , our OCOM properties had a WALT of 11 . 1 years and a total ABR of $ 3 . 8 million . The table below summarizes our OCOM properties as of September 30 , 2022 : Asset Type Location Purchase Date Leasable Square Feet Tenant’s % Occupancy Surgical Hospital Oklahoma City, OK Mar - 2017 66,310 100% MOB Oklahoma City, OK Mar - 2017 20,200 100% ASC Oklahoma City, OK Mar - 2017 10,896 100% Top 10 Tenants 13 5. Trinity Health (Aa3/AA - ). Trinity Health is one of the largest not - for - profit, Catholic health care systems in the U.S. Trinity Health operates 88 acute care hospitals across 25 states with a continuum of care services through 17 clinically integrated networks, 25 PACE Ce nte r locations, 131 senior care locations and 125 urgent care locations. As of September 30, 2022, our Trinity Health properties had a WALT of 2.1 years and a total ABR of $3.5 million . The table below summarizes our Trinity Health properties as of September 30, 2022: Asset Type Location Purchase Date Leasable Square Feet Tenant’s % Occupancy IRF Mishawaka, IN Apr - 2019 45,920 100% MOB Livonia, MI Aug - 2019 23,576 36% MOB/ASC Clinton, IA Feb - 2020 115,142 100% MOB Caledonia, MI Jun - 2021 8,936 63% MOB Athens, GA Dec - 2021 7,460 100% 6. TeamHealth Holdings (Caa1/CCC+). TeamHealth, owned by Blackstone Group, is a provider of physician staffing and administrative services to hospitals and other healthcare providers in the United States. TeamHealth is affiliated with more than 15,000 healthcare p rof essionals who provide emergency medicine, hospital medicine, anesthesia, urgent care, pediatric staffing, and management services. TeamHeal th, through an affiliated entity, services U.S. military treatment facilities, VA clinics and other Federal agencies. As of September 30, 2022, our TeamHealth properties had a WALT of 1.9 years and a total ABR of $3.2 million . Setting aside tenant termination options, the WALT would be 6.9 years. The table below summarizes our TeamHealth properties as of September 30, 2022: Asset Type Location Purchase Date Leasable Square Feet Tenant’s % Occupancy MOB Dumfries, VA Apr - 2020 99,718 100% MOB Fairfax, VA Jul - 2020 73,653 100%
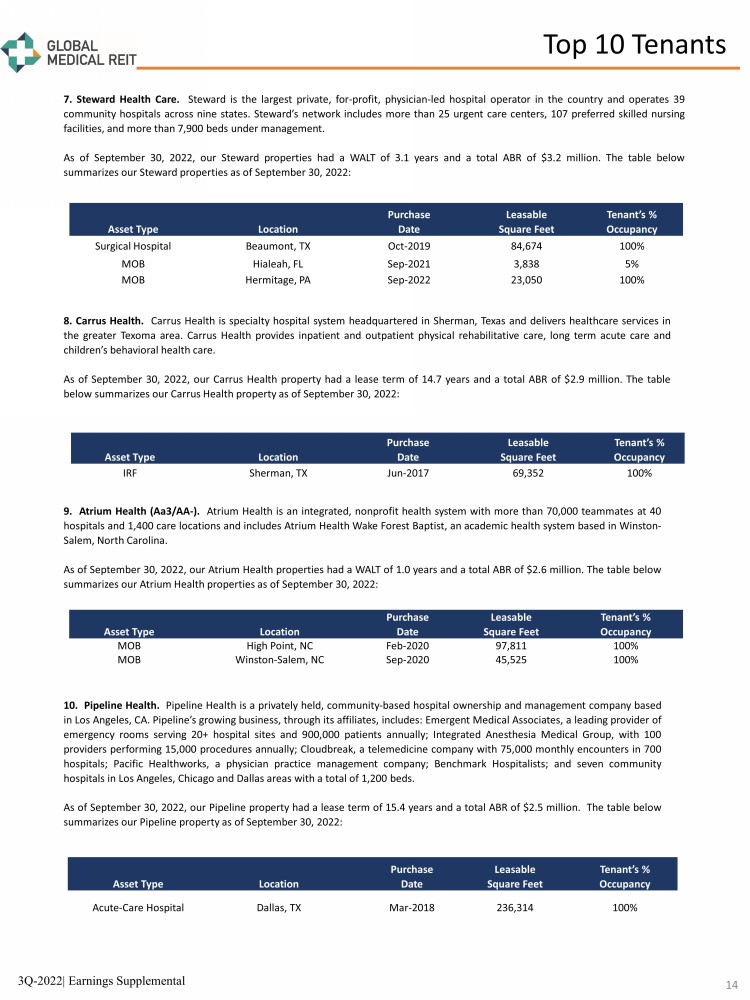
3Q - 2022| Earnings Supplemental 7 . Steward Health Care . Steward is the largest private, for - profit, physician - led hospital operator in the country and operates 39 community hospitals across nine states . Steward’s network includes more than 25 urgent care centers, 107 preferred skilled nursing facilities, and more than 7 , 900 beds under management . As of September 30 , 2022 , our Steward properties had a WALT of 3 . 1 years and a total ABR of $ 3 . 2 million . The table below summarizes our Steward properties as of September 30 , 2022 : Asset Type Location Purchase Date Leasable Square Feet Tenant’s % Occupancy Surgical Hospital Beaumont, TX Oct - 2019 84,674 100% MOB Hialeah, FL Sep - 2021 3,838 5% MOB Hermitage, PA Sep - 2022 23,050 100% 8 . Carrus Health . Carrus Health is specialty hospital system headquartered in Sherman, Texas and delivers healthcare services in the greater Texoma area . Carrus Health provides inpatient and outpatient physical rehabilitative care, long term acute care and children’s behavioral health care . As of September 30 , 2022 , our Carrus Health property had a lease term of 14 . 7 years and a total ABR of $ 2 . 9 million . The table below summarizes our Carrus Health property as of September 30 , 2022 : Asset Type Location Purchase Date Leasable Square Feet Tenant’s % Occupancy IRF Sherman, TX Jun - 2017 69,352 100% Top 10 Tenants 14 9 . Atrium Health (Aa 3 /AA - ) . Atrium Health is an integrated, nonprofit health system with more than 70 , 000 teammates at 40 hospitals and 1 , 400 care locations and includes Atrium Health Wake Forest Baptist, an academic health system based in Winston - Salem, North Carolina . As of September 30 , 2022 , our Atrium Health properties had a WALT of 1 . 0 years and a total ABR of $ 2 . 6 million . The table below summarizes our Atrium Health properties as of September 30 , 2022 : Asset Type Location Purchase Date Leasable Square Feet Tenant’s % Occupancy MOB High Point, NC Feb - 2020 97,811 100% MOB Winston - Salem, NC Sep - 2020 45,525 100% 10 . Pipeline Health . Pipeline Health is a privately held, community-based hospital ownership and management company based in Los Angeles, CA . Pipeline’s growing business, through its affiliates, includes : Emergent Medical Associates, a leading provider of emergency rooms serving 20 + hospital sites and 900 , 000 patients annually ; Integrated Anesthesia Medical Group, with 100 providers performing 15 , 000 procedures annually ; Cloudbreak , a telemedicine company with 75 , 000 monthly encounters in 700 hospitals ; Pacific Healthworks, a physician practice management company ; Benchmark Hospitalists ; and seven community hospitals in Los Angeles, Chicago and Dallas areas with a total of 1 , 200 beds . As of September 30 , 2022 , our Pipeline property had a lease term of 15 . 4 years and a total ABR of $ 2 . 5 million . The table below summarizes our Pipeline property as of September 30 , 2022 : Asset Type Location Purchase Date Leasable Square Feet Tenant’s % Occupancy Acute - Care Hospital Dallas, TX Mar - 2018 236,314 100%
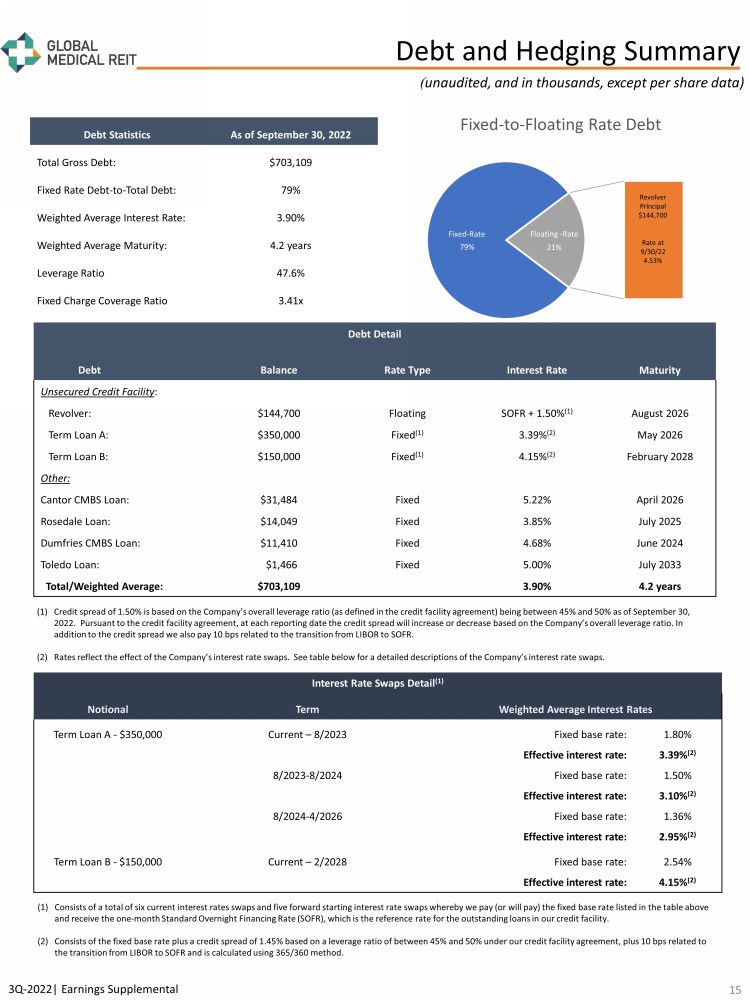
3Q - 2022| Earnings Supplemental ( unaudited, and in thousands, except per share data) Debt and Hedging Summary 15 Debt Detail Debt Balance Rate Type Interest Rate Maturity Unsecured Credit Facility : Revolver : $144,700 Floating SOFR + 1.50% (1) August 2026 Term Loan A: $350,000 Fixed (1) 3.39% (2) May 2026 Term Loan B: $150,000 Fixed (1) 4.15% (2) February 2028 Other: Cantor CMBS Loan: $31,484 Fixed 5.22% April 2026 Rosedale Loan: $14,049 Fixed 3.85% July 2025 Dumfries CMBS Loan: $11,410 Fixed 4.68% June 2024 Toledo Loan: $1,466 Fixed 5.00% July 2033 Total/Weighted Average: $703,109 3.90% 4.2 years (1) Credit spread of 1.50% is based on the Company’s overall leverage ratio (as defined in the credit facility agreement) being b etw een 45% and 50% as of September 30, 2022. Pursuant to the credit facility agreement, at each reporting date the credit spread will increase or decrease based on th e Company’s overall leverage ratio. In addition to the credit spread we also pay 10 bps related to the transition from LIBOR to SOFR. (2) Rates reflect the effect of the Company’s interest rate swaps. See table below for a detailed descriptions of the Company’s int erest rate swaps. (1) Consists of a total of six current interest rates swaps and five forward starting interest rate swaps whereby we pay (or will pa y) the fixed base rate listed in the table above and receive the one - month Standard Overnight Financing Rate (SOFR), which is the reference rate for the outstanding loans in our credit facility. (2) Consists of the fixed base rate plus a credit spread of 1.45% based on a leverage ratio of between 45% and 50% under our cred it facility agreement, plus 10 bps related to the transition from LIBOR to SOFR and is calculated using 365/360 method. Interest Rate Swaps Detail (1) Notional Term Weighted Average Interest Rates Term Loan A - $350,000 Current – 8/2023 Fixed base rate: 1.80% Effective interest rate: 3.39% (2) 8/2023 - 8/2024 Fixed base rate: 1.50% Effective interest rate: 3.10% (2) 8/2024 - 4/2026 Fixed base rate: 1.36% Effective interest rate: 2.95% (2) Term Loan B - $150,000 Current – 2/2028 Fixed base rate: 2.54% Effective interest rate: 4.15% (2) Debt Statistics As of September 30, 2022 Total Gross Debt: $703,109 Fixed Rate Debt - to - Total Debt: 79% Weighted Average Interest Rate: 3.90% Weighted Average Maturity: 4.2 years Leverage Ratio 47.6% Fixed Charge Coverage Ratio 3.41x 79% 21% 21% Fixed - to - Floating Rate Debt Fixed - Rate Floating - Rate Revolver Principal $144,700 Rate at 9/30/22 4.53%
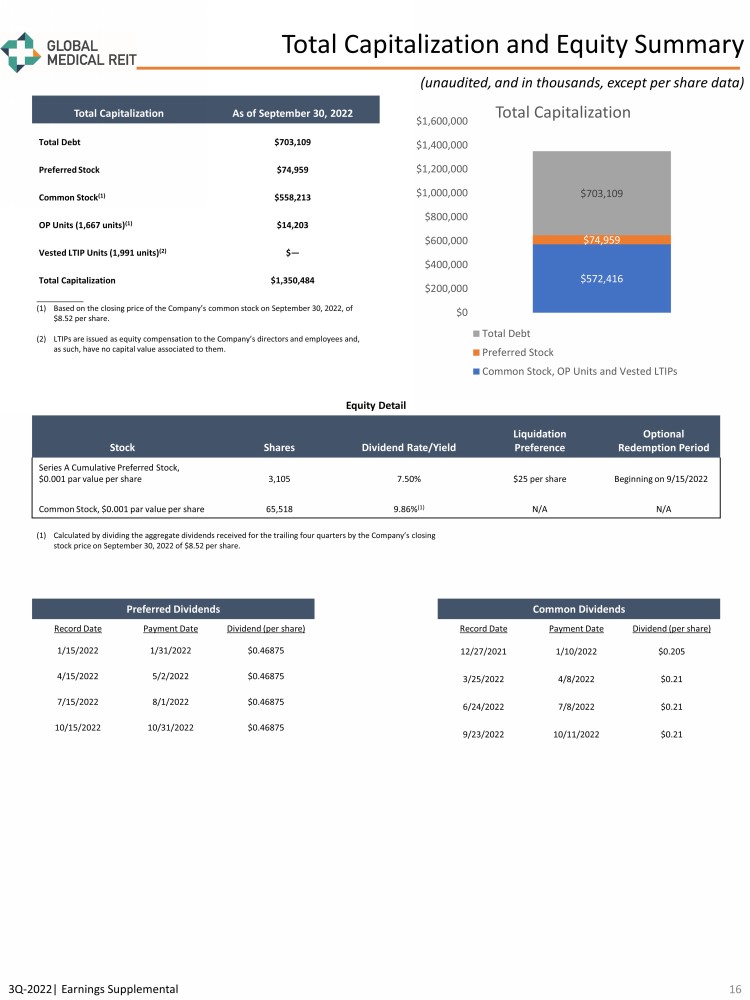
16 Total Capitalization and Equity Summary (unaudited, and in thousands, except per share data) Equity Detail Stock Shares Dividend Rate/Yield Liquidation Preference Optional Redemption Period Series A Cumulative Preferred Stock, $0.001 par value per share 3,105 7.50% $25 per share Beginning on 9/15/2022 Common Stock, $0.001 par value per share 65,518 9.86% (1) N/A N/A Preferred Dividends Record Date Payment Date Dividend (per share) 1/15/2022 1/31/2022 $0.46875 4/15/2022 5/2/2022 $0.46875 7/15/2022 8/1/2022 $0.46875 10/15/2022 10/31/2022 $0.46875 Common Dividends Record Date Payment Date Dividend (per share) 12/27/2021 1/10/2022 $0.205 3/25/2022 4/8/2022 $0.21 6/24/2022 7/8/2022 $0.21 9/23/2022 10/11/2022 $0.21 3Q - 2022| Earnings Supplemental (1) Calculated by dividing the aggregate dividends received for the trailing four quarters by the Company’s closing stock price on September 30, 2022 of $8.52 per share. ___________ (1) Based on the closing price of the Company’s common stock on September 30, 2022, of $8.52 per share. (2) LTIPs are issued as equity compensation to the Company’s directors and employees and, as such, have no capital value associated to them. $572,416 $74,959 $703,109 $0 $200,000 $400,000 $600,000 $800,000 $1,000,000 $1,200,000 $1,400,000 $1,600,000 Total Capitalization Total Debt Preferred Stock Common Stock, OP Units and Vested LTIPs Total Capitalization As of September 30, 2022 Total Debt $703,109 Preferred Stock $74,959 Common Stock (1) $558,213 OP Units (1,667 units) (1) $14,203 Vested LTIP Units (1,991 units) (2) $ — Total Capitalization $1,350,484
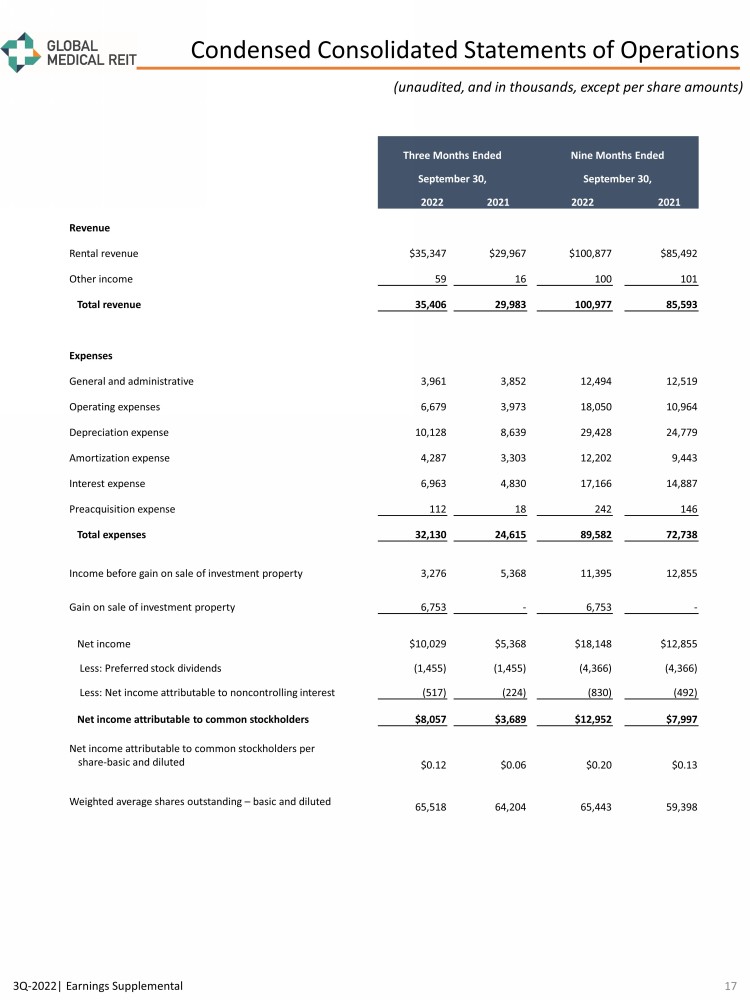
3Q - 2022| Earnings Supplemental (unaudited, and in thousands, except per share amounts) Three Months Ended Nine Months Ended September 30, September 30, 2022 2021 2022 2021 Revenue Rental revenue $35,347 $29,967 $100,877 $85,492 Other income 59 16 100 101 Total revenue 35,406 29,983 100,977 85,593 Expenses General and administrative 3,961 3,852 12,494 12,519 Operating expenses 6,679 3,973 18,050 10,964 Depreciation expense 10,128 8,639 29,428 24,779 Amortization expense 4,287 3,303 12,202 9,443 Interest expense 6,963 4,830 17,166 14,887 Preacquisition expense 112 18 242 146 Total expenses 32,130 24,615 89,582 72,738 Income before gain on sale of investment property 3,276 5,368 11,395 12,855 Gain on sale of investment property 6,753 - 6,753 - Net income $10,029 $5,368 $18,148 $12,855 Less: Preferred stock dividends (1,455) (1,455) (4,366) (4,366) Less: Net income attributable to noncontrolling interest (517) (224) (830) (492) Net income attributable to common stockholders $8,057 $3,689 $12,952 $7,997 Net income attributable to common stockholders per share - basic and diluted $0.12 $0.06 $0.20 $0.13 Weighted average shares outstanding – basic and diluted 65,518 64,204 65,443 59,398 Condensed Consolidated Statements of Operations 17
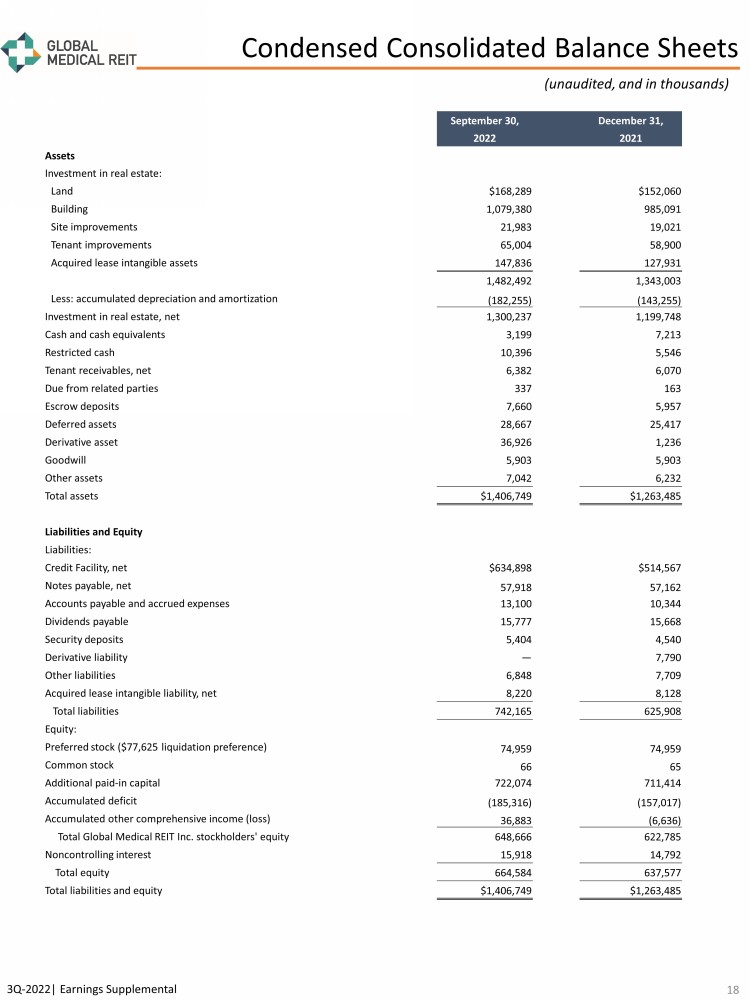
3Q - 2022| Earnings Supplemental (unaudited, and in thousands) September 30, December 31, 2022 2021 Assets Investment in real estate: Land $168,289 $152,060 Building 1,079,380 985,091 Site improvements 21,983 19,021 Tenant improvements 65,004 58,900 Acquired lease intangible assets 147,836 127,931 1,482,492 1,343,003 Less: accumulated depreciation and amortization (182,255) (143,255) Investment in real estate, net 1,300,237 1,199,748 Cash and cash equivalents 3,199 7,213 Restricted cash 10,396 5,546 Tenant receivables, net 6,382 6,070 Due from related parties 337 163 Escrow deposits 7,660 5,957 Deferred assets 28,667 25,417 Derivative asset 36,926 1,236 Goodwill 5,903 5,903 Other assets 7,042 6,232 Total assets $1,406,749 $1,263,485 Liabilities and Equity Liabilities: Credit Facility, net $634,898 $514,567 Notes payable, net 57,918 57,162 Accounts payable and accrued expenses 13,100 10,344 Dividends payable 15,777 15,668 Security deposits 5,404 4,540 Derivative liability — 7,790 Other liabilities 6,848 7,709 Acquired lease intangible liability, net 8,220 8,128 Total liabilities 742,165 625,908 Equity: Preferred stock ($77,625 liquidation preference) 74,959 74,959 Common stock 66 65 Additional paid - in capital 722,074 711,414 Accumulated deficit (185,316) (157,017) Accumulated other comprehensive income (loss) 36,883 (6,636) Total Global Medical REIT Inc. stockholders' equity 648,666 622,785 Noncontrolling interest 15,918 14,792 Total equity 664,584 637,577 Total liabilities and equity $1,406,749 $1,263,485 Condensed Consolidated Balance Sheets 18
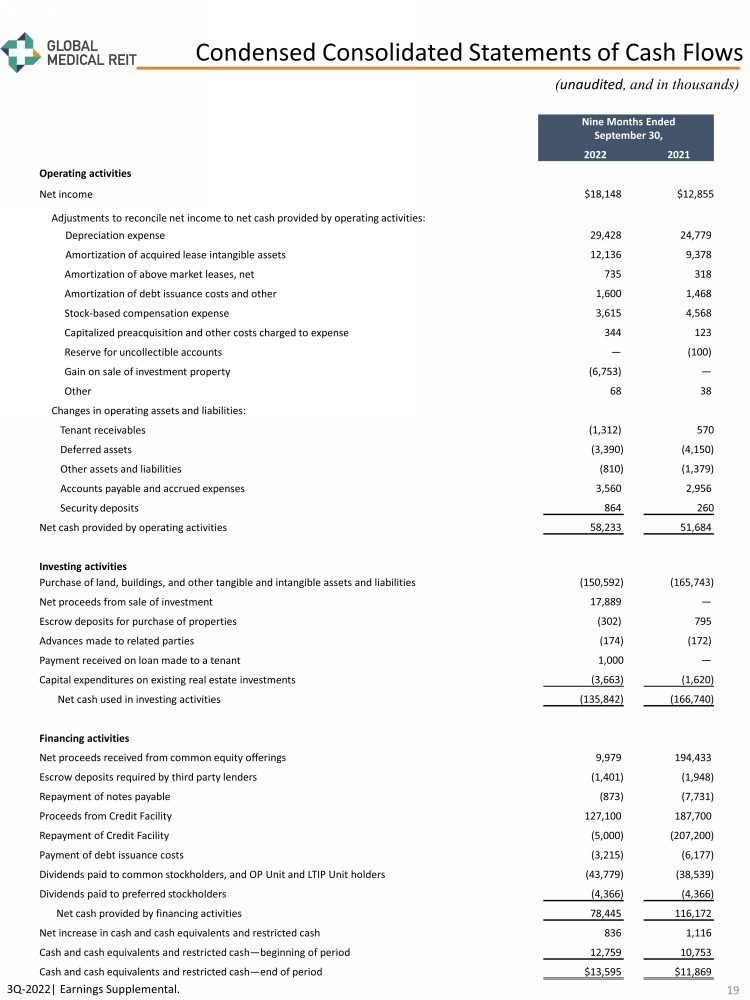
( unaudited , and in thousands) Nine Months Ended September 30, 2022 2021 Operating activities Net income $18,148 $12,855 Adjustments to reconcile net income to net cash provided by operating activities: Depreciation expense 29,428 24,779 Amortization of acquired lease intangible assets 12,136 9,378 Amortization of above market leases, net 735 318 Amortization of debt issuance costs and other 1,600 1,468 Stock - based compensation expense 3,615 4,568 Capitalized preacquisition and other costs charged to expense 344 123 Reserve for uncollectible accounts — (100) Gain on sale of investment property (6,753) — Other 68 38 Changes in operating assets and liabilities: Tenant receivables (1,312) 570 Deferred assets (3,390) (4,150) Other assets and liabilities (810) (1,379) Accounts payable and accrued expenses 3,560 2,956 Security deposits 864 260 Net cash provided by operating activities 58,233 51,684 Investing activities Purchase of land, buildings, and other tangible and intangible assets and liabilities (150,592) (165,743) Net proceeds from sale of investment 17,889 — Escrow deposits for purchase of properties (302) 795 Advances made to related parties (174) (172) Payment received on loan made to a tenant 1,000 — Capital expenditures on existing real estate investments (3,663) (1,620) Net cash used in investing activities (135,842) (166,740) Financing activities Net proceeds received from common equity offerings 9,979 194,433 Escrow deposits required by third party lenders (1,401) (1,948) Repayment of notes payable (873) (7,731) Proceeds from Credit Facility 127,100 187,700 Repayment of Credit Facility (5,000) (207,200) Payment of debt issuance costs (3,215) (6,177) Dividends paid to common stockholders, and OP Unit and LTIP Unit holders (43,779) (38,539) Dividends paid to preferred stockholders (4,366) (4,366) Net cash provided by financing activities 78,445 116,172 Net increase in cash and cash equivalents and restricted cash 836 1,116 Cash and cash equivalents and restricted cash — beginning of period 12,759 10,753 Cash and cash equivalents and restricted cash — end of period $13,595 $11,869 3Q - 2022| Earnings Supplemental. Condensed Consolidated Statements of Cash Flows 19
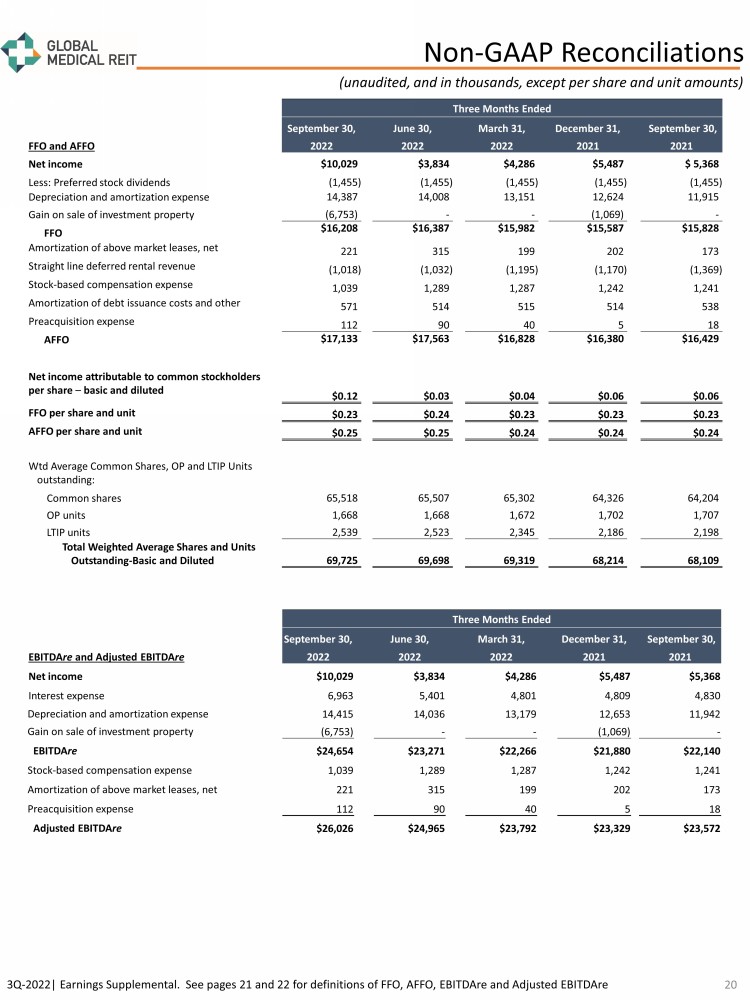
3Q - 2022| Earnings Supplemental. See pages 21 and 22 for definitions of FFO, AFFO, EBITDAre and Adjusted EBITDAre (unaudited, and in thousands, except per share and unit amounts) Three Months Ended September 30, June 30, March 31, December 31, September 30, FFO and AFFO 2022 2022 2022 2021 2021 Net income $10,029 $3,834 $4,286 $5,487 $ 5,368 Less: Preferred stock dividends (1,455) (1,455) (1,455) (1,455) (1,455) Depreciation and amortization expense 14,387 14,008 13,151 12,624 11,915 Gain on sale of investment property (6,753) - - (1,069) - FFO $16,208 $16,387 $15,982 $15,587 $15,828 Amortization of above market leases, net 221 315 199 202 173 Straight line deferred rental revenue (1,018) (1,032) (1,195) (1,170) (1,369) Stock - based compensation expense 1,039 1,289 1,287 1,242 1,241 Amortization of debt issuance costs and other 571 514 515 514 538 Preacquisition expense 112 90 40 5 18 AFFO $17,133 $17,563 $16,828 $16,380 $16,429 Net income attributable to common stockholders per share – basic and diluted $0.12 $0.03 $0.04 $0.06 $0.06 FFO per share and unit $0.23 $0.24 $0.23 $0.23 $0.23 AFFO per share and unit $0.25 $0.25 $0.24 $0.24 $0.24 Wtd Average Common Shares, OP and LTIP Units outstanding: Common shares 65,518 65,507 65,302 64,326 64,204 OP units 1,668 1,668 1,672 1,702 1,707 LTIP units 2,539 2,523 2,345 2,186 2,198 Total Weighted Average Shares and Units Outstanding - Basic and Diluted 69,725 69,698 69,319 68,214 68,109 Three Months Ended September 30, June 30, March 31, December 31, September 30, EBITDA re and Adjusted EBITDA re 2022 2022 2022 2021 2021 Net income $10,029 $3,834 $4,286 $5,487 $5,368 Interest expense 6,963 5,401 4,801 4,809 4,830 Depreciation and amortization expense 14,415 14,036 13,179 12,653 11,942 Gain on sale of investment property (6,753) - - (1,069) - EBITDA re $24,654 $23,271 $22,266 $21,880 $22,140 Stock - based compensation expense 1,039 1,289 1,287 1,242 1,241 Amortization of above market leases, net 221 315 199 202 173 Preacquisition expense 112 90 40 5 18 Adjusted EBITDA re $26,026 $24,965 $23,792 $23,329 $23,572 Non - GAAP Reconciliations 20
Reporting Definitions Annualized Base Rent Annualized base rent represents monthly base rent for most recent month or month of acquisition, multiplied by 12 ( or estimated NOI where more reflective of property performance) . Accordingly, this methodology produces an annualized amount as of a point in time but does not take into account future contractual rental rate increases . Additionally, properties that are accounted for on a cash - collected basis are not included annualized base rent . Capitalization Rate The capitalization rate (“Cap Rate”) for an acquisition is calculated by dividing current Annualized Base Rent by contractual purchase price . For the portfolio capitalization rate, certain adjustments, including for subsequent capital invested, are made to the contractual purchase price . Earnings Before Interest, Taxes, Depreciation and Amortization for Real Estate ( EBITDA re and Adjusted EBITDA re ) We calculate EBITDA re in accordance with standards established by NAREIT and define EBITDA re as net income or loss computed in accordance with GAAP plus depreciation and amortization, interest expense, gain or loss on the sale of investment properties, and impairment loss, as applicable . We define Adjusted EBITDA re as EBITDA re plus non - cash stock compensation expense, non - cash intangible amortization related to above and below market leases, preacquisition expense and other normalizing items . Management considers EBITDA re and Adjusted EBITDA re important measures because they provide additional information to allow management, investors, and our current and potential creditors to evaluate and compare our core operating results and our ability to service debt . Funds from Operations and Adjusted Funds from Operations Funds from operations (“FFO”) and adjusted funds from operations (“AFFO”) are non - GAAP financial measures within the meaning of the rules of the SEC . The Company considers FFO and AFFO to be important supplemental measures of its operating performance and believes FFO is frequently used by securities analysts, investors, and other interested parties in the evaluation of REITs, many of which present FFO when reporting their results . In accordance with the National Association of Real Estate Investment Trusts’ (“NAREIT”) definition, FFO means net income or loss computed in accordance with GAAP before noncontrolling interests of holders of OP units and LTIP units, excluding gains (or losses) from sales of property and extraordinary items, less preferred stock dividends, plus real estate - related depreciation and amortization (excluding amortization of debt issuance costs and the amortization of above and below market leases), and after adjustments for unconsolidated partnerships and joint ventures . Because FFO excludes real estate - related depreciation and amortization (other than amortization of debt issuance costs and above and below market lease amortization expense), the Company believes that FFO provides a performance measure that, when compared period - over - period, reflects the impact to operations from trends in occupancy rates, rental rates, operating costs, development activities and interest costs, providing perspective not immediately apparent from the closest GAAP measurement, net income or loss . AFFO is a non - GAAP measure used by many investors and analysts to measure a real estate company’s operating performance by removing the effect of items that do not reflect ongoing property operations . Management calculates AFFO by modifying the NAREIT computation of FFO by adjusting it for certain cash and non - cash items and certain recurring and non - recurring items . For the Company these items include recurring acquisition and disposition costs, loss on the extinguishment of debt, recurring straight line deferred rental revenue, recurring stock - based compensation expense, recurring amortization of above and below market leases, recurring amortization of debt issuance costs, recurring lease commissions, and other items . Management believes that reporting AFFO in addition to FFO is a useful supplemental measure for the investment community to use when evaluating the operating performance of the Company on a comparative basis . (as of September 30, 2022) 3Q - 2022| Earnings Supplemental Reporting Definitions and Other Disclosures 21
Reporting Definitions (continued) Rent Coverage Ratio For purposes of calculating our portfolio weighted - average EBITDARM coverage ratio (“Rent Coverage Ratio”), we excluded credit - rated tenants or their subsidiaries for which financial statements were either not available or not sufficiently detailed . These ratios are based on latest available information only . Most tenant financial statements are unaudited and we have not independently verified any tenant financial information (audited or unaudited) and, therefore, we cannot assure you that such information is accurate or complete . Certain other tenants (approximately 16 . 4 % of our portfolio) are excluded from the calculation due to (i) lack of available financial information or (ii) small tenant size . Additionally, included within 16 . 4 % of non - reporting tenants is Pipeline Healthcare, which filed for Chapter 11 bankruptcy protection in October of 2022 . Additionally, our Rent Coverage Ratio adds back physician distributions and compensation . Management believes all adjustments are reasonable and necessary . Other Disclosures Non - GAAP Financial Measures Management considers certain non - GAAP financial measures to be useful supplemental measures of the Company's operating performance . For the Company, non - GAAP measures consist of EBITDA re , Adjusted EBITDA re , FFO and AFFO . A non - GAAP financial measure is generally defined as one that purports to measure financial performance, financial position or cash flows, but excludes or includes amounts that would not be so adjusted in the most comparable measure determined in accordance with GAAP . The Company reports non - GAAP financial measures because these measures are observed by management to also be among the most predominant measures used by the REIT industry and by industry analysts to evaluate REITs . For these reasons, management deems it appropriate to disclose and discuss these non - GAAP financial measures . The non - GAAP financial measures presented herein are not necessarily identical to those presented by other real estate companies due to the fact that not all real estate companies use the same definitions . These measures should not be considered as alternatives to net income, as indicators of the Company's financial performance, or as alternatives to cash flow from operating activities as measures of the Company's liquidity, nor are these measures necessarily indicative of sufficient cash flow to fund all of the Company's needs . Management believes that in order to facilitate a clear understanding of the Company's historical consolidated operating results, these measures should be examined in conjunction with net income and cash flows from operations as presented elsewhere herein . Additional Information The information in this document should be read in conjunction with the Company’s Annual Report on Form 10 - K, Quarterly Reports on Form 10 - Q, Current Reports on Form 8 - K, and other information filed with, or furnished to, the SEC . You can access the Company’s reports and amendments to those reports filed or furnished to the SEC pursuant to Section 13 (a) or 15 (d) of the Exchange Act in the “Investor Relations” section on the Company’s website (www . globalmedicalreit . com) under “SEC Filings” as soon as reasonably practicable after they are filed with, or furnished to, the SEC . The information on or connected to the Company’s website is not, and shall not be deemed to be, a part of, or incorporated into, this Earnings Supplemental . You also can review these SEC filings and other information by accessing the SEC’s website at http : //www . sec . gov . Certain information contained in this package, including, but not limited to, information contained in our Top 10 tenant profiles is derived from publicly - available third - party sources . The Company has not independently verified this information and there can be no assurance that such information is accurate or complete . ( as of September 30, 2022) 3Q - 2022| Earnings Supplemental Reporting Definitions and Other Disclosures 22
Stephen Swett stephen.swett@icrinc.com 203.682.8377 www.globalmedicalreit.com NYSE: GMRE INVESTOR RELATIONS