Exhibit 99.1
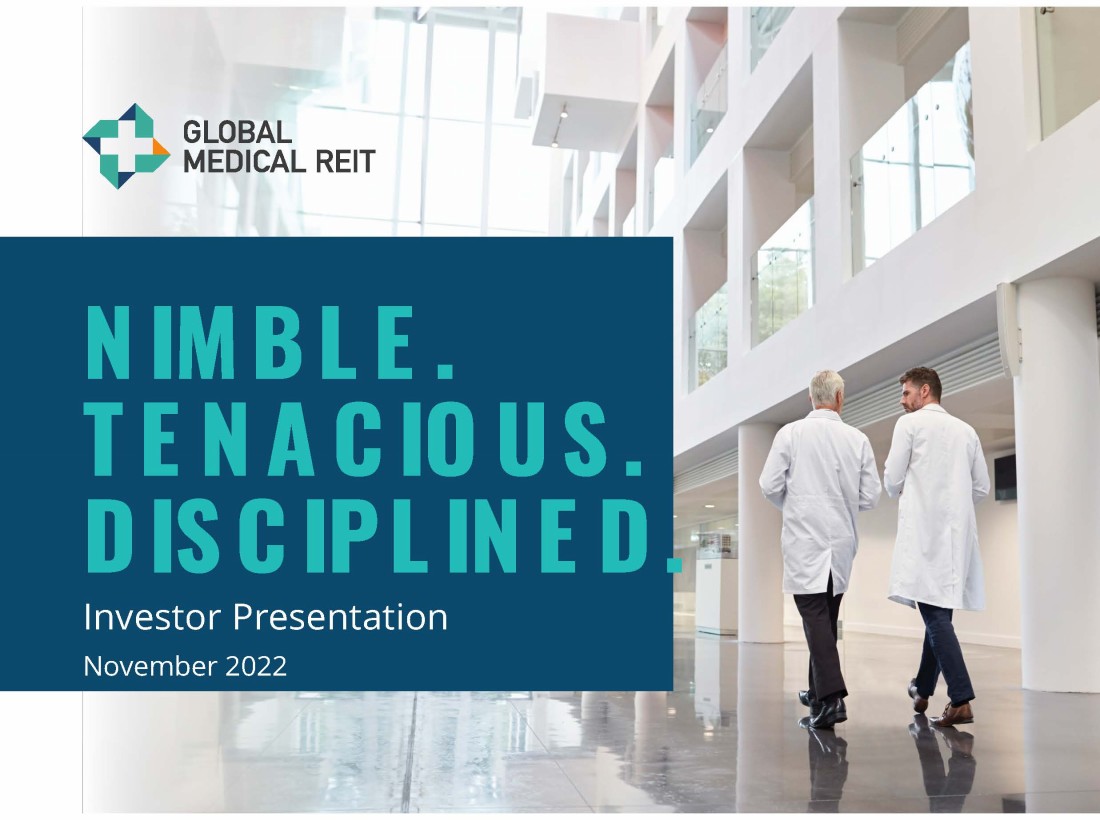
NIMBLE. TENACIOUS. DISCIPLINED. Investor Presentation November 2022
Our goal is to deliver attractive, risk - adjusted returns by investing in quality healthcare assets. As a primarily net - leased medical office real estate investment trust (REIT), we target properties operated by profitable healthcare systems or physician groups that are at the forefront of delivering needed care in their local communities. 2
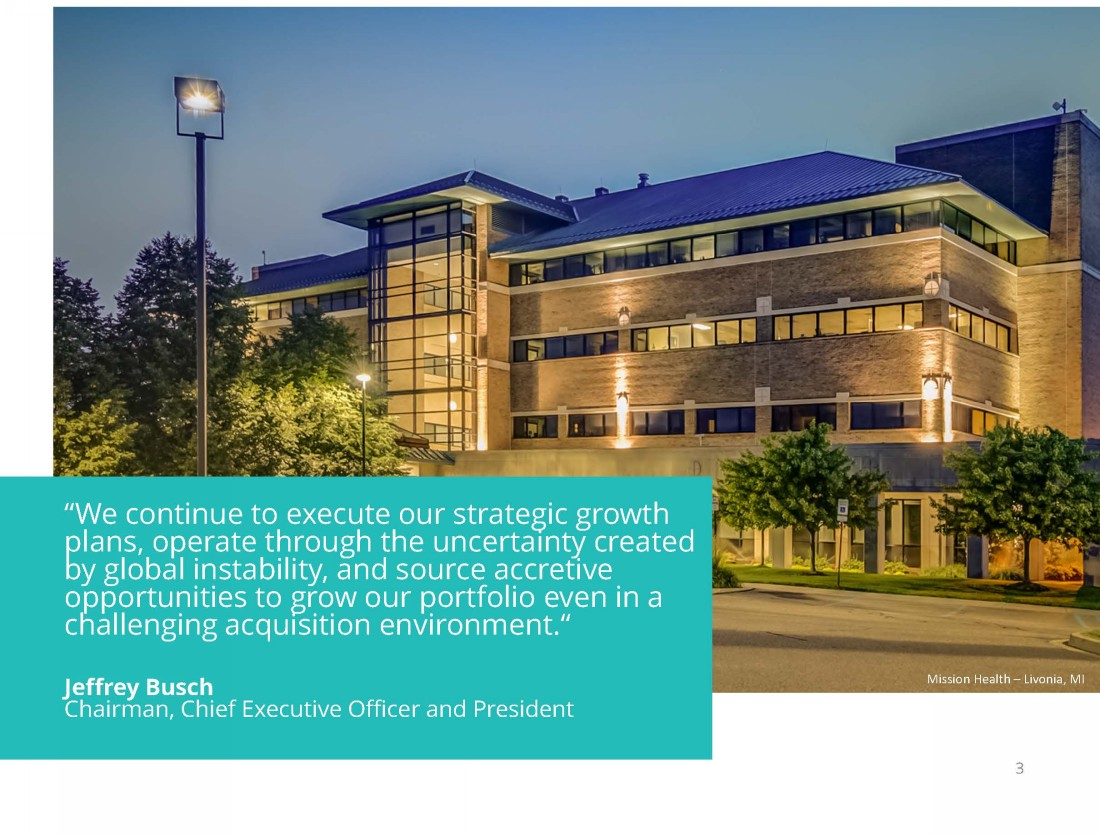
3 “We continue to execute our strategic growth plans, operate through the uncertainty created by global instability, and source accretive opportunities to grow our portfolio even in a challenging acquisition environment.“ Jeffrey Busch Chairman, Chief Executive Officer and President Mission Health – Livonia, MI
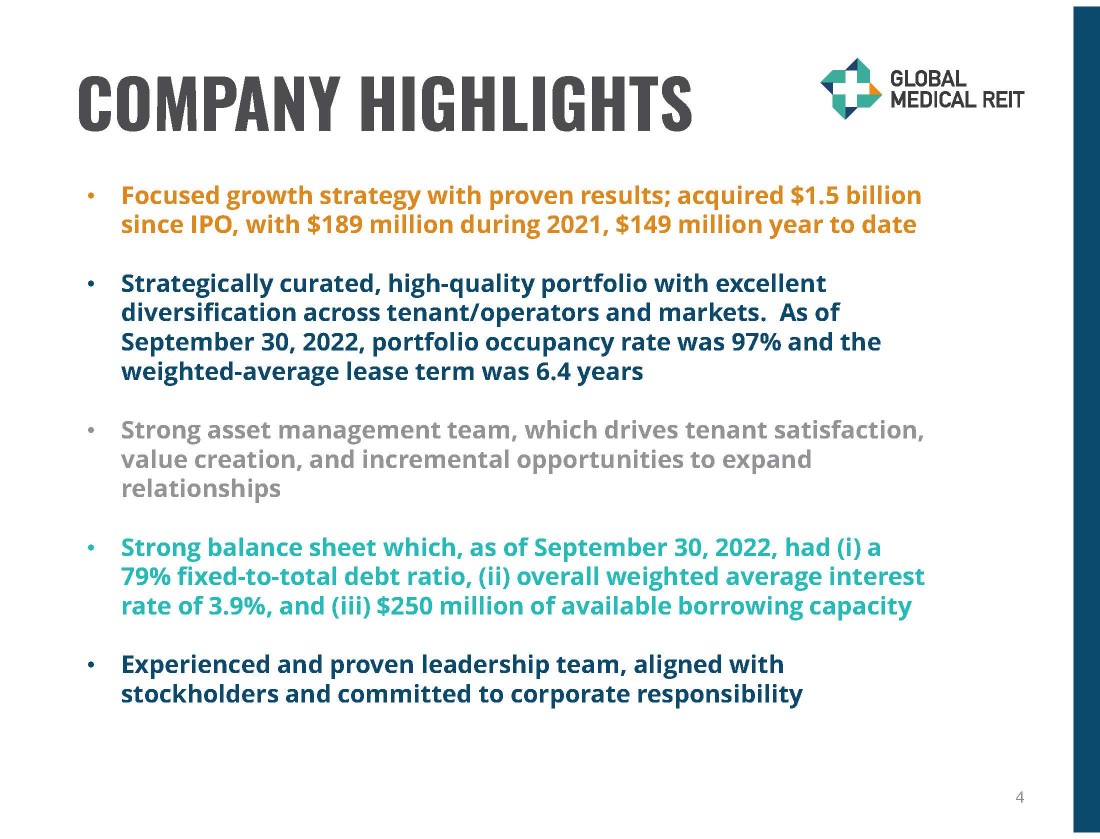
COMPANY HIGHLIGHTS 4 • Focused growth strategy with proven results; acquired $1.5 billion since IPO, with $189 million during 2021, $149 million year to date • Strategically curated, high - quality portfolio with excellent diversification across tenant/operators and markets. As of September 30, 2022, portfolio occupancy rate was 97% and the weighted - average lease term was 6.4 years • Strong asset management team, which drives tenant satisfaction, value creation, and incremental opportunities to expand relationships • Strong balance sheet which, as of September 30, 2022, had (i) a 79% fixed - to - total debt ratio, (ii) overall weighted average interest rate of 3.9%, and (iii) $250 million of available borrowing capacity • Experienced and proven leadership team, aligned with stockholders and committed to corporate responsibility
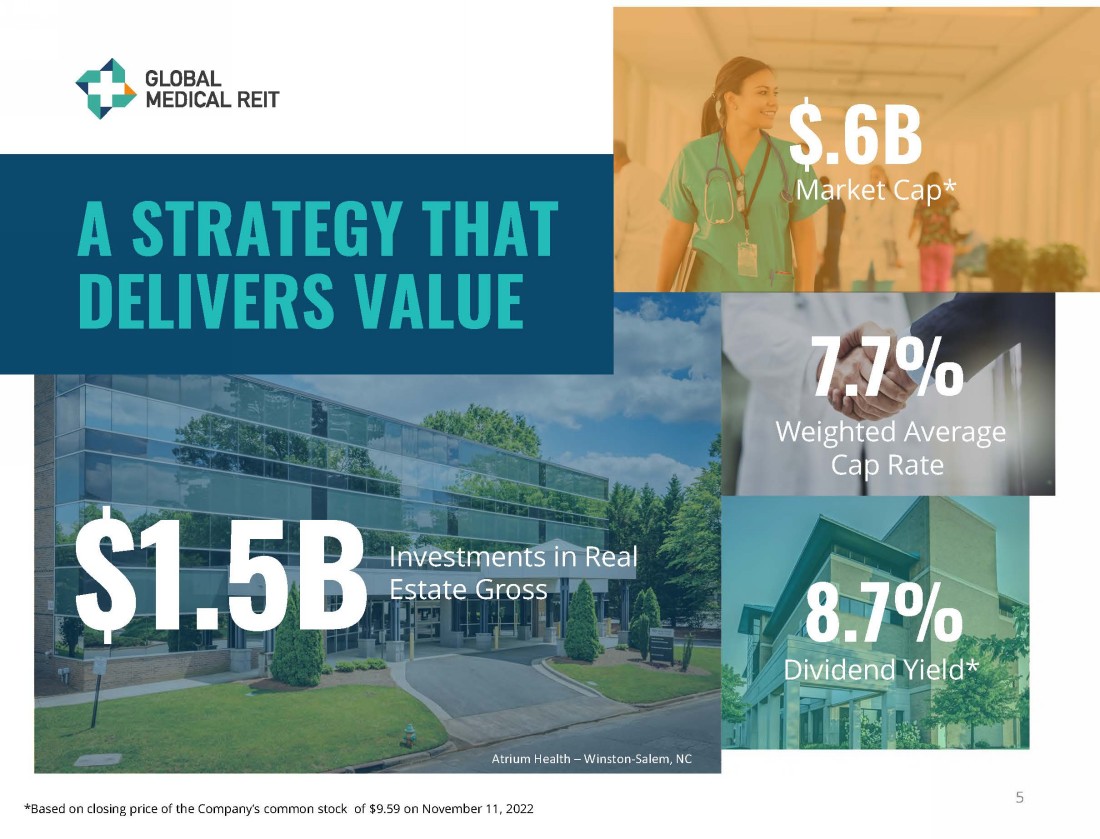
5 A STRATEGY THAT DELIVERS VALUE $1.5B Investments in Real Estate Gross $.6B Market Cap* 7.7% Weighted Average Cap Rate 8.7% Dividend Yield* *Based on closing price of the Company’s common stock of $9.59 on November 11, 2022 Atrium Health – Winston - Salem, NC
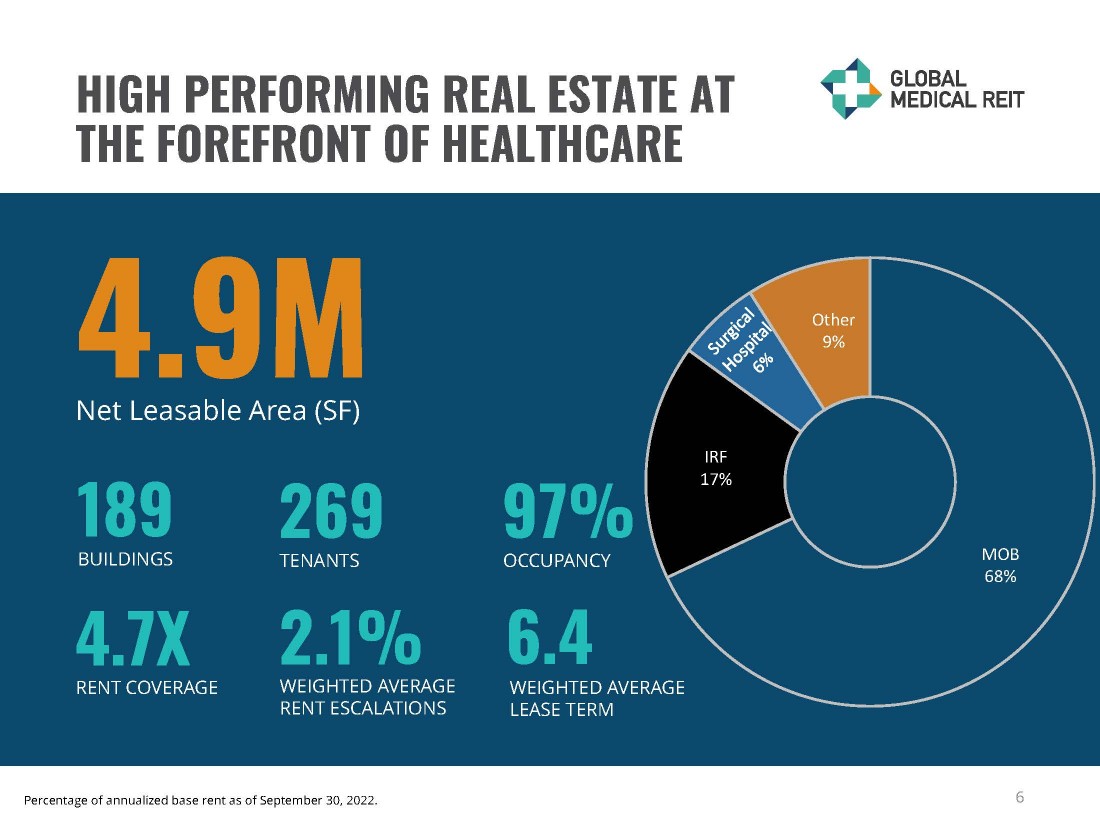
HIGH PERFORMING REAL ESTATE AT THE FOREFRONT OF HEALTHCARE 6 4.7X RENT COVERAGE 2.1% WEIGHTED AVERAGE RENT ESCALATIONS 6.4 WEIGHTED AVERAGE LEASE TERM 189 BUILDINGS 269 TENANTS 97% OCCUPANCY 4.9M Net Leasable Area (SF) Percentage of annualized base rent as of September 30, 2022. MOB 68% IRF 17% Other 9%
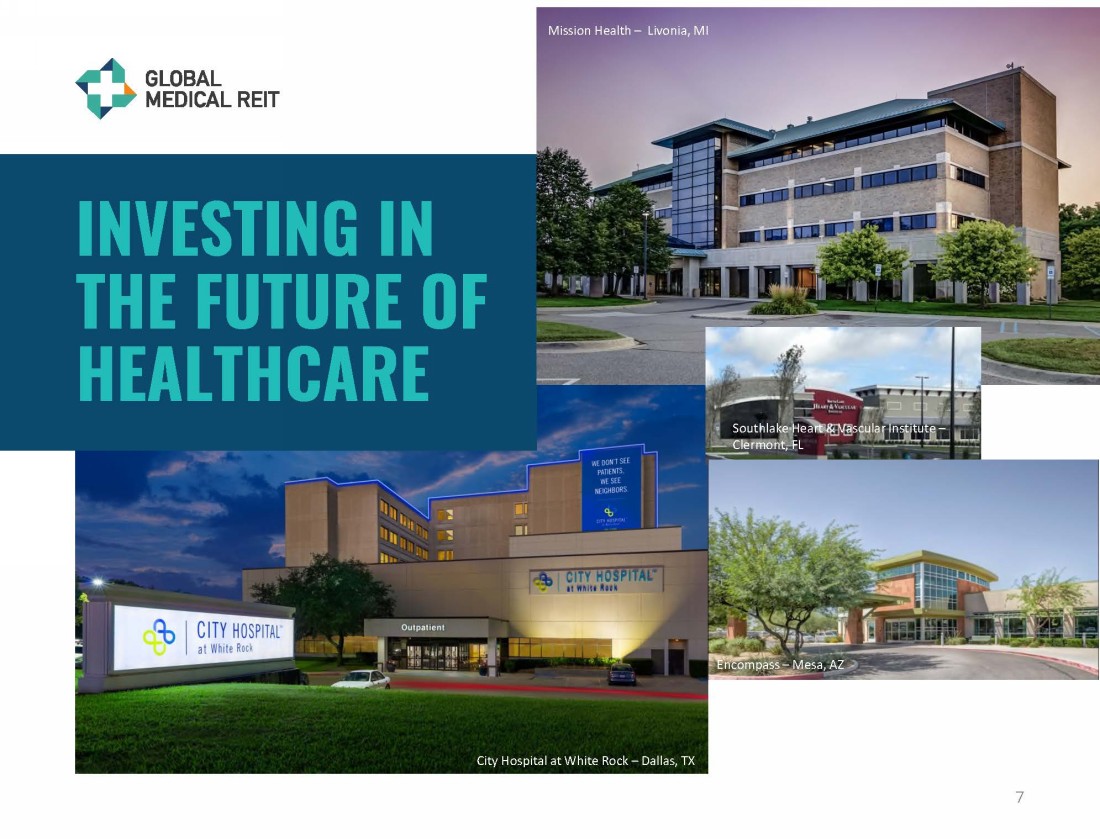
7 INVESTING IN THE FUTURE OF HEALTHCARE City Hospital at White Rock – Dallas, TX Encompass – Mesa, AZ Southlake Heart & Vascular Institute – Clermont, FL Mission Health – Livonia, MI
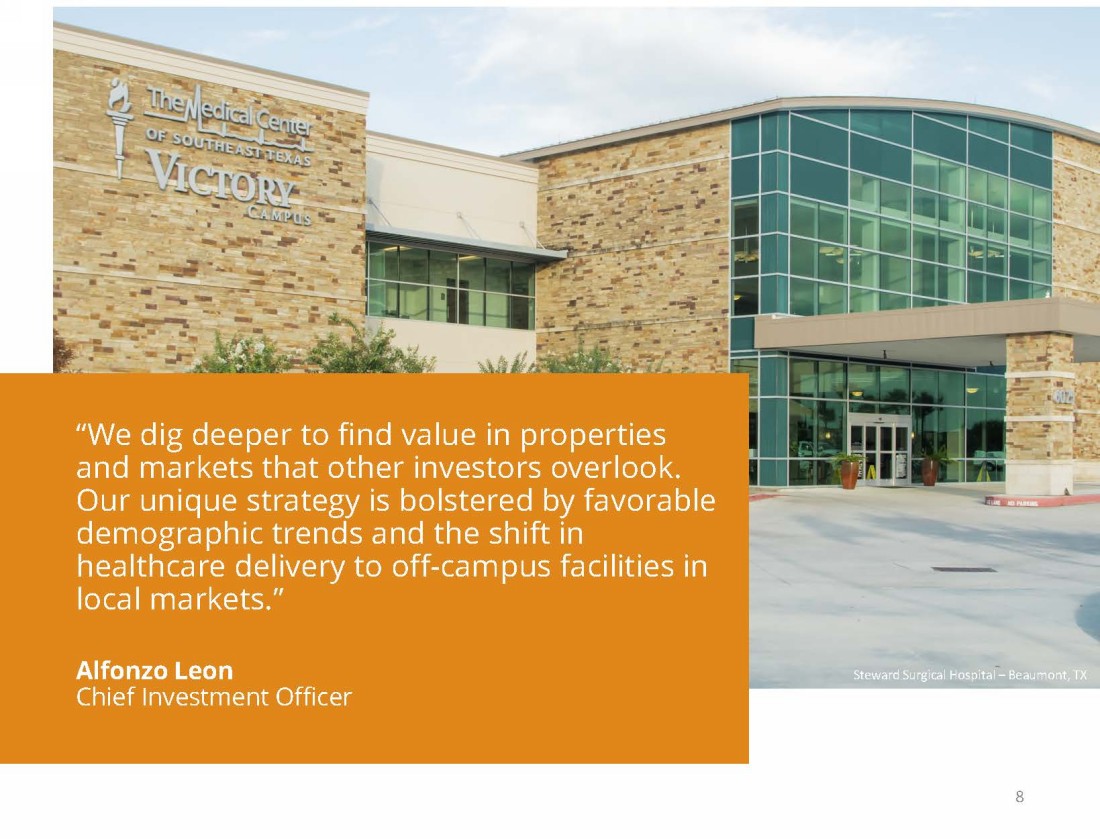
8 “We dig deeper to find value in properties and markets that other investors overlook. Our unique strategy is bolstered by favorable demographic trends and the shift in healthcare delivery to off - campus facilities in local markets.” Alfonzo Leon Chief Investment Officer Steward Surgical Hospital – Beaumont, TX
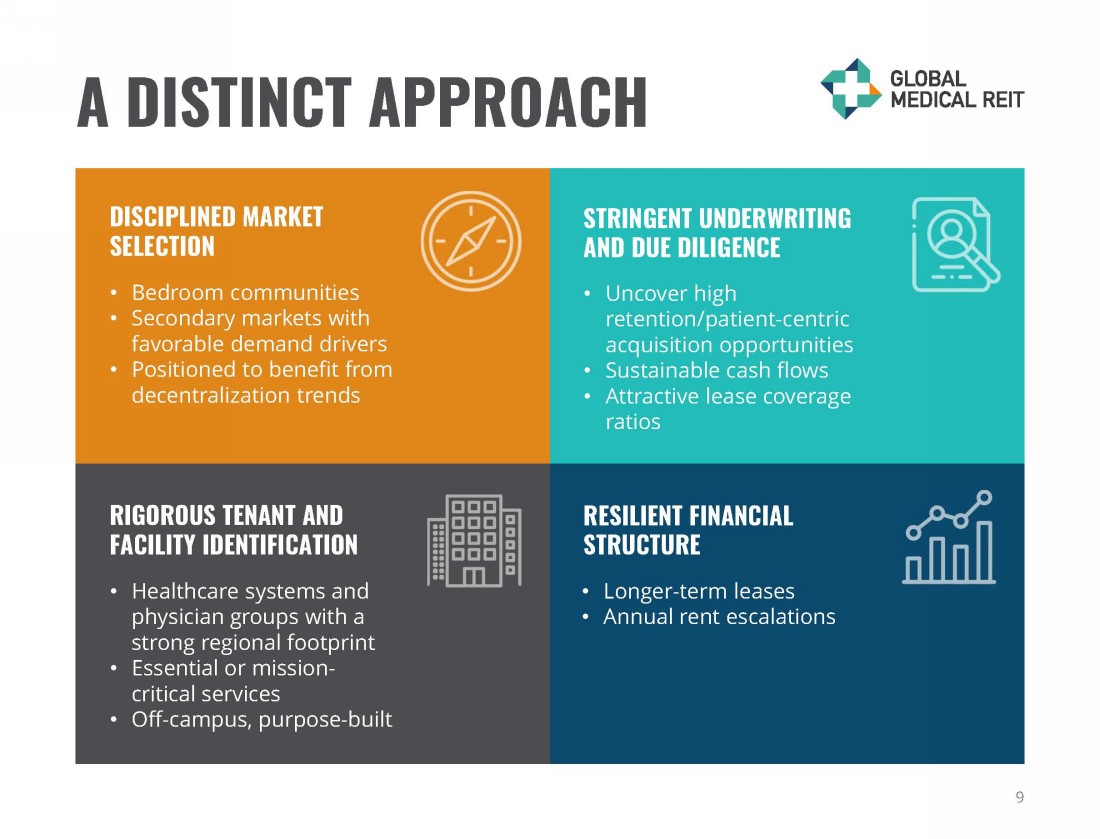
A DISTINCT APPROACH 9 • Longer - term leases • Annual rent escalations • Bedroom communities • Secondary markets with favorable demand drivers • Positioned to benefit from decentralization trends • Uncover high retention/patient - centric acquisition opportunities • Sustainable cash flows • Attractive lease coverage ratios • Healthcare systems and physician groups with a strong regional footprint • Essential or mission - critical services • Off - campus, purpose - built DISCIPLINED MARKET SELECTION STRINGENT UNDERWRITING AND DUE DILIGENCE RIGOROUS TENANT AND FACILITY IDENTIFICATION RESILIENT FINANCIAL STRUCTURE
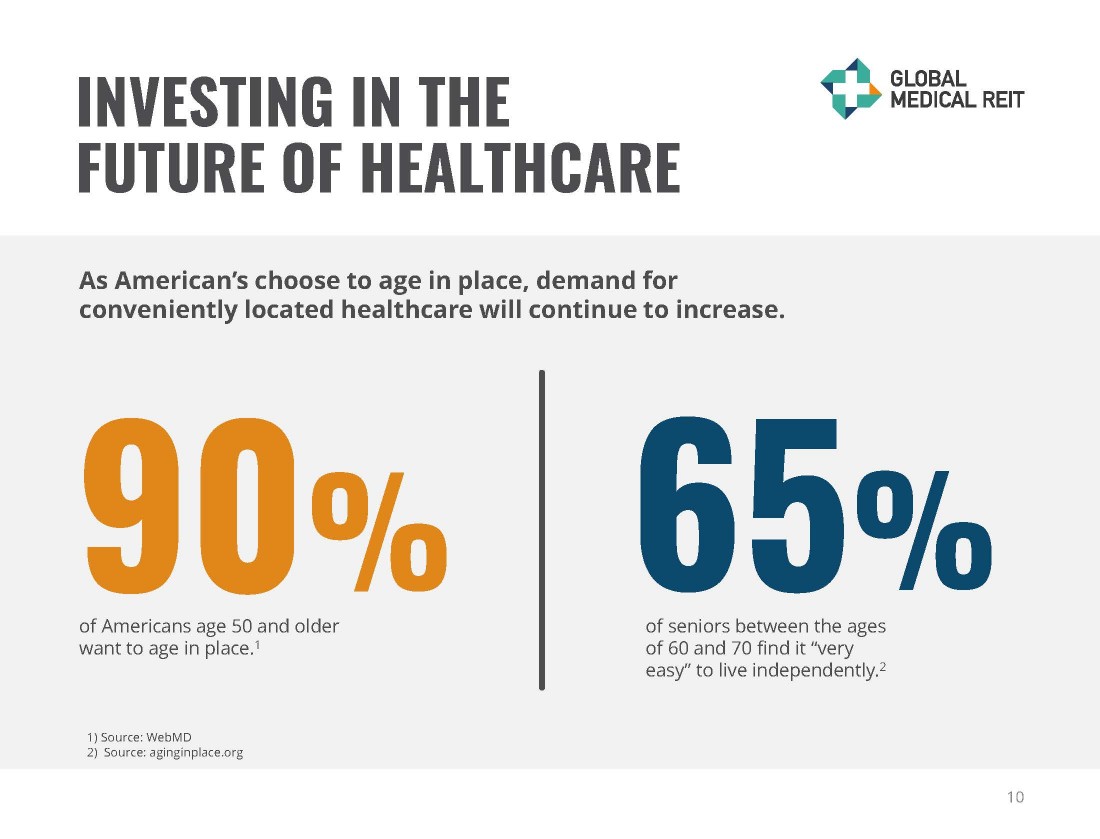
INVESTING IN THE FUTURE OF HEALTHCARE 10 90 % of Americans age 50 and older want to age in place. 1 65 % of seniors between the ages of 60 and 70 find it “very easy” to live independently. 2 As American’s choose to age in place, demand for conveniently located healthcare will continue to increase. 1) Source: WebMD 2) Source: aginginplace.org
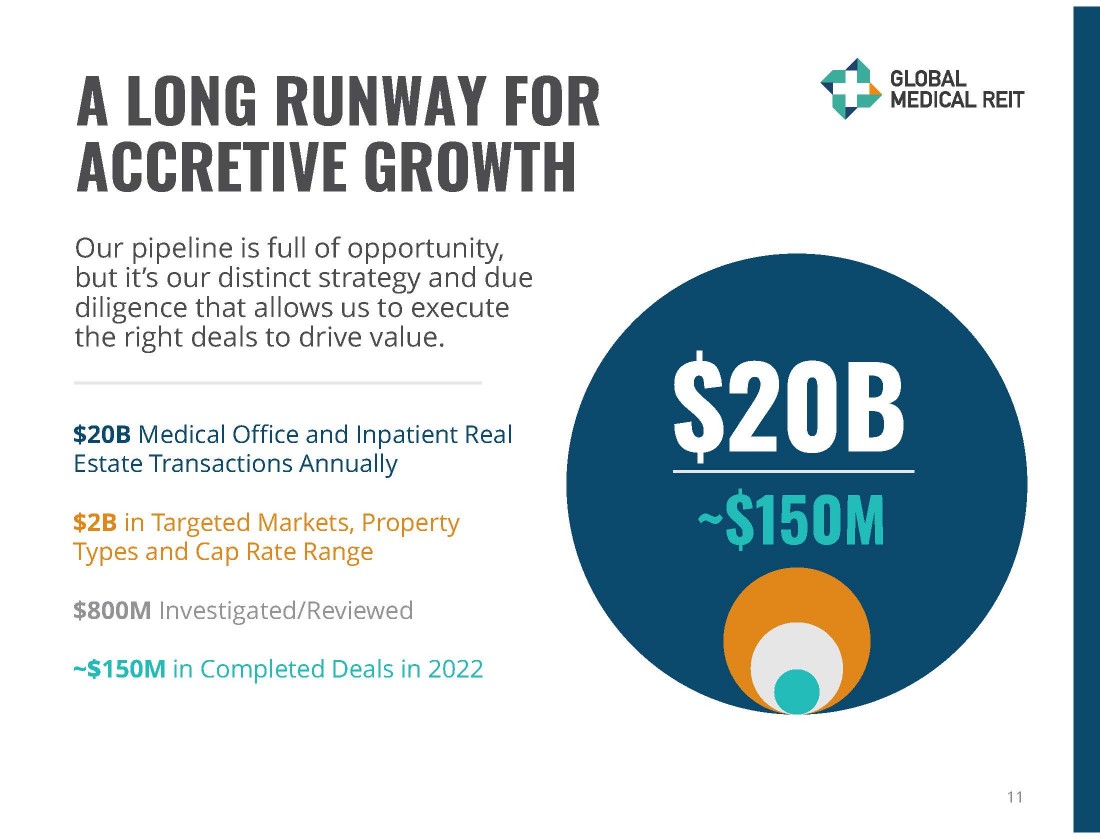
A LONG RUNWAY FOR ACCRETIVE GROWTH 11 $20B Medical Office and Inpatient Real Estate Transactions Annually $2B in Targeted Markets, Property Types and Cap Rate Range $800M Investigated/Reviewed ~$ 150M in Completed Deals in 2022 Our pipeline is full of opportunity, but it’s our distinct strategy and due diligence that allows us to execute the right deals to drive value. ~$150M $20B
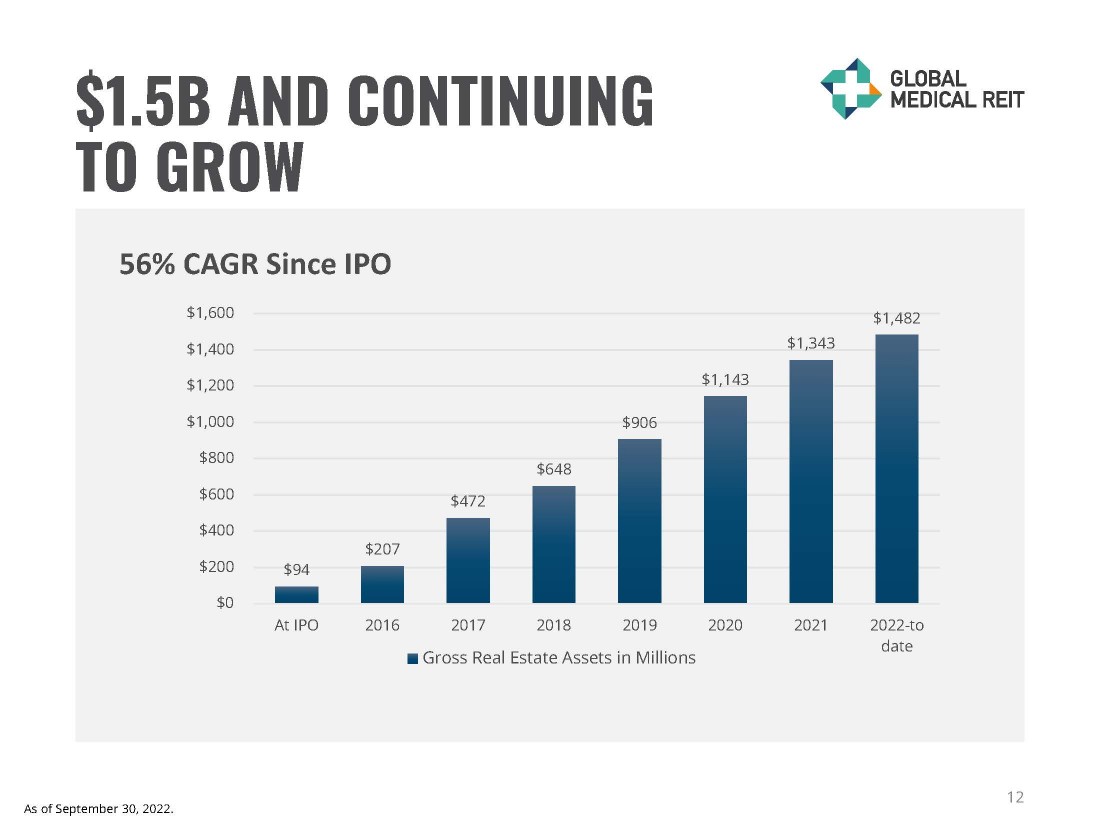
$1.5B AND CONTINUING TO GROW $94 $207 $472 $648 $906 $1,143 $1,343 $1,482 $0 $200 $400 $600 $800 $1,000 $1,200 $1,400 $1,600 At IPO 2016 2017 2018 2019 2020 2021 2022-to date 56% CAGR Since IPO Gross Real Estate Assets in Millions 12 As of September 30, 2022.
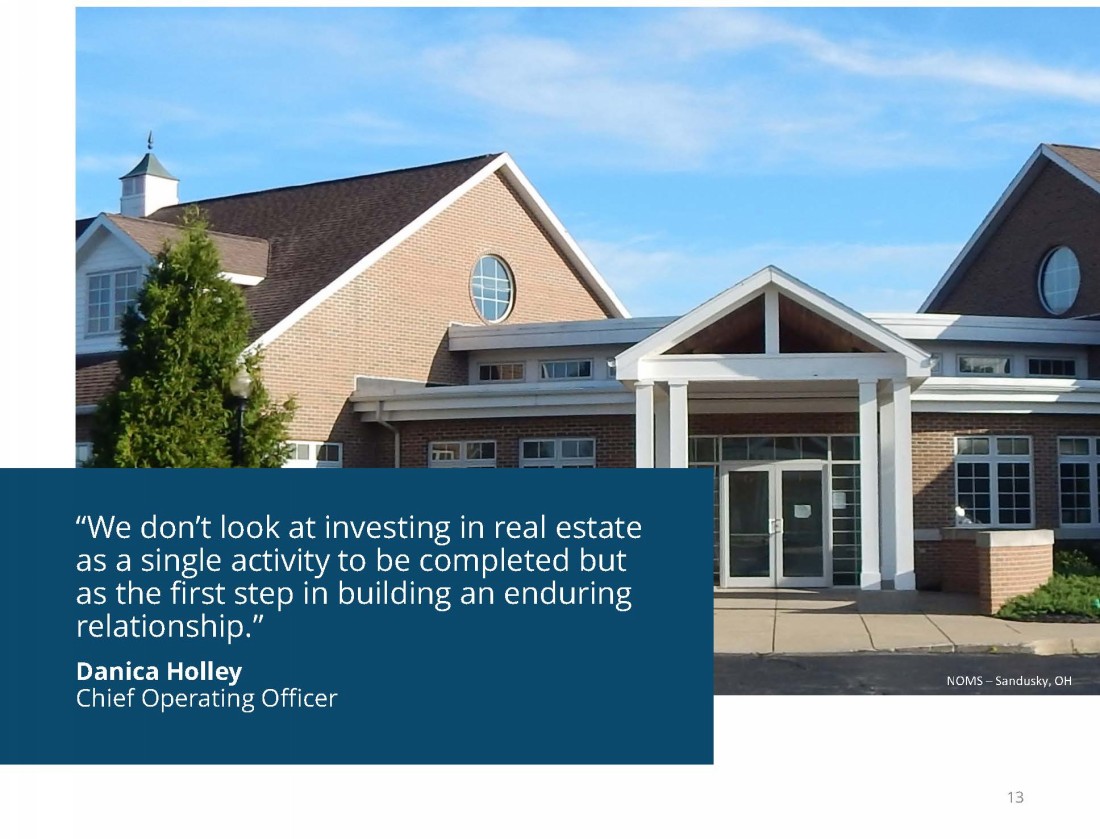
13 “We don’t look at investing in real estate as a single activity to be completed but as the first step in building an enduring relationship.” Danica Holley Chief Operating Officer NOMS – Sandusky, OH
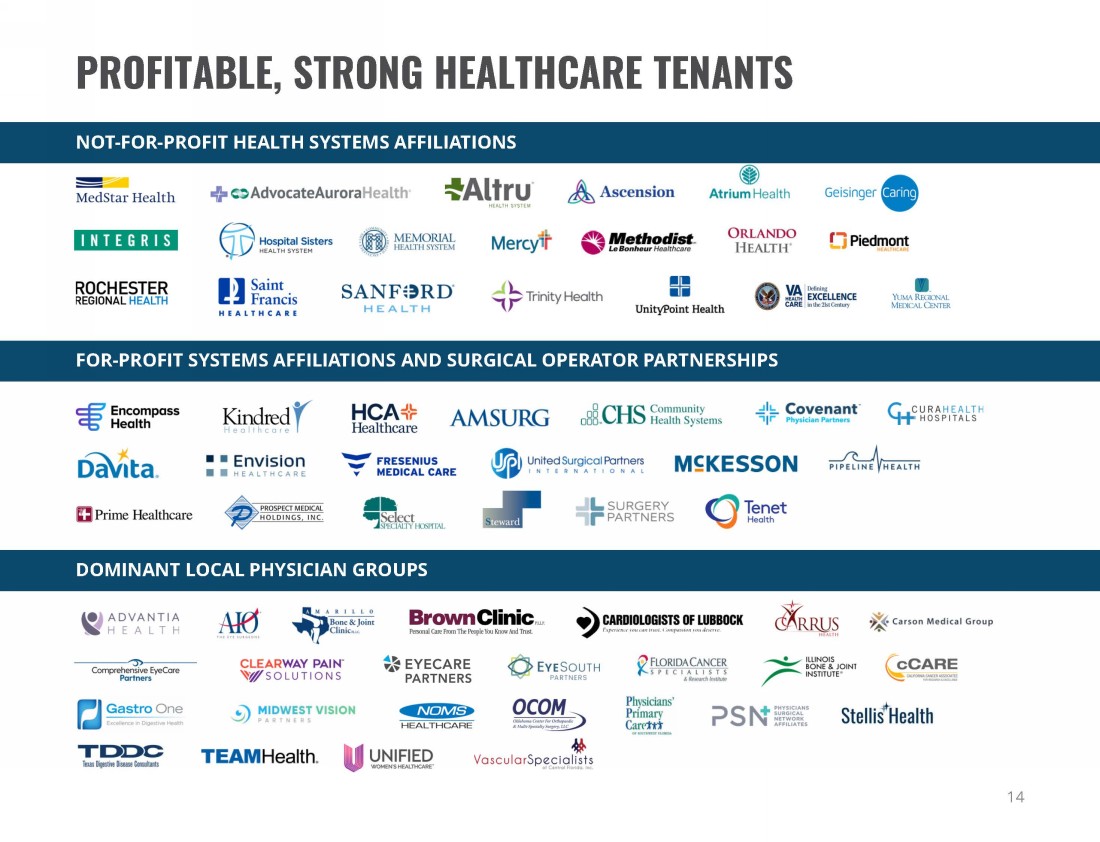
14 DOMINANT LOCAL PHYSICIAN GROUPS FOR - PROFIT SYSTEMS AFFILIATIONS AND SURGICAL OPERATOR PARTNERSHIPS PROFITABLE, STRONG HEALTHCARE TENANTS NOT - FOR - PROFIT HEALTH SYSTEMS AFFILIATIONS
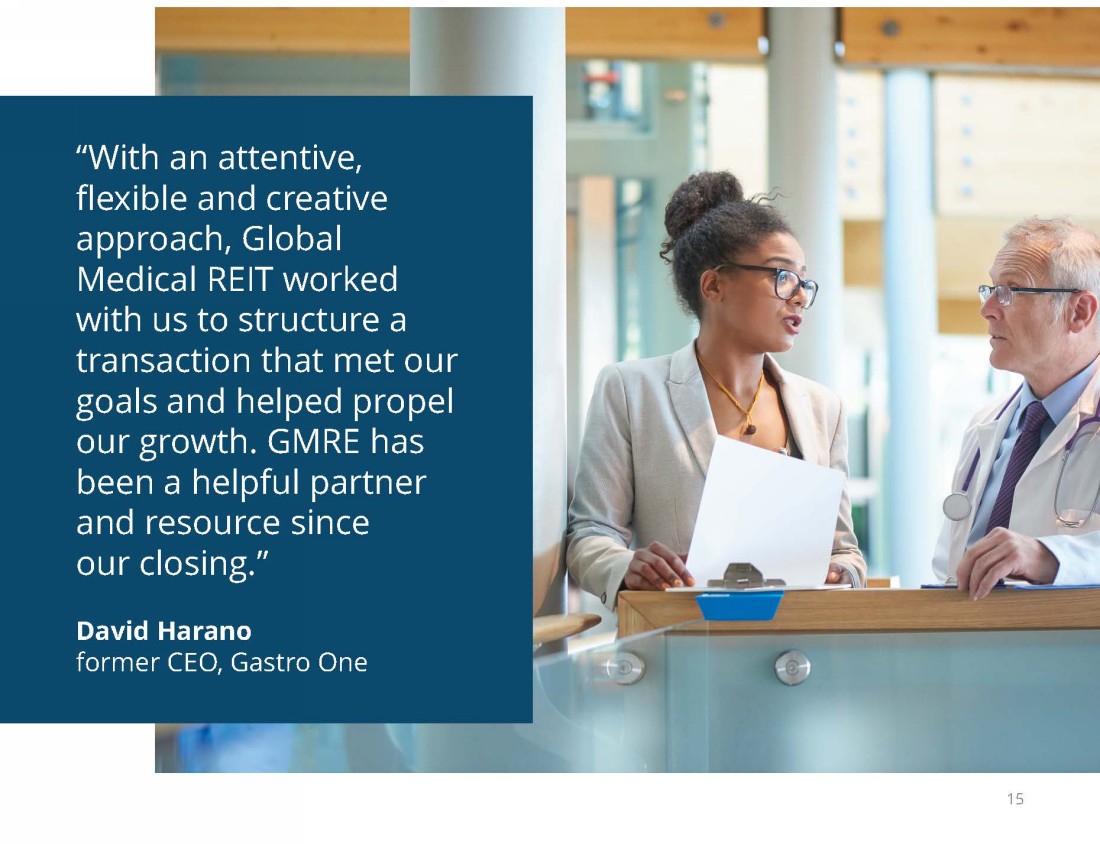
“With an attentive, flexible and creative approach, Global Medical REIT worked with us to structure a transaction that met our goals and helped propel our growth. GMRE has been a helpful partner and resource since our closing.” David Harano former CEO, Gastro One 15
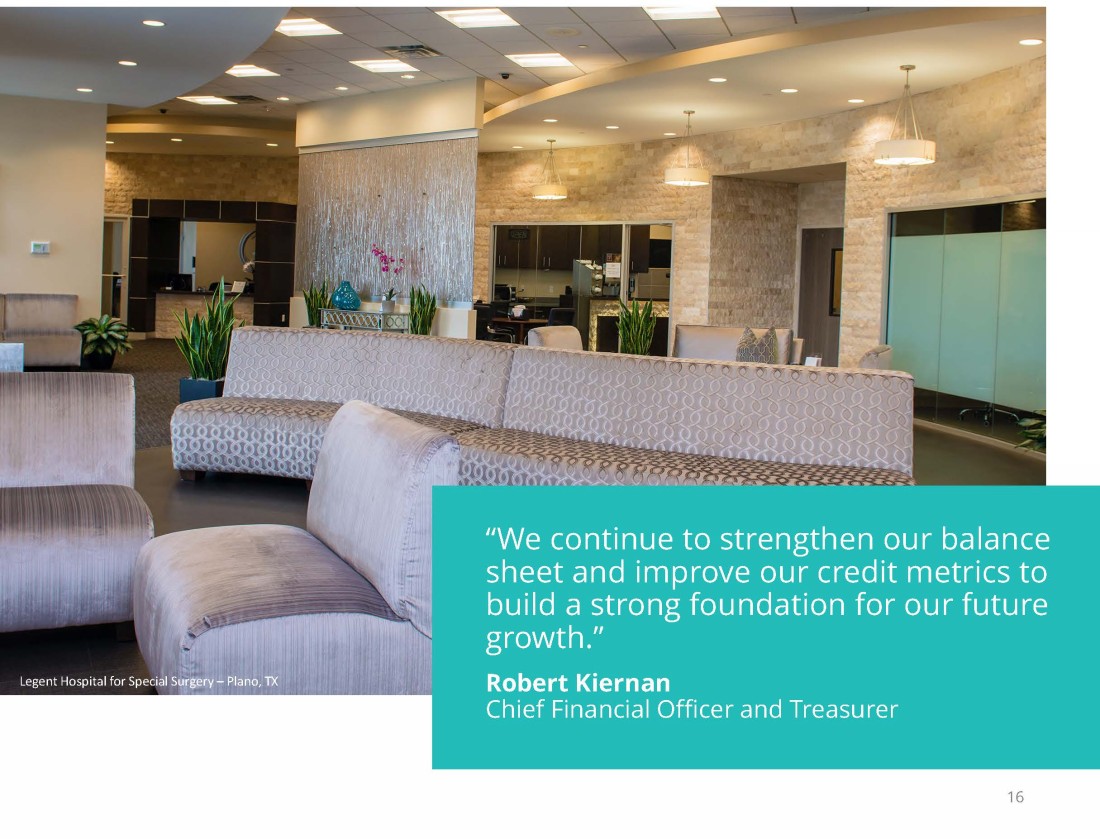
“We continue to strengthen our balance sheet and improve our credit metrics to build a strong foundation for our future growth.” Robert Kiernan Chief Financial Officer and Treasurer 16 Legent Hospital for Special Surgery – Plano, TX
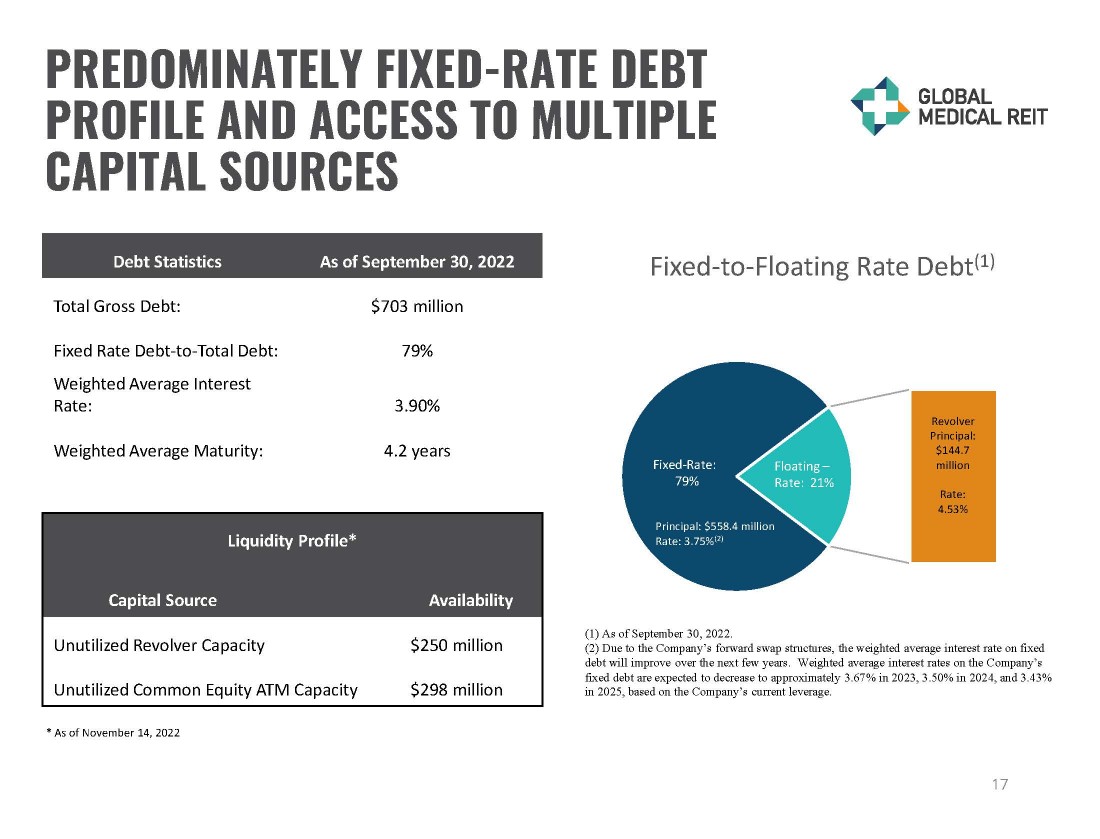
PREDOMINATELY FIXED - RATE DEBT PROFILE AND ACCESS TO MULTIPLE CAPITAL SOURCES 17 Liquidity Profile* Capital Source Availability Unutilized Revolver Capacity $250 million Unutilized Common Equity ATM Capacity $298 million Fixed - to - Floating Rate Debt (1) Fixed - Rate: 79% Floating – Rate: 21% Revolver Principal: $144.7 million Rate: 4.53% Principal: $558.4 million Rate: 3.75% (2) * As of November 14, 2022 Debt Statistics As of September 30, 2022 Total Gross Debt: $703 million Fixed Rate Debt - to - Total Debt: 79% Weighted Average Interest Rate: 3.90% Weighted Average Maturity: 4.2 years (1) As of September 30, 2022. (2) Due to the Company’s forward swap structures, the weighted average interest rate on fixed debt will improve over the next few years. Weighted average interest rates on the Company’s fixed debt are expected to decrease to approximately 3.67% in 2023, 3.50% in 2024, and 3.43% in 2025, based on the Company’s current leverage.
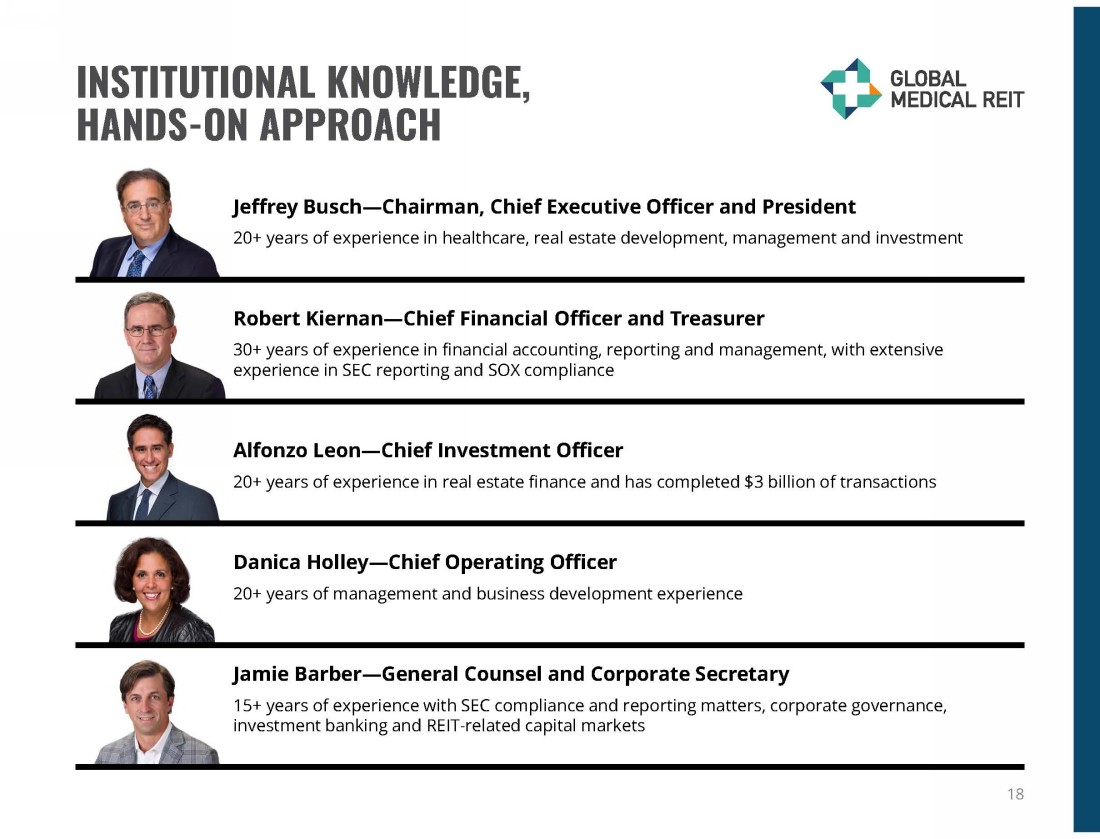
INSTITUTIONAL KNOWLEDGE, HANDS - ON APPROACH Jeffrey Busch — Chairman, Chief Executive Officer and President 20+ years of experience in healthcare, real estate development, management and investment Robert Kiernan — Chief Financial Officer and Treasurer 30+ years of experience in financial accounting, reporting and management, with extensive experience in SEC reporting and SOX compliance Alfonzo Leon — Chief Investment Officer 20+ years of experience in real estate finance and has completed $3 billion of transactions Danica Holley — Chief Operating Officer 20+ years of management and business development experience Jamie Barber — General Counsel and Corporate Secretary 15+ years of experience with SEC compliance and reporting matters, corporate governance, investment banking and REIT - related capital markets 18
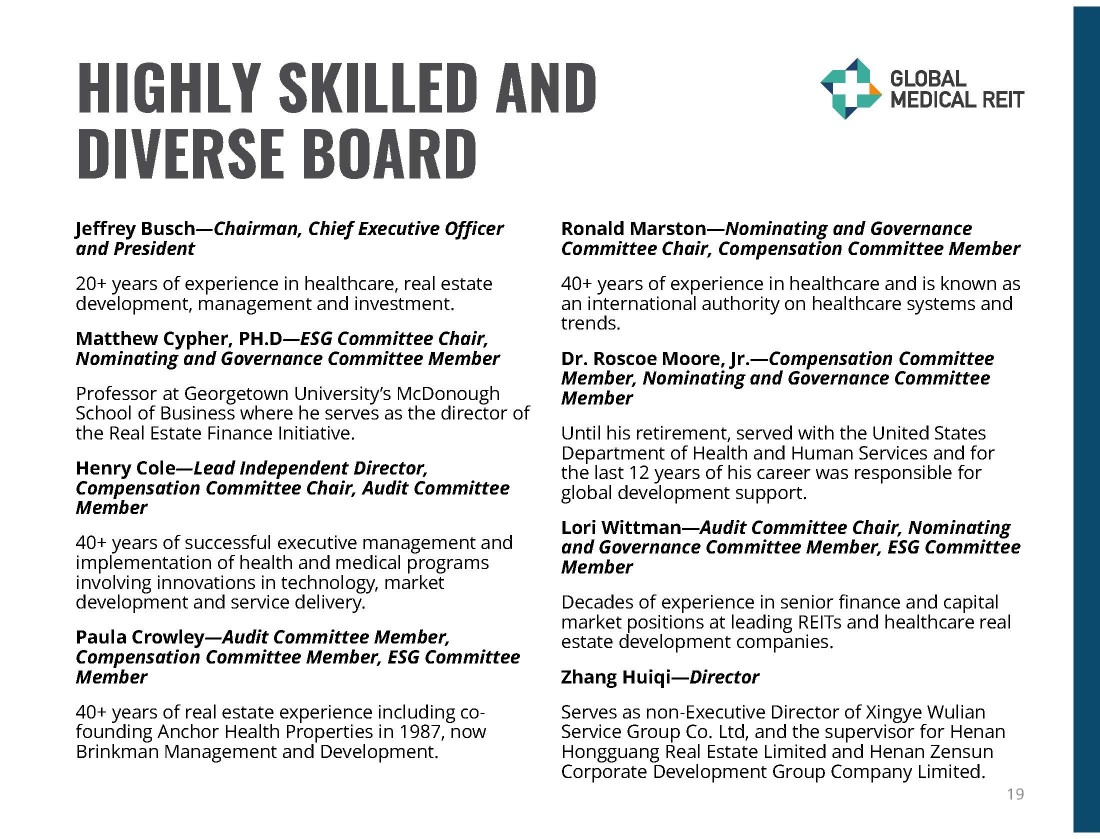
HIGHLY SKILLED AND DIVERSE BOARD Jeffrey Busch — Chairman, Chief Executive Officer and President 20+ years of experience in healthcare, real estate development, management and investment. Matthew Cypher, PH.D — ESG Committee Chair, Nominating and Governance Committee Member Professor at Georgetown University’s McDonough School of Business where he serves as the director of the Real Estate Finance Initiative. Henry Cole — Lead Independent Director, Compensation Committee Chair, Audit Committee Member 40+ years of successful executive management and implementation of health and medical programs involving innovations in technology, market development and service delivery. Paula Crowley — Audit Committee Member, Compensation Committee Member, ESG Committee Member 40+ years of real estate experience including co - founding Anchor Health Properties in 1987, now Brinkman Management and Development. Ronald Marston — Nominating and Governance Committee Chair, Compensation Committee Member 40+ years of experience in healthcare and is known as an international authority on healthcare systems and trends. Dr. Roscoe Moore, Jr. — Compensation Committee Member, Nominating and Governance Committee Member Until his retirement, served with the United States Department of Health and Human Services and for the last 12 years of his career was responsible for global development support. Lori Wittman — Audit Committee Chair, Nominating and Governance Committee Member, ESG Committee Member Decades of experience in senior finance and capital market positions at leading REITs and healthcare real estate development companies. Zhang Huiqi — Director Serves as non - Executive Director of Xingye Wulian Service Group Co. Ltd, and the supervisor for Henan Hongguang Real Estate Limited and Henan Zensun Corporate Development Group Company Limited. 19
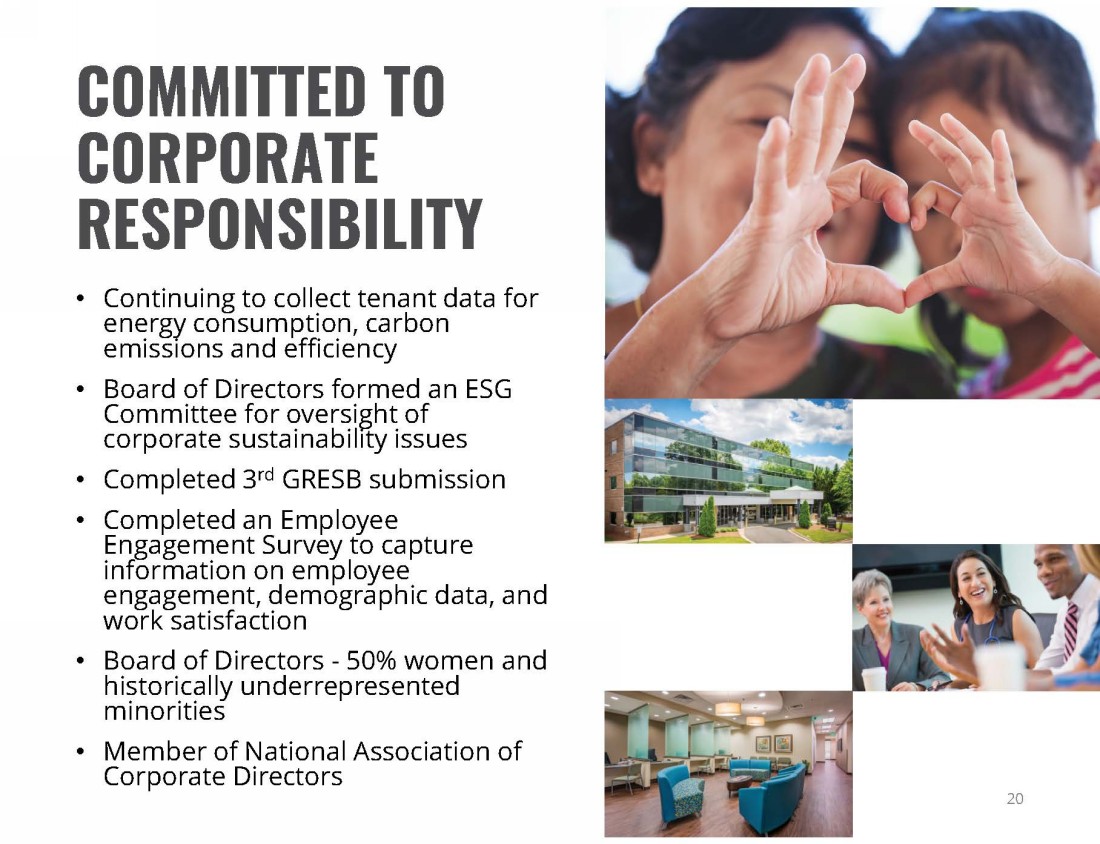
• Continuing to collect tenant data for energy consumption, carbon emissions and efficiency • Board of Directors formed an ESG Committee for oversight of corporate sustainability issues • Completed 3 rd GRESB submission • Completed an Employee Engagement Survey to capture information on employee engagement, demographic data, and work satisfaction • Board of Directors - 50% women and historically underrepresented minorities • Member of National Association of Corporate Directors COMMITTED TO CORPORATE RESPONSIBILITY 20
FORWARD LOOKING STATEMENT Certain statements contained herein may be considered “forward - looking statements” within the meaning of the Private Securities Litigation Reform Act of 1995, and it is the Company’s intent that any such statements be protected by the safe harbor create d thereby. These forward - looking statements are identified by their use of terms and phrases such as "anticipate," "believe," "cou ld," "estimate," "expect," "intend," "may," "should," "plan," "predict," "project," "will," "continue" and other similar terms and ph rases, including references to assumptions and forecasts of future results. Except for historical information, the statements set fo rth herein including, but not limited to, any statements regarding our earnings, our liquidity, our tenants’ ability to pay rent to us, exp ected financial performance (including future cash flows associated with new tenants or the expansion of current properties), futur e dividends or other financial items; any other statements concerning our plans, strategies, objectives and expectations for fu tur e operations and future portfolio occupancy rates, our pipeline of acquisition opportunities and expected acquisition activity, in cluding the timing and/or successful completion of any acquisitions and expected rent receipts on these properties, our expected disp osi tion activity, including the timing and/or successful completion of any dispositions and the expected use of proceeds therefrom, a nd any statements regarding future economic conditions or performance are forward - looking statements. These forward - looking statements are based on our current expectations, estimates and assumptions and are subject to certain risks and uncertainties. Although th e Company believes that the expectations, estimates and assumptions reflected in its forward - looking statements are reasonable, actual results could differ materially from those projected or assumed in any of the Company’s forward - looking statements. Additional information concerning us and our business, including additional factors that could materially and adversely affec t o ur financial results, include, without limitation, the risks described under Part I, Item 1A - Risk Factors, in our Annual Report o n Form 10 - K, our Quarterly Reports on Form 10 - Q, and in our other filings with the SEC. You are cautioned not to place undue reliance on forward - looking statements. The Company does not intend, and undertakes no obligation, to update any forward - looking statement. This presentation includes information regarding certain of our tenants, which are not subject to SEC reporting requirements. Th e information related to our tenants contained in this report was provided to us by such tenants or was derived from publicly a vai lable information. We have not independently investigated or verified this information. We have no reason to believe that this info rma tion is inaccurate in any material respect, but we cannot provide any assurance of its accuracy. We are providing this data for informational purposes only. 21
DISCLOSURES Rent Coverage Ratio For purposes of calculating our portfolio weighted - average EBITDARM coverage ratio (“Rent Coverage Ratio”), we excluded credit - rated tenants or their subsidiaries for which financial statements were either not available or not sufficiently detailed. Th ese ratios are based on latest available information only. Most tenant financial statements are unaudited and we have not independently verified any tenant financial information (audited or unaudited) and, therefore, we cannot assure you that such information i s accurate or complete. Certain other tenants (approximately 16.4% of our portfolio) are excluded from the calculation due to ( i) lack of available financial information or (ii) small tenant size. Additionally, included within 16.4% of non - reporting tenants is Pipe line Healthcare, which filed for Chapter 11 bankruptcy protection in October of 2022. Additionally, our Rent Coverage Ratio adds back physician distributions and compensation. Management believes all adjustments are reasonable and necessary. Additional Information The information in this document should be read in conjunction with the Company’s Annual Report on Form 10 - K, Quarterly Reports on Form 10 - Q, Current Reports on Form 8 - K, and other information filed with, or furnished to, the SEC. You can access the Compan y’s reports and amendments to those reports filed or furnished to the SEC pursuant to Section 13(a) or 15(d) of the Exchange Act in the “Investor Relations” section on the Company’s website (www.globalmedicalreit.com) under “SEC Filings” as soon as reasonably practicable after they are filed with, or furnished to, the SEC. The information on or connected to the Company’s website is not , and shall not be deemed to be, a part of, or incorporated into, this Earnings Supplemental. You also can review these SEC filings an d other information by accessing the SEC’s website at http://www.sec.gov. Certain information contained in this package, including, but not limited to, information contained in our Top 10 tenant prof ile s is derived from publicly - available third - party sources. The Company has not independently verified this information and there can b e no assurance that such information is accurate or complete. 22