Exhibit 99.2
Fourth Quarter 2022 Earnings Supplemental www.globalmedicalreit.com NYSE: GMRE Wake Forest Medical – Winston - Salem, NC Atrium Health – Winston - Salem, NC
Table of Contents Table of Contents Company Overview 3 - 5 Select Quarterly Financial Data 6 Business Summary 7 ESG Summary 8 Acquisitions 9 Portfolio Summary 10 - 11 Top 10 Tenants 12 - 14 Debt and Hedging Summary 15 Total Capitalization and Equity Summary 16 Condensed Consolidated Statements of Operations 17 Condensed Consolidated Balance Sheets 18 Condensed Consolidated Statements of Cash Flows 19 Non - GAAP Reconciliations 20 Reporting Definitions and Other Disclosures 21 - 22 2 Forward - Looking Statements Certain statements contained herein may be considered “forward - looking statements” within the meaning of the Private Securities Litigation Reform Act of 1995 , and it is the Company’s intent that any such statements be protected by the safe harbor created thereby . These forward - looking statements are identified by their use of terms and phrases such as "anticipate," "believe," "could," "estimate," "expect," "intend," "may," "should," "plan," "predict," "project," "will," "continue" and other similar terms and phrases, including references to assumptions and forecasts of future results . Except for historical information, the statements set forth herein including, but not limited to, any statements regarding our earnings, our liquidity, our tenants’ ability to pay rent to us, expected financial performance (including future cash flows associated with new tenants or the expansion of current properties), future dividends or other financial items ; any other statements concerning our plans, strategies, objectives and expectations for future operations and future portfolio occupancy rates, our pipeline of acquisition opportunities and expected acquisition activity, including the timing and/or successful completion of any acquisitions and expected rent receipts on these properties, our expected disposition activity, including the timing and/or successful completion of any dispositions and the expected use of proceeds therefrom, and any statements regarding future economic conditions or performance are forward - looking statements . These forward - looking statements are based on our current expectations, estimates and assumptions and are subject to certain risks and uncertainties . Although the Company believes that the expectations, estimates and assumptions reflected in its forward - looking statements are reasonable, actual results could differ materially from those projected or assumed in any of the Company’s forward - looking statements . Additional information concerning us and our business, including additional factors that could materially and adversely affect our financial results, include, without limitation, the risks described under Part I, Item 1 A - Risk Factors, in our Annual Report on Form 10 - K, our Quarterly Reports on Form 10 - Q, and in our other filings with the SEC . You are cautioned not to place undue reliance on forward - looking statements . The Company does not intend, and undertakes no obligation, to update any forward - looking statement . 4Q - 2022| Earnings Supplemental Legent Hospital for Special Surgery – Plano, TX Associates in Ophthalmology – West Mifflin, PA
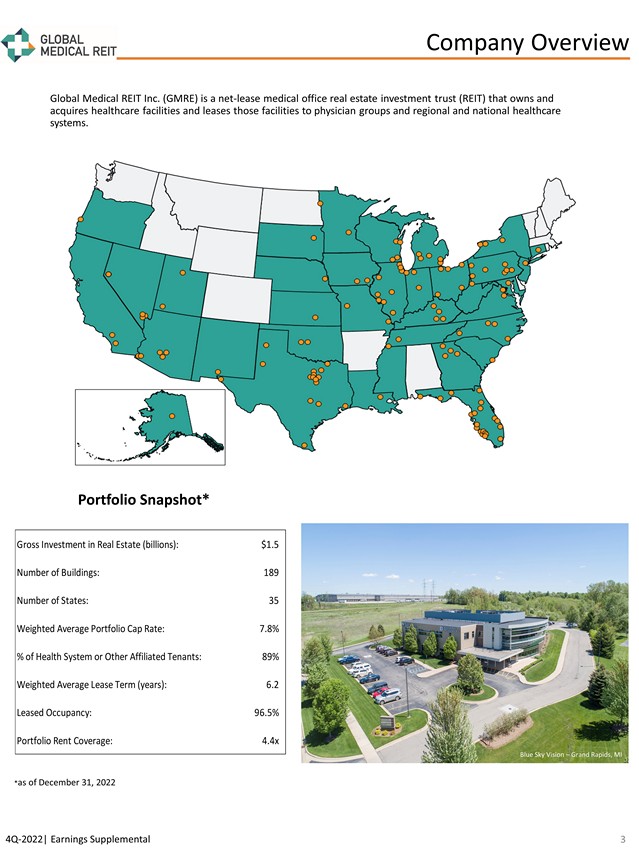
Company Overview Global Medical REIT Inc. (GMRE) is a net - lease medical office real estate investment trust (REIT) that owns and acquires healthcare facilities and leases those facilities to physician groups and regional and national healthcare systems. Portfolio Snapshot* South Lake Heart & Vascular – Claremont, FL * as of December 31, 2022 Blue Sky Vision – Grand Rapids, MI 4Q - 2022| Earnings Supplemental 3 Blue Sky Vision – Grand Rapids, MI Gross Investment in Real Estate (billions): $1.5 Number of Buildings: 189 Number of States: 35 Weighted Average Portfolio Cap Rate: 7.8% % of Health System or Other Affiliated Tenants: 89% Weighted Average Lease Term (years): 6.2 Leased Occupancy: 96.5% Portfolio Rent Coverage: 4.4x
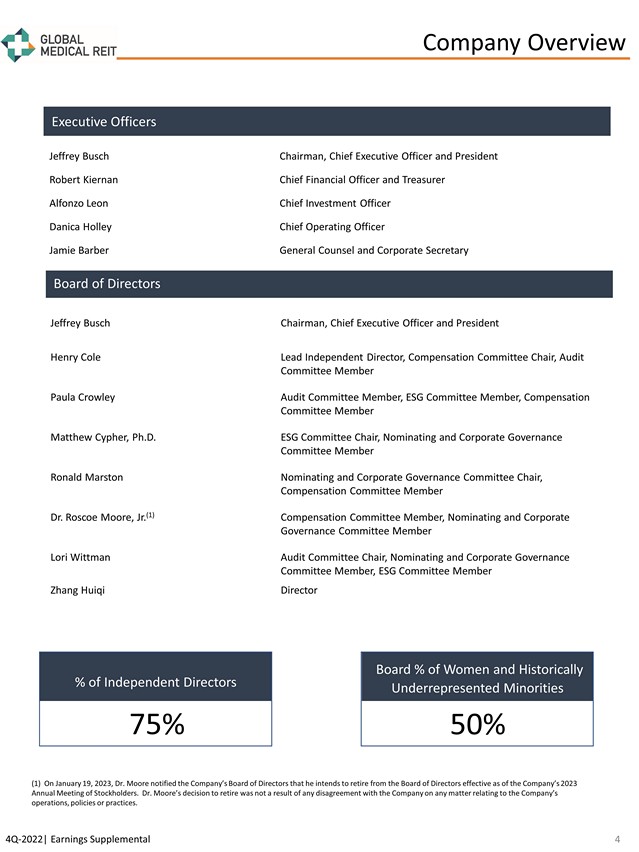
4Q - 2022| Earnings Supplemental Executive Officers Jeffrey Busch Chairman, Chief Executive Officer and President Robert Kiernan Chief Financial Officer and Treasurer Alfonzo Leon Chief Investment Officer Danica Holley Chief Operating Officer Jamie Barber General Counsel and Corporate Secretary Board of Directors Executive Officers Jeffrey Busch Chairman, Chief Executive Officer and President Henry Cole Lead Independent Director, Compensation Committee Chair, Audit Committee Member Paula Crowley Audit Committee Member, ESG Committee Member, Compensation Committee Member Matthew Cypher, Ph.D. ESG Committee Chair, Nominating and Corporate Governance Committee Member Ronald Marston Nominating and Corporate Governance Committee Chair, Compensation Committee Member Dr. Roscoe Moore, Jr. (1) Compensation Committee Member, Nominating and Corporate Governance Committee Member Lori Wittman Audit Committee Chair, Nominating and Corporate Governance Committee Member, ESG Committee Member Zhang Huiqi Director % of Independent Directors 75% Board % of Women and Historically Underrepresented Minorities 50% Company Overview 4 (1) On January 19, 2023, Dr. Moore notified the Company’s Board of Directors that he intends to retire from the Board of Dir ect ors effective as of the Company’s 2023 Annual Meeting of Stockholders. Dr. Moore’s decision to retire was not a result of any disagreement with the Company on any mat ter relating to the Company’s operations, policies or practices.
4Q - 2022| Earnings Supplemental Executive Officers Firm Name Baird Wes Golladay BMO Juan Sanabria B. Riley Securities Bryan Maher Colliers Securities Barry Oxford Compass Point Merrill Ross JMP Securities Aaron Hecht Janney Robert Stevenson KeyBanc Austin Wurschmidt Stifel Stephen Manaker Sell - Side Analyst Coverage Corporate Headquarters Global Medical REIT Inc. 7373 Wisconsin Avenue, Suite 800 Bethesda, MD 20814 Phone: 202.524.6851 www.globalmedicalreit.com Investor Relations Deloitte & Touche LLP McLean, VA Independent Registered Public Accounting Firm Corporate and REIT Tax Counsel Vinson & Elkins LLP Daniel LeBey, Corporate Partner Christopher Mangin, REIT Tax Partner Stephen Swett Phone: 203.682.8377 Email: stephen.swett@icrinc.com Stock Exchange New York Stock Exchange Ticker: GMRE Transfer Agent American Stock Transfer & Trust Company Phone: 800.937.5449 Thumb Butte Medical Center Prescott, Az Cobalt Rehabilitation Hospital – Surprise, AZ Company Overview 5
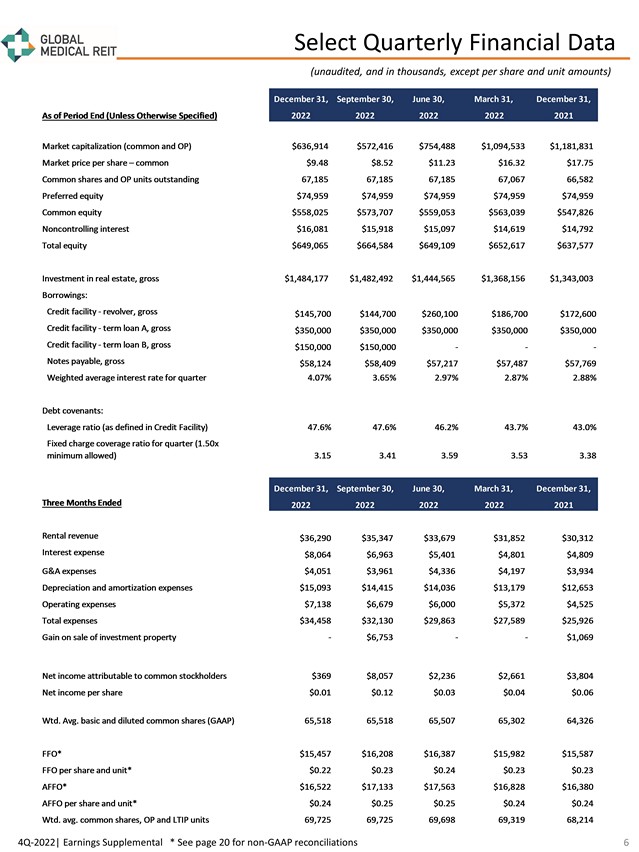
(unaudited, and in thousands, except per share and unit amounts) 4Q - 2022| Earnings Supplemental * See page 20 for non - GAAP reconciliations Select Quarterly Financial Data 6 December 31, September 30, June 30, March 31, December 31, As of Period End (Unless Otherwise Specified) 2022 2022 2022 2022 2021 Market capitalization (common and OP) $636,914 $572,416 $754,488 $1,094,533 $1,181,831 Market price per share – common $9.48 $8.52 $11.23 $16.32 $17.75 Common shares and OP units outstanding 67,185 67,185 67,185 67,067 66,582 Preferred equity $74,959 $74,959 $74,959 $74,959 $74,959 Common equity $558,025 $573,707 $559,053 $563,039 $547,826 Noncontrolling interest $16,081 $15,918 $15,097 $14,619 $14,792 Total equity $649,065 $664,584 $649,109 $652,617 $637,577 Investment in real estate, gross $1,484,177 $1,482,492 $1,444,565 $1,368,156 $1,343,003 Borrowings: Credit facility - revolver, gross $145,700 $144,700 $260,100 $186,700 $172,600 Credit facility - term loan A, gross $350,000 $350,000 $350,000 $350,000 $350,000 Credit facility - term loan B, gross $150,000 $150,000 - - - Notes payable, gross $58,124 $58,409 $57,217 $57,487 $57,769 Weighted average interest rate for quarter 4.07% 3.65% 2.97% 2.87% 2.88% Debt covenants: Leverage ratio (as defined in Credit Facility) 47.6% 47.6% 46.2% 43.7% 43.0% Fixed charge coverage ratio for quarter (1.50x minimum allowed) 3.15 3.41 3.59 3.53 3.38 December 31, September 30, June 30, March 31, December 31, Three Months Ended 2022 2022 2022 2022 2021 Rental revenue $36,290 $35,347 $33,679 $31,852 $30,312 Interest expense $8,064 $6,963 $5,401 $4,801 $4,809 G&A expenses $4,051 $3,961 $4,336 $4,197 $3,934 Depreciation and amortization expenses $15,093 $14,415 $14,036 $13,179 $12,653 Operating expenses $7,138 $6,679 $6,000 $5,372 $4,525 Total expenses $34,458 $32,130 $29,863 $27,589 $25,926 Gain on sale of investment property - $6,753 - - $1,069 Net income attributable to common stockholders $369 $8,057 $2,236 $2,661 $3,804 Net income per share $0.01 $0.12 $0.03 $0.04 $0.06 Wtd. Avg. basic and diluted common shares (GAAP) 65,518 65,518 65,507 65,302 64,326 FFO* $15,457 $16,208 $16,387 $15,982 $15,587 FFO per share and unit* $0.22 $0.23 $0.24 $0.23 $0.23 AFFO* $16,522 $17,133 $17,563 $16,828 $16,380 AFFO per share and unit* $0.24 $0.25 $0.25 $0.24 $0.24 Wtd. avg. common shares, OP and LTIP units 69,725 69,725 69,698 69,319 68,214
4Q - 2022| Earnings Supplemental Fourth Quarter 2022 Operating Summary Common and Preferred Dividends Investment Activity Capital Markets and Debt Activity Business Summary 7 • Net income attributable to common stockholders was $0.4 million, or $0.01 per diluted share, as compared to $3.8 million, or $0. 6 per diluted share, in the comparable prior year period. • Funds from Operations (“FFO”) of $15.5 million, or $0.22 per share and unit, as compared to $15.6 million, or $0.23 per share an d unit, in the comparable prior year period. • Adjusted Funds from Operations (“AFFO”) of $16.5 million, or $0.24 per share and unit, as compared to $16.4 million, or $0.24 pe r share and unit, in the comparable prior year period. • Increased total revenue 19.6% year - over - year to $36.3 million, primarily driven by the Company’s acquisition activity since the comparable prior year period. • On December 7, 2022, the Board of Directors (the “Board”) declared a: • $0.21 per share cash dividend to common stockholders and unitholders of record as of December 22, 2022, which was paid on January 9, 2023; and • $0.46875 per share cash dividend to holders of record as of January 15, 2023, of the Company’s Series A Preferred Stock, whic h was paid on January 31, 2023. • The Company did not complete any acquisitions during the fourth quarter of 2022. • For the full year of 2022, completed 14 acquisitions, encompassing an aggregate 583,253 leasable square feet for an aggregate pu rchase price of $148.9 million at a weighted average cap rate of 7.4%. • Leverage was unchanged as of December 31, 2022, from September 30, 2022, at 47.6%. • As of February 28, 2023, we had unutilized borrowing capacity under the Credit Facility of $245.0 million. • We did not issue any shares under our ATM program during the fourth quarter of 2022.
Environmental Social Governance ESG Summary 8 4Q - 2022| Earnings Supplemental • We continue our efforts to quantify the energy consumption of our portfolio. For the 2022 GRESB assessment report we received a score of 46 which was higher than our 2021 score. • We utilize the ENERGY STAR platform to collect and track our energy consumption data and have identified properties that are strong candidates for the ENERGY STAR certificate program. • We successfully completed our third project with Georgetown University Steers Center for Global Real Estate, Steers Advisory Services program. This engagement evaluated the means and methods of our utility data collection and provided actionable recommendations on improving the process for consistent quality assurance and impact. This work product will be used to establish methodology for future consumption reduction plans, and improved uniformity of data for reporting and communication purposes. • We incorporate climate risks and environmental sustainability assessments in our due diligence process. This has yielded actionable energy consumption mitigation recommendations and immediate access to utility consumption information. Collecting this information as part of our asset evaluation supports our ESG approach of Alignment. Our Board continues to lead our social and governance efforts. With its diverse composition, our Board is a strong example of inclusive leadership with a composition of 33% women and 55% of individuals from underrepresented groups. • Our Board has been recognized by “Women on Boards” and our executive team reflects our demographically diverse staff. • Our Phoenix, Arizona metro area pilot project with Ride United continued with great success. We provided 1,070 healthcare related rides to individuals in need. 60% of the rides were to medical, dental and eye appointments; 15% were to pharmacy appointments; 12% to substance use support; and10% to mental health support. We will continue to support this program in Phoenix and expect to expand to support a similar program in Orlando, Florida. • Our commitment to employee engagement remains a high - priority, as we continue to make accommodations for health, safety, and work - life balance. With this commitment in mind, and with the compensation committee of the Board’s leadership, we conducted an employee survey that covered a comprehensive range of subjects related to our employees’ attitudes about our work culture, compensation components, as well as demographic and identification data. • The Board continued to improve our corporate governance structure by adopting an incentive compensation recoupment ( clawback ) policy during the first quarter of 2022. • The Board formed a standing ESG committee that oversees the Company’s environmental, social, governance and resilience efforts. • GMRE is a member of the National Association of Corporate Directors.
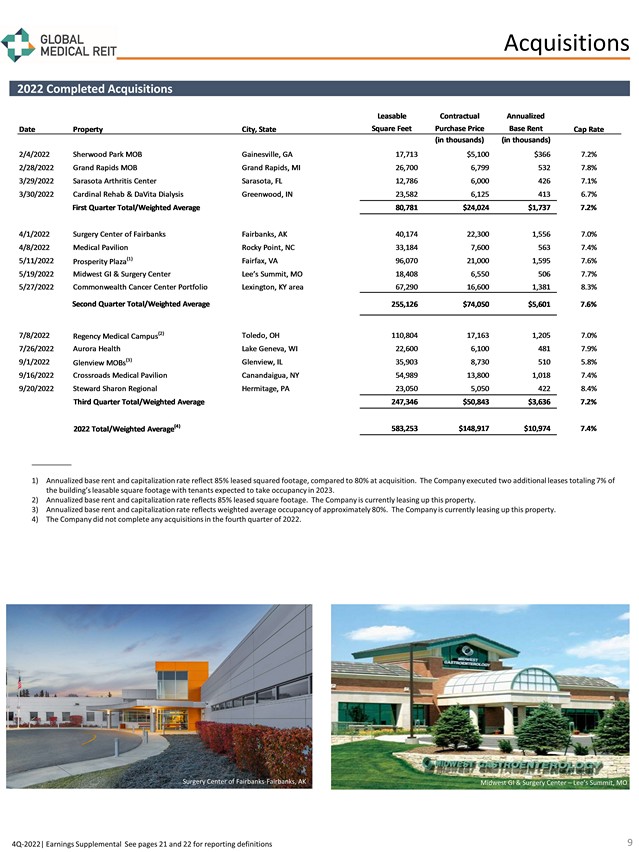
2022 Completed Acquisitions 4Q - 2022| Earnings Supplemental See pages 21 and 22 for reporting definitions . Acquisitions 9 __________ 1) Annualized base rent and capitalization rate reflect 85% leased squared footage, compared to 80% at acquisition. The Company ex ecuted two additional leases totaling 7% of the building’s leasable square footage with tenants expected to take occupancy in 2023. 2) Annualized base rent and capitalization rate reflects 85% leased square footage. The Company is currently leasing up this pr ope rty. 3) Annualized base rent and capitalization rate reflects weighted average occupancy of approximately 80%. The Company is curren tly leasing up this property. 4) The Company did not complete any acquisitions in the fourth quarter of 2022. Surgery Center of Fairbanks - Fairbanks, AK Midwest GI & Surgery Center – Lee’s Summit, MO Leasable Contractual Annualized Square Feet Purchase Price Base Rent (in thousands) (in thousands) 2/4/2022 Sherwood Park MOB Gainesville, GA 17,713 $5,100 $366 7.2% 2/28/2022 Grand Rapids MOB Grand Rapids, MI 26,700 6,799 532 7.8% 3/29/2022 Sarasota Arthritis Center Sarasota, FL 12,786 6,000 426 7.1% 3/30/2022 Cardinal Rehab & DaVita Dialysis Greenwood, IN 23,582 6,125 413 6.7% 80,781 $24,024 $1,737 7.2% 4/1/2022 Surgery Center of Fairbanks Fairbanks, AK 40,174 22,300 1,556 7.0% 4/8/2022 Medical Pavilion Rocky Point, NC 33,184 7,600 563 7.4% 5/11/2022 Prosperity Plaza (1) Fairfax, VA 96,070 21,000 1,595 7.6% 5/19/2022 Midwest GI & Surgery Center Lee’s Summit, MO 18,408 6,550 506 7.7% 5/27/2022 Commonwealth Cancer Center Portfolio Lexington, KY area 67,290 16,600 1,381 8.3% 255,126 $74,050 $5,601 7.6% 7/8/2022 Regency Medical Campus (2) Toledo, OH 110,804 17,163 1,205 7.0% 7/26/2022 Aurora Health Lake Geneva, WI 22,600 6,100 481 7.9% 9/1/2022 Glenview MOBs (3) Glenview, IL 35,903 8,730 510 5.8% 9/16/2022 Crossroads Medical Pavilion Canandaigua, NY 54,989 13,800 1,018 7.4% 9/20/2022 Steward Sharon Regional Hermitage, PA 23,050 5,050 422 8.4% 247,346 $50,843 $3,636 7.2% 583,253 $148,917 $10,974 7.4% 2022 Total/Weighted Average (4) Date Property City, State Cap Rate First Quarter Total/Weighted Average Second Quarter Total/Weighted Average Third Quarter Total/Weighted Average
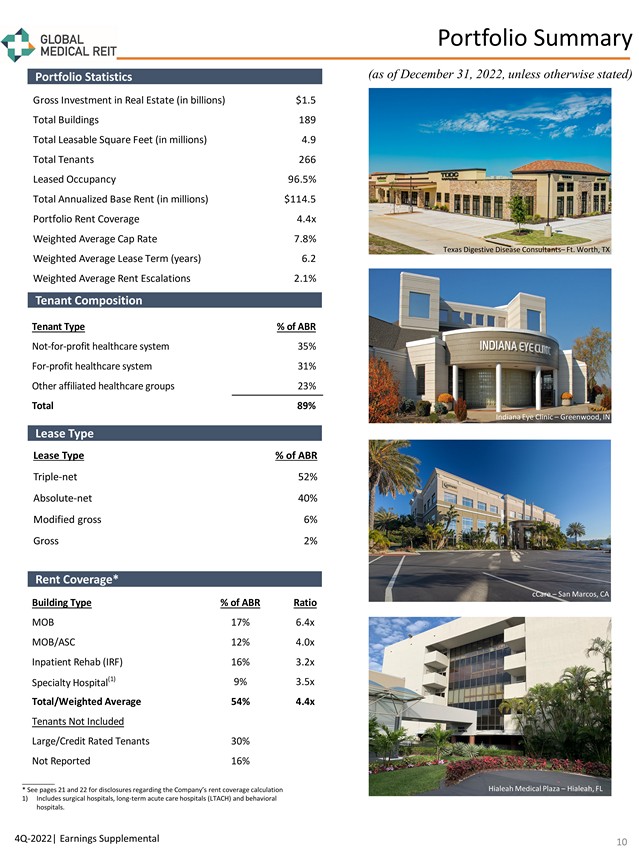
(as of December 31, 2022, unless otherwise stated) Lease Type % of ABR Triple - net 52% Absolute - net 40% Modified gross 6% Gross 2% Portfolio Statistics Lease Type Rent Coverage* Portfolio Summary 10 4Q - 2022| Earnings Supplemental Indiana Eye Clinic – Greenwood, IN Texas Digestive Disease Consultants – Ft. Worth, TX cCare – San Marcos, CA cCare – San Marcos, CA _________ * See pages 21 and 22 for disclosures regarding the Company’s rent coverage calculation 1) Includes surgical hospitals, long - term acute care hospitals (LTACH) and behavioral hospitals. Tenant Composition Hialeah Medical Plaza – Hialeah, FL Tenant Type % of ABR Not-for-profit healthcare system 35% For-profit healthcare system 31% Other affiliated healthcare groups 23% Total 89% Building Type % of ABR Ratio MOB 17% 6.4x MOB/ASC 12% 4.0x Inpatient Rehab (IRF) 16% 3.2x Specialty Hospital (1) 9% 3.5x Total/Weighted Average 54% 4.4x Tenants Not Included Large/Credit Rated Tenants 30% Not Reported 16% Gross Investment in Real Estate (in billions) $1.5 Total Buildings 189 Total Leasable Square Feet (in millions) 4.9 Total Tenants 266 Leased Occupancy 96.5% Total Annualized Base Rent (in millions) $114.5 Portfolio Rent Coverage 4.4x Weighted Average Cap Rate 7.8% Weighted Average Lease Term (years) 6.2 Weighted Average Rent Escalations 2.1%
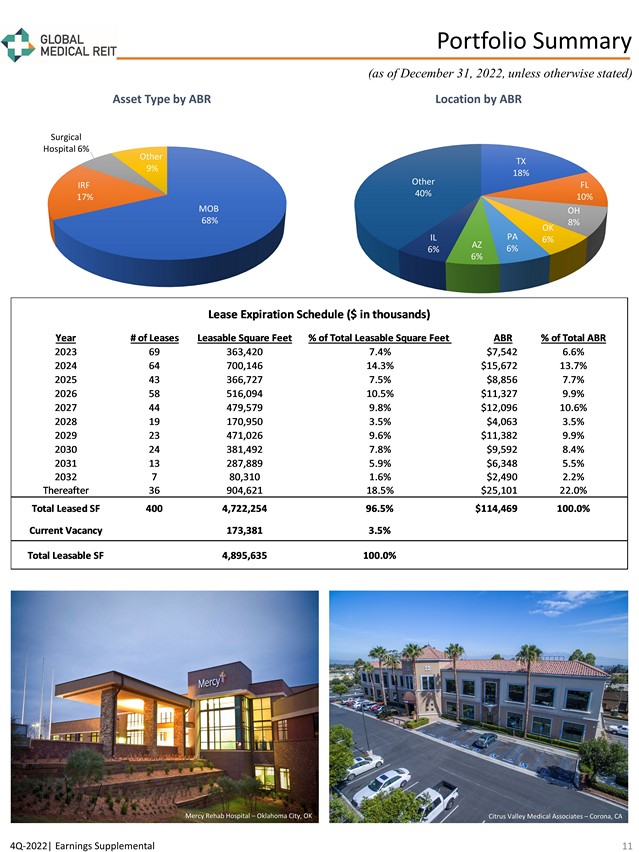
(as of December 31, 2022, unless otherwise stated) MOB 68% IRF 17% Surgical Hospital 6% Other 9% Asset Type by ABR TX 18% FL 10% OH 8% OK 6% PA 6% AZ 6% IL 6% Other 40% Location by ABR Citrus Valley – Corona CA Citrus Valley Medical Building – Corona, CA Portfolio Summary 11 4Q - 2022| Earnings Supplemental Mercy Rehab Hospital – Oklahoma City, OK Citrus Valley Medical Associates – Corona, CA Year # of Leases Leasable Square Feet % of Total Leasable Square Feet ABR % of Total ABR 2023 69 363,420 7.4% $7,542 6.6% 2024 64 700,146 14.3% $15,672 13.7% 2025 43 366,727 7.5% $8,856 7.7% 2026 58 516,094 10.5% $11,327 9.9% 2027 44 479,579 9.8% $12,096 10.6% 2028 19 170,950 3.5% $4,063 3.5% 2029 23 471,026 9.6% $11,382 9.9% 2030 24 381,492 7.8% $9,592 8.4% 2031 13 287,889 5.9% $6,348 5.5% 2032 7 80,310 1.6% $2,490 2.2% Thereafter 36 904,621 18.5% $25,101 22.0% Total Leased SF 400 4,722,254 96.5% $114,469 100.0% Current Vacancy 173,381 3.5% Total Leasable SF 4,895,635 100.0% Lease Expiration Schedule ($ in thousands)
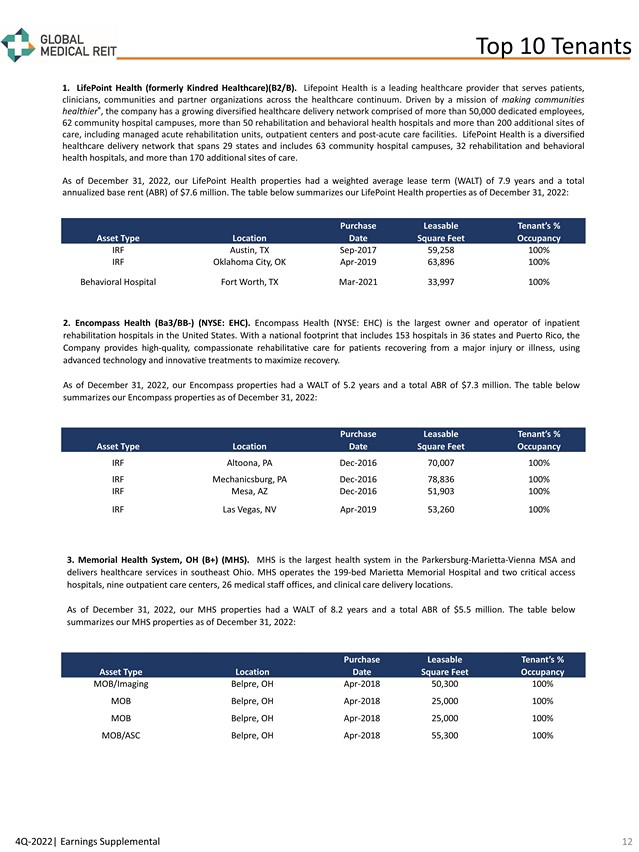
2. Encompass Health (Ba 3 /BB - ) (NYSE : EHC) . Encompass Health (NYSE : EHC) is the largest owner and operator of inpatient rehabilitation hospitals in the United States . With a national footprint that includes 153 hospitals in 36 states and Puerto Rico, the Company provides high - quality, compassionate rehabilitative care for patients recovering from a major injury or illness, using advanced technology and innovative treatments to maximize recovery . As of December 31 , 2022 , our Encompass properties had a WALT of 5 . 2 years and a total ABR of $ 7 . 3 million . The table below summarizes our Encompass properties as of December 31 , 2022 : 4Q - 2022| Earnings Supplemental 1 . LifePoint Health (formerly Kindred Healthcare)(B 2 /B) . Lifepoint Health is a leading healthcare provider that serves patients, clinicians, communities and partner organizations across the healthcare continuum . Driven by a mission of making communities healthier ® , the company has a growing diversified healthcare delivery network comprised of more than 50 , 000 dedicated employees, 62 community hospital campuses, more than 50 rehabilitation and behavioral health hospitals and more than 200 additional sites of care, including managed acute rehabilitation units, outpatient centers and post - acute care facilities . LifePoint Health is a diversified healthcare delivery network that spans 29 states and includes 63 community hospital campuses, 32 rehabilitation and behavioral health hospitals, and more than 170 additional sites of care . As of December 31 , 2022 , our LifePoint Health properties had a weighted average lease term (WALT) of 7 . 9 years and a total annualized base rent (ABR) of $ 7 . 6 million . The table below summarizes our LifePoint Health properties as of December 31 , 2022 : Asset Type Location Purchase Date Leasable Square Feet Tenant’s % Occupancy IRF Austin, TX Sep - 2017 59,258 100% IRF Oklahoma City, OK Apr - 2019 63,896 100% Behavioral Hospital Fort Worth, TX Mar - 2021 33,997 100% Asset Type Location Purchase Date Leasable Square Feet Tenant’s % Occupancy IRF Altoona, PA Dec - 2016 70,007 100% IRF Mechanicsburg, PA Dec - 2016 78,836 100% IRF Mesa, AZ Dec - 2016 51,903 100% IRF Las Vegas, NV Apr - 2019 53,260 100% Top 10 Tenant s 12 3 . Memorial Health System, OH (B+) (MHS) . MHS is the largest health system in the Parkersburg - Marietta - Vienna MSA and delivers healthcare services in southeast Ohio . MHS operates the 199 - bed Marietta Memorial Hospital and two critical access hospitals, nine outpatient care centers, 26 medical staff offices, and clinical care delivery locations . As of December 31 , 2022 , our MHS properties had a WALT of 8 . 2 years and a total ABR of $ 5 . 5 million . The table below summarizes our MHS properties as of December 31 , 2022 : Asset Type Location Purchase Date Leasable Square Feet Tenant’s % Occupancy MOB/Imaging Belpre, OH Apr - 2018 50,300 100% MOB Belpre, OH Apr - 2018 25,000 100% MOB Belpre, OH Apr - 2018 25,000 100% MOB/ASC Belpre, OH Apr - 2018 55,300 100%
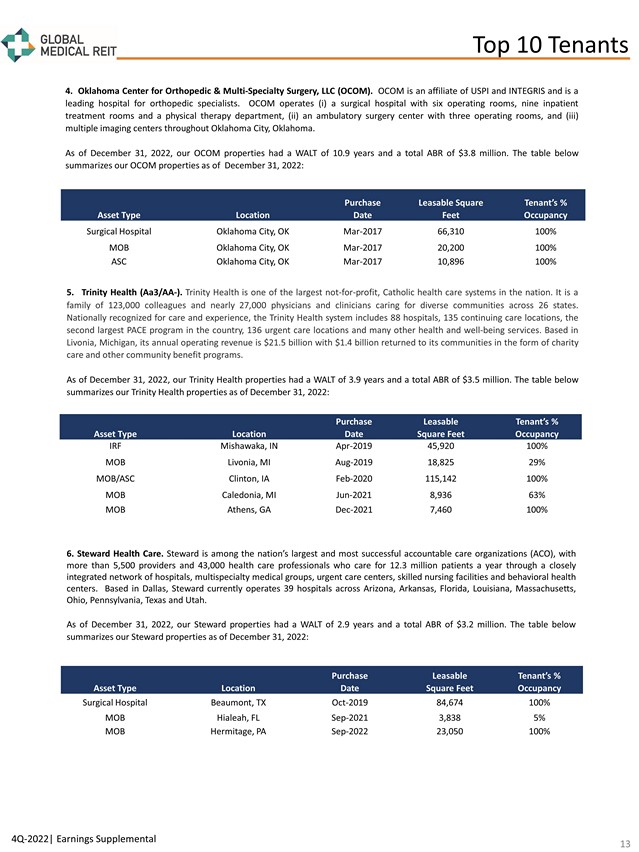
4Q - 2022| Earnings Supplemental 4 . Oklahoma Center for Orthopedic & Multi - Specialty Surgery, LLC (OCOM) . OCOM is an affiliate of USPI and INTEGRIS and is a leading hospital for orthopedic specialists . OCOM operates (i) a surgical hospital with six operating rooms, nine inpatient treatment rooms and a physical therapy department, (ii) an ambulatory surgery center with three operating rooms, and (iii) multiple imaging centers throughout Oklahoma City, Oklahoma . As of December 31 , 2022 , our OCOM properties had a WALT of 10 . 9 years and a total ABR of $ 3 . 8 million . The table below summarizes our OCOM properties as of December 31 , 2022 : Asset Type Location Purchase Date Leasable Square Feet Tenant’s % Occupancy Surgical Hospital Oklahoma City, OK Mar - 2017 66,310 100% MOB Oklahoma City, OK Mar - 2017 20,200 100% ASC Oklahoma City, OK Mar - 2017 10,896 100% Top 10 Tenants 13 5 . Trinity Health (Aa 3 /AA - ) . Trinity Health is one of the largest not - for - profit, Catholic health care systems in the nation . It is a family of 123 , 000 colleagues and nearly 27 , 000 physicians and clinicians caring for diverse communities across 26 states . Nationally recognized for care and experience, the Trinity Health system includes 88 hospitals, 135 continuing care locations, the second largest PACE program in the country, 136 urgent care locations and many other health and well - being services . Based in Livonia, Michigan, its annual operating revenue is $ 21 . 5 billion with $ 1 . 4 billion returned to its communities in the form of charity care and other community benefit programs . As of December 31 , 2022 , our Trinity Health properties had a WALT of 3 . 9 years and a total ABR of $ 3 . 5 million . The table below summarizes our Trinity Health properties as of December 31 , 2022 : Asset Type Location Purchase Date Leasable Square Feet Tenant’s % Occupancy IRF Mishawaka, IN Apr - 2019 45,920 100% MOB Livonia, MI Aug - 2019 18,825 29% MOB/ASC Clinton, IA Feb - 2020 115,142 100% MOB Caledonia, MI Jun - 2021 8,936 63% MOB Athens, GA Dec - 2021 7,460 100% 6 . Steward Health Care . Steward is among the nation’s largest and most successful accountable care organizations (ACO), with more than 5 , 500 providers and 43 , 000 health care professionals who care for 12 . 3 million patients a year through a closely integrated network of hospitals, multispecialty medical groups, urgent care centers, skilled nursing facilities and behavioral health centers . Based in Dallas, Steward currently operates 39 hospitals across Arizona, Arkansas, Florida, Louisiana, Massachusetts, Ohio, Pennsylvania, Texas and Utah . As of December 31 , 2022 , our Steward properties had a WALT of 2 . 9 years and a total ABR of $ 3 . 2 million . The table below summarizes our Steward properties as of December 31 , 2022 : Asset Type Location Purchase Date Leasable Square Feet Tenant’s % Occupancy Surgical Hospital Beaumont, TX Oct - 2019 84,674 100% MOB Hialeah, FL Sep - 2021 3,838 5% MOB Hermitage, PA Sep - 2022 23,050 100%
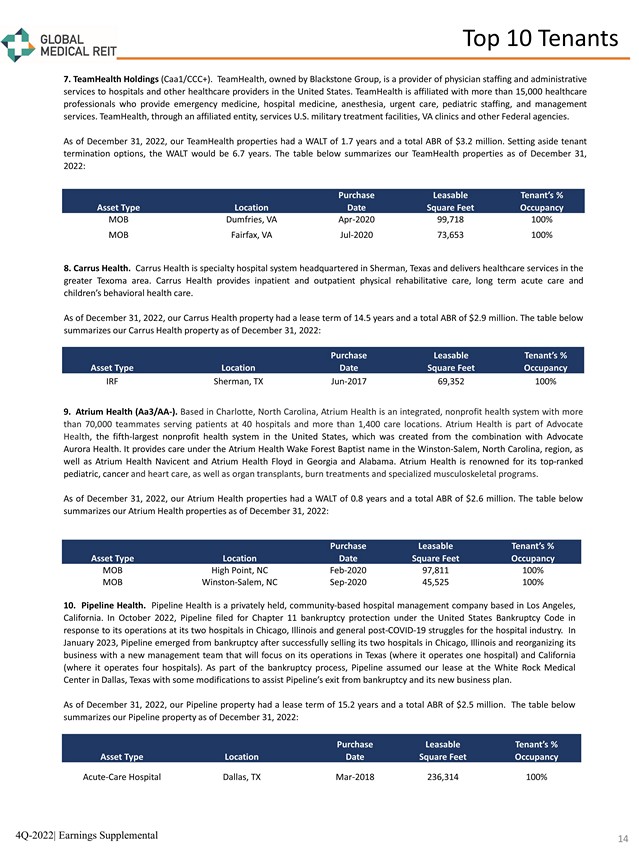
4Q - 2022| Earnings Supplemental 8 . Carrus Health . Carrus Health is specialty hospital system headquartered in Sherman, Texas and delivers healthcare services in the greater Texoma area . Carrus Health provides inpatient and outpatient physical rehabilitative care, long term acute care and children’s behavioral health care . As of December 31 , 2022 , our Carrus Health property had a lease term of 14 . 5 years and a total ABR of $ 2 . 9 million . The table below summarizes our Carrus Health property as of December 31 , 2022 : Asset Type Location Purchase Date Leasable Square Feet Tenant’s % Occupancy IRF Sherman, TX Jun - 2017 69,352 100% Top 10 Tenants 14 9. Atrium Health (Aa 3 /AA - ) . Based in Charlotte, North Carolina, Atrium Health is an integrated, nonprofit health system with more than 70 , 000 teammates serving patients at 40 hospitals and more than 1 , 400 care locations . Atrium Health is part of Advocate Health , the fifth - largest nonprofit health system in the United States, which was created from the combination with Advocate Aurora Health . It provides care under the Atrium Health Wake Forest Baptist name in the Winston - Salem, North Carolina, region, as well as Atrium Health Navicent and Atrium Health Floyd in Georgia and Alabama . Atrium Health is renowned for its top - ranked pediatric, cancer and heart care, as well as organ transplants, burn treatments and specialized musculoskeletal programs . As of December 31 , 2022 , our Atrium Health properties had a WALT of 0 . 8 years and a total ABR of $ 2 . 6 million . The table below summarizes our Atrium Health properties as of December 31 , 2022 : Asset Type Location Purchase Date Leasable Square Feet Tenant’s % Occupancy MOB High Point, NC Feb - 2020 97,811 100% MOB Winston - Salem, NC Sep - 2020 45,525 100% 10 . Pipeline Health . Pipeline Health is a privately held, community-based hospital management company based in Los Angeles, California . In October 2022 , Pipeline filed for Chapter 11 bankruptcy protection under the United States Bankruptcy Code in response to its operations at its two hospitals in Chicago, Illinois and general post - COVID - 19 struggles for the hospital industry . In January 2023 , Pipeline emerged from bankruptcy after successfully selling its two hospitals in Chicago, Illinois and reorganizing its business with a new management team that will focus on its operations in Texas (where it operates one hospital) and California (where it operates four hospitals) . As part of the bankruptcy process, Pipeline assumed our lease at the White Rock Medical Center in Dallas, Texas with some modifications to assist Pipeline’s exit from bankruptcy and its new business plan . As of December 31 , 2022 , our Pipeline property had a lease term of 15 . 2 years and a total ABR of $ 2 . 5 million . The table below summarizes our Pipeline property as of December 31 , 2022 : Asset Type Location Purchase Date Leasable Square Feet Tenant’s % Occupancy Acute - Care Hospital Dallas, TX Mar - 2018 236,314 100% Asset Type Location Purchase Date Leasable Square Feet Tenant’s % Occupancy MOB Dumfries, VA Apr - 2020 99,718 100% MOB Fairfax, VA Jul - 2020 73,653 100% 7 . TeamHealth Holdings (Caa 1 /CCC+) . TeamHealth, owned by Blackstone Group, is a provider of physician staffing and administrative services to hospitals and other healthcare providers in the United States . TeamHealth is affiliated with more than 15 , 000 healthcare professionals who provide emergency medicine, hospital medicine, anesthesia, urgent care, pediatric staffing, and management services . TeamHealth, through an affiliated entity, services U . S . military treatment facilities, VA clinics and other Federal agencies . As of December 31 , 2022 , our TeamHealth properties had a WALT of 1 . 7 years and a total ABR of $ 3 . 2 million . Setting aside tenant termination options, the WALT would be 6 . 7 years . The table below summarizes our TeamHealth properties as of December 31 , 2022 :
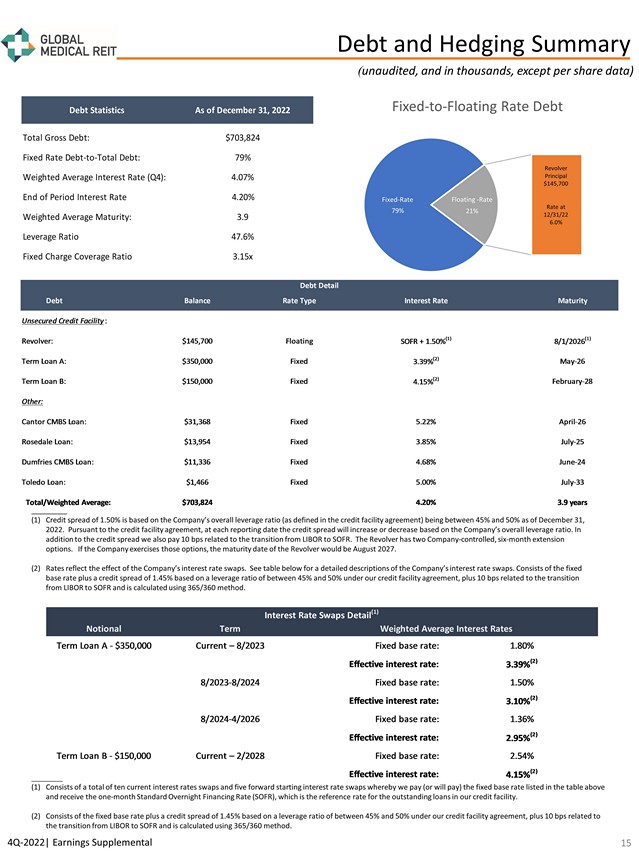
4Q - 2022| Earnings Supplemental ( unaudited, and in thousands, except per share data) Debt and Hedging Summary 15 _________ (1) Credit spread of 1.50% is based on the Company’s overall leverage ratio (as defined in the credit facility agreement) being b etw een 45% and 50% as of December 31, 2022. Pursuant to the credit facility agreement, at each reporting date the credit spread will increase or decrease based on th e Company’s overall leverage ratio. In addition to the credit spread we also pay 10 bps related to the transition from LIBOR to SOFR. The Revolver has two Company - con trolled, six - month extension options. If the Company exercises those options, the maturity date of the Revolver would be August 2027. (2) Rates reflect the effect of the Company’s interest rate swaps. See table below for a detailed descriptions of the Company’s int erest rate swaps. Consists of the fixed base rate plus a credit spread of 1.45% based on a leverage ratio of between 45% and 50% under our credit facility agreement, pl us 10 bps related to the transition from LIBOR to SOFR and is calculated using 365/360 method. __________ (1) Consists of a total of ten current interest rates swaps and five forward starting interest rate swaps whereby we pay (or will pa y) the fixed base rate listed in the table above and receive the one - month Standard Overnight Financing Rate (SOFR), which is the reference rate for the outstanding loans in our credit facility. (2) Consists of the fixed base rate plus a credit spread of 1.45% based on a leverage ratio of between 45% and 50% under our cred it facility agreement, plus 10 bps related to the transition from LIBOR to SOFR and is calculated using 365/360 method. 79% 21% 21% Fixed - to - Floating Rate Debt Fixed - Rate Floating - Rate Revolver Principal $145,700 Rate at 12/31/22 6.0% Notional Term Term Loan A - $350,000 Current – 8/2023 Fixed base rate: 1.80% Effective interest rate: 3.39% (2) 8/2023-8/2024 Fixed base rate: 1.50% Effective interest rate: 3.10% (2) 8/2024-4/2026 Fixed base rate: 1.36% Effective interest rate: 2.95% (2) Term Loan B - $150,000 Current – 2/2028 Fixed base rate: 2.54% Effective interest rate: 4.15% (2) Interest Rate Swaps Detail (1) Weighted Average Interest Rates Debt Statistics As of December 31, 2022 Total Gross Debt: $703,824 Fixed Rate Debt-to-Total Debt: 79% Weighted Average Interest Rate (Q4): 4.07% End of Period Interest Rate 4.20% Weighted Average Maturity: 3.9 Leverage Ratio 47.6% Fixed Charge Coverage Ratio 3.15x Debt Balance Rate Type Interest Rate Maturity Unsecured Credit Facility: Revolver: $145,700 Floating SOFR + 1.50% (1) 8/1/2026 (1) Term Loan A: $350,000 Fixed 3.39% (2) May-26 Term Loan B: $150,000 Fixed 4.15% (2) February-28 Other: Cantor CMBS Loan: $31,368 Fixed 5.22% April-26 Rosedale Loan: $13,954 Fixed 3.85% July-25 Dumfries CMBS Loan: $11,336 Fixed 4.68% June-24 Toledo Loan: $1,466 Fixed 5.00% July-33 Total/Weighted Average: $703,824 4.20% 3.9 years Debt Detail
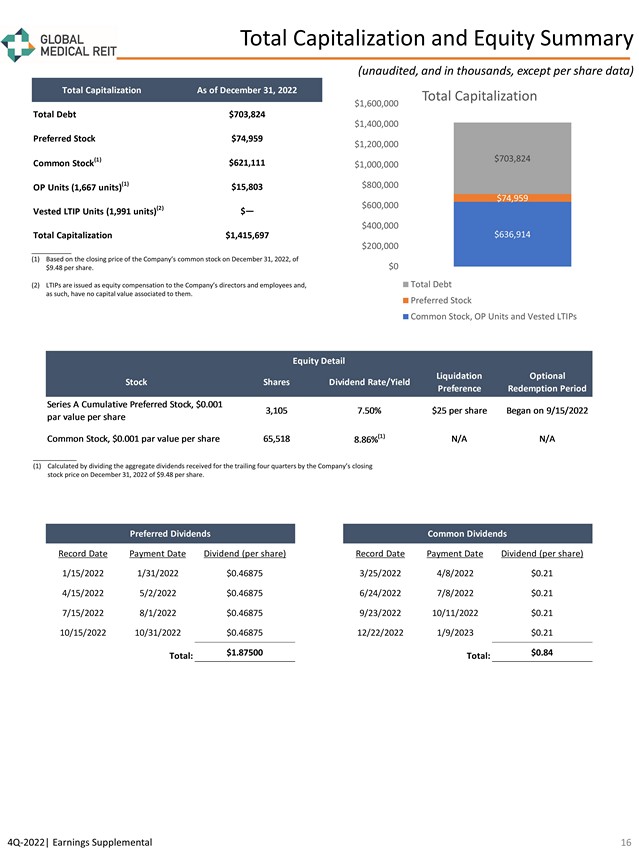
16 Total Capitalization and Equity Summary (unaudited, and in thousands, except per share data) 4Q - 2022| Earnings Supplemental ____________ (1) Calculated by dividing the aggregate dividends received for the trailing four quarters by the Company’s closing stock price on December 31, 2022 of $9.48 per share. ___________ (1) Based on the closing price of the Company’s common stock on December 31, 2022, of $9.48 per share. (2) LTIPs are issued as equity compensation to the Company’s directors and employees and, as such, have no capital value associated to them. $636,914 $74,959 $703,824 $0 $200,000 $400,000 $600,000 $800,000 $1,000,000 $1,200,000 $1,400,000 $1,600,000 Total Capitalization Total Debt Preferred Stock Common Stock, OP Units and Vested LTIPs Preferred Dividends Total Capitalization As of December 31, 2022 Total Debt $703,824 Preferred Stock $74,959 Common Stock (1) $621,111 OP Units (1,667 units) (1) $15,803 Vested LTIP Units (1,991 units) (2) $— Total Capitalization $1,415,697 Record Date Payment Date Dividend (per share) 1/15/2022 1/31/2022 $0.46875 4/15/2022 5/2/2022 $0.46875 7/15/2022 8/1/2022 $0.46875 10/15/2022 10/31/2022 $0.46875 Total: $1.87500 Preferred Dividends Stock Shares Dividend Rate/Yield Liquidation Preference Optional Redemption Period Series A Cumulative Preferred Stock, $0.001 par value per share 3,105 7.50% $25 per share Began on 9/15/2022 Common Stock, $0.001 par value per share 65,518 8.86% (1) N/A N/A Equity Detail Record Date Payment Date Dividend (per share) 3/25/2022 4/8/2022 $0.21 6/24/2022 7/8/2022 $0.21 9/23/2022 10/11/2022 $0.21 12/22/2022 1/9/2023 $0.21 Total: $0.84 Common Dividends
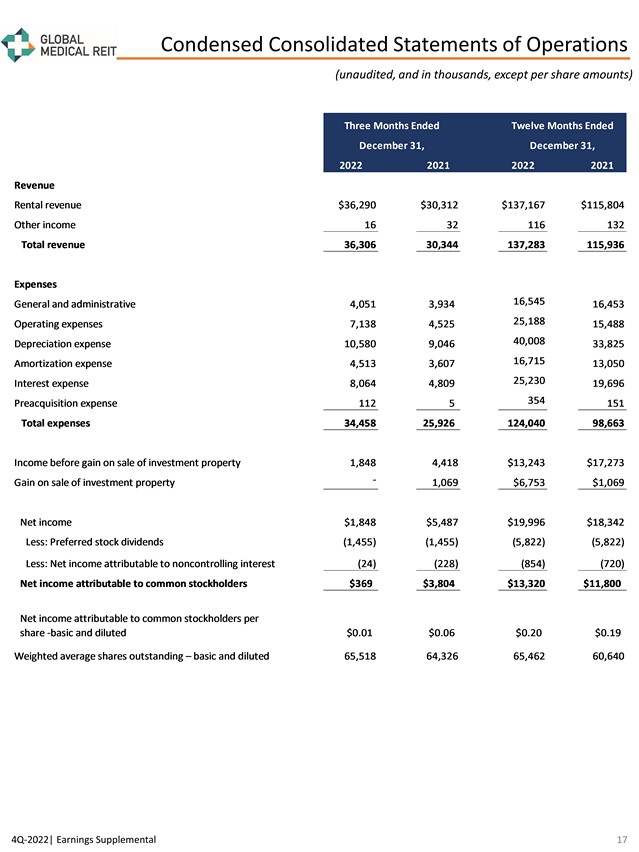
4Q - 2022| Earnings Supplemental (unaudited, and in thousands, except per share amounts) Condensed Consolidated Statements of Operations 17 2022 2021 2022 2021 Revenue Rental revenue $36,290 $30,312 $137,167 $115,804 Other income 16 32 116 132 Total revenue 36,306 30,344 137,283 115,936 Expenses General and administrative 4,051 3,934 16,545 16,453 Operating expenses 7,138 4,525 25,188 15,488 Depreciation expense 10,580 9,046 40,008 33,825 Amortization expense 4,513 3,607 16,715 13,050 Interest expense 8,064 4,809 25,230 19,696 Preacquisition expense 112 5 354 151 Total expenses 34,458 25,926 124,040 98,663 Income before gain on sale of investment property 1,848 4,418 $13,243 $17,273 Gain on sale of investment property - 1,069 $6,753 $1,069 Net income $1,848 $5,487 $19,996 $18,342 Less: Preferred stock dividends (1,455) (1,455) (5,822) (5,822) Less: Net income attributable to noncontrolling interest (24) (228) (854) (720) Net income attributable to common stockholders $369 $3,804 $13,320 $11,800 Net income attributable to common stockholders per share -basic and diluted $0.01 $0.06 $0.20 $0.19 Weighted average shares outstanding – basic and diluted 65,518 64,326 65,462 60,640 Three Months Ended December 31, Twelve Months Ended December 31,
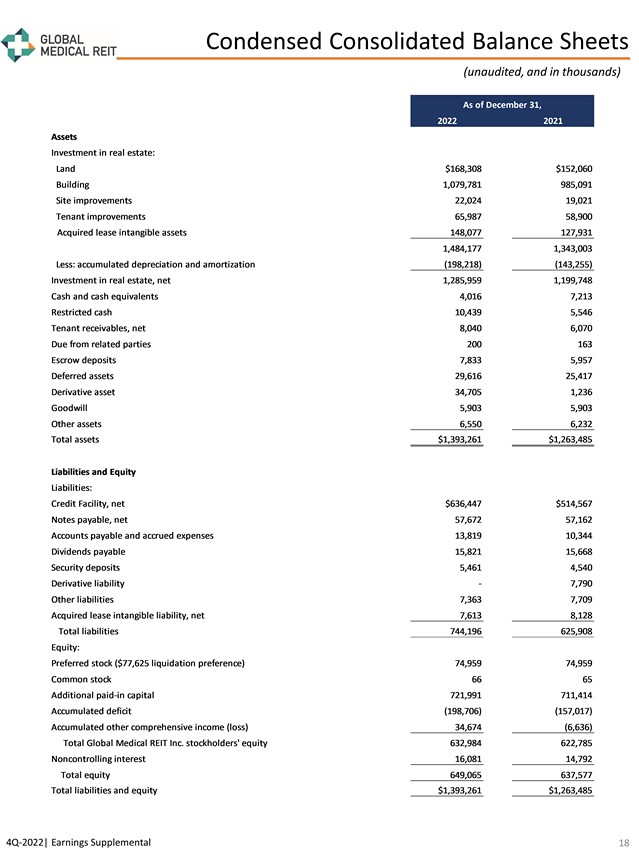
4Q - 2022| Earnings Supplemental (unaudited, and in thousands) Condensed Consolidated Balance Sheets 18 2022 2021 Assets Investment in real estate: Land $168,308 $152,060 Building 1,079,781 985,091 Site improvements 22,024 19,021 Tenant improvements 65,987 58,900 Acquired lease intangible assets 148,077 127,931 1,484,177 1,343,003 Less: accumulated depreciation and amortization (198,218) (143,255) Investment in real estate, net 1,285,959 1,199,748 Cash and cash equivalents 4,016 7,213 Restricted cash 10,439 5,546 Tenant receivables, net 8,040 6,070 Due from related parties 200 163 Escrow deposits 7,833 5,957 Deferred assets 29,616 25,417 Derivative asset 34,705 1,236 Goodwill 5,903 5,903 Other assets 6,550 6,232 Total assets $1,393,261 $1,263,485 Liabilities and Equity Liabilities: Credit Facility, net $636,447 $514,567 Notes payable, net 57,672 57,162 Accounts payable and accrued expenses 13,819 10,344 Dividends payable 15,821 15,668 Security deposits 5,461 4,540 Derivative liability - 7,790 Other liabilities 7,363 7,709 Acquired lease intangible liability, net 7,613 8,128 Total liabilities 744,196 625,908 Equity: Preferred stock ($77,625 liquidation preference) 74,959 74,959 Common stock 66 65 Additional paid-in capital 721,991 711,414 Accumulated deficit (198,706) (157,017) Accumulated other comprehensive income (loss) 34,674 (6,636) Total Global Medical REIT Inc. stockholders' equity 632,984 622,785 Noncontrolling interest 16,081 14,792 Total equity 649,065 637,577 Total liabilities and equity $1,393,261 $1,263,485 As of December 31,
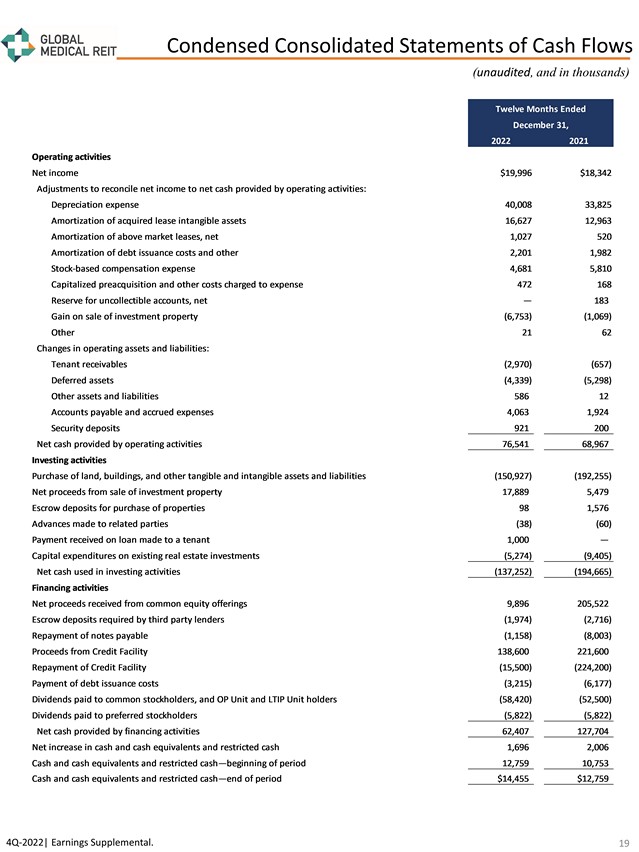
( unaudited , and in thousands) 4Q - 2022| Earnings Supplemental. Condensed Consolidated Statements of Cash Flows 19 2022 2021 Operating activities Net income $19,996 $18,342 Adjustments to reconcile net income to net cash provided by operating activities: Depreciation expense 40,008 33,825 Amortization of acquired lease intangible assets 16,627 12,963 Amortization of above market leases, net 1,027 520 Amortization of debt issuance costs and other 2,201 1,982 Stock-based compensation expense 4,681 5,810 Capitalized preacquisition and other costs charged to expense 472 168 Reserve for uncollectible accounts, net — 183 Gain on sale of investment property (6,753) (1,069) Other 21 62 Changes in operating assets and liabilities: Tenant receivables (2,970) (657) Deferred assets (4,339) (5,298) Other assets and liabilities 586 12 Accounts payable and accrued expenses 4,063 1,924 Security deposits 921 200 Net cash provided by operating activities 76,541 68,967 Investing activities Purchase of land, buildings, and other tangible and intangible assets and liabilities (150,927) (192,255) Net proceeds from sale of investment property 17,889 5,479 Escrow deposits for purchase of properties 98 1,576 Advances made to related parties (38) (60) Payment received on loan made to a tenant 1,000 — Capital expenditures on existing real estate investments (5,274) (9,405) Net cash used in investing activities (137,252) (194,665) Financing activities Net proceeds received from common equity offerings 9,896 205,522 Escrow deposits required by third party lenders (1,974) (2,716) Repayment of notes payable (1,158) (8,003) Proceeds from Credit Facility 138,600 221,600 Repayment of Credit Facility (15,500) (224,200) Payment of debt issuance costs (3,215) (6,177) Dividends paid to common stockholders, and OP Unit and LTIP Unit holders (58,420) (52,500) Dividends paid to preferred stockholders (5,822) (5,822) Net cash provided by financing activities 62,407 127,704 Net increase in cash and cash equivalents and restricted cash 1,696 2,006 Cash and cash equivalents and restricted cash—beginning of period 12,759 10,753 Cash and cash equivalents and restricted cash—end of period $14,455 $12,759 Twelve Months Ended December 31,
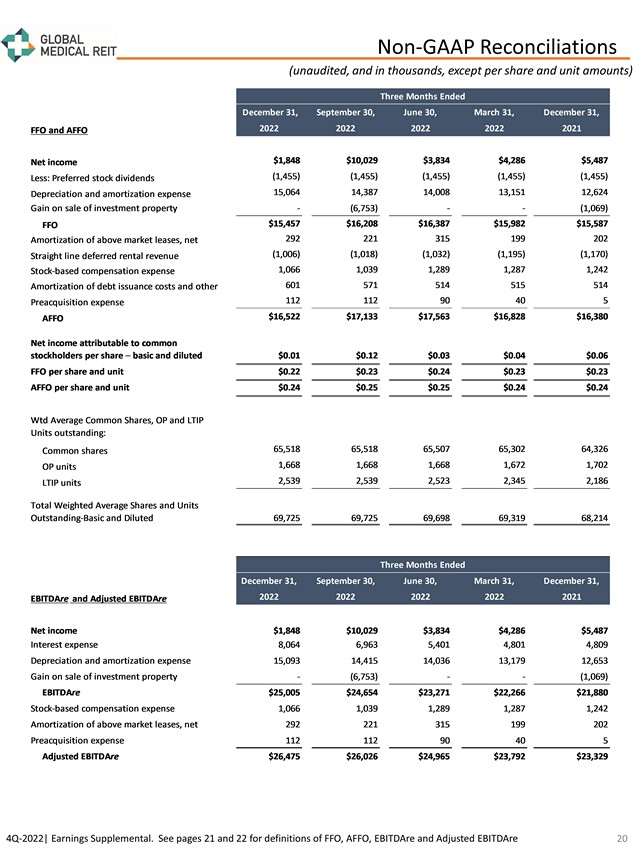
4Q - 2022| Earnings Supplemental. See pages 21 and 22 for definitions of FFO, AFFO, EBITDAre and Adjusted EBITDAre (unaudited, and in thousands, except per share and unit amounts) Non - GAAP Reconciliations 20 December 31, September 30, June 30, March 31, December 31, FFO and AFFO 2022 2022 2022 2022 2021 Net income $1,848 $10,029 $3,834 $4,286 $5,487 Less: Preferred stock dividends (1,455) (1,455) (1,455) (1,455) (1,455) Depreciation and amortization expense 15,064 14,387 14,008 13,151 12,624 Gain on sale of investment property - (6,753) - - (1,069) FFO $15,457 $16,208 $16,387 $15,982 $15,587 Amortization of above market leases, net 292 221 315 199 202 Straight line deferred rental revenue (1,006) (1,018) (1,032) (1,195) (1,170) Stock-based compensation expense 1,066 1,039 1,289 1,287 1,242 Amortization of debt issuance costs and other 601 571 514 515 514 Preacquisition expense 112 112 90 40 5 AFFO $16,522 $17,133 $17,563 $16,828 $16,380 Net income attributable to common stockholders per share – basic and diluted $0.01 $0.12 $0.03 $0.04 $0.06 FFO per share and unit $0.22 $0.23 $0.24 $0.23 $0.23 AFFO per share and unit $0.24 $0.25 $0.25 $0.24 $0.24 Wtd Average Common Shares, OP and LTIP Units outstanding: Common shares 65,518 65,518 65,507 65,302 64,326 OP units 1,668 1,668 1,668 1,672 1,702 LTIP units 2,539 2,539 2,523 2,345 2,186 Total Weighted Average Shares and Units Outstanding-Basic and Diluted 69,725 69,725 69,698 69,319 68,214 December 31, September 30, June 30, March 31, December 31, EBITDAre and Adjusted EBITDAre 2022 2022 2022 2022 2021 Net income $1,848 $10,029 $3,834 $4,286 $5,487 Interest expense 8,064 6,963 5,401 4,801 4,809 Depreciation and amortization expense 15,093 14,415 14,036 13,179 12,653 Gain on sale of investment property - (6,753) - - (1,069) EBITDAre $25,005 $24,654 $23,271 $22,266 $21,880 Stock-based compensation expense 1,066 1,039 1,289 1,287 1,242 Amortization of above market leases, net 292 221 315 199 202 Preacquisition expense 112 112 90 40 5 Adjusted EBITDAre $26,475 $26,026 $24,965 $23,792 $23,329 Three Months Ended Three Months Ended
Reporting Definitions Annualized Base Rent Annualized base rent represents monthly base rent for December 2022 , multiplied by 12 (or base rent net of annualized expenses for properties with gross leases) . Accordingly, this methodology produces an annualized amount as of a point in time but does not take into account future (i) contractual rental rate increases, (ii) leasing activity or (iii) lease expirations . Additionally, leases that are accounted for on a cash - collected basis are not included in annualized base rent . Capitalization Rate The capitalization rate (“Cap Rate”) for an acquisition is calculated by dividing current Annualized Base Rent by contractual purchase price . For the portfolio capitalization rate, certain adjustments, including for subsequent capital invested, are made to the contractual purchase price . Earnings Before Interest, Taxes, Depreciation and Amortization for Real Estate (“ EBITDA re ” and “Adjusted EBITDA re ” ) We calculate EBITDA re in accordance with standards established by NAREIT and define EBITDA re as net income or loss computed in accordance with GAAP plus depreciation and amortization, interest expense, gain or loss on the sale of investment properties, and impairment loss, as applicable . We define Adjusted EBITDA re as EBITDA re plus non - cash stock compensation expense, non - cash intangible amortization related to above and below market leases, preacquisition expense and other normalizing items . Management considers EBITDA re and Adjusted EBITDA re important measures because they provide additional information to allow management, investors, and our current and potential creditors to evaluate and compare our core operating results and our ability to service debt . Funds from Operations and Adjusted Funds from Operations Funds from operations (“FFO”) and adjusted funds from operations (“AFFO”) are non - GAAP financial measures within the meaning of the rules of the SEC . The Company considers FFO and AFFO to be important supplemental measures of its operating performance and believes FFO is frequently used by securities analysts, investors, and other interested parties in the evaluation of REITs, many of which present FFO when reporting their results . In accordance with the National Association of Real Estate Investment Trusts’ (“NAREIT”) definition, FFO means net income or loss computed in accordance with GAAP before noncontrolling interests of holders of OP units and LTIP units, excluding gains (or losses) from sales of property and extraordinary items, less preferred stock dividends, plus real estate - related depreciation and amortization (excluding amortization of debt issuance costs and the amortization of above and below market leases), and after adjustments for unconsolidated partnerships and joint ventures . Because FFO excludes real estate - related depreciation and amortization (other than amortization of debt issuance costs and above and below market lease amortization expense), the Company believes that FFO provides a performance measure that, when compared period - over - period, reflects the impact to operations from trends in occupancy rates, rental rates, operating costs, development activities and interest costs, providing perspective not immediately apparent from the closest GAAP measurement, net income or loss . AFFO is a non - GAAP measure used by many investors and analysts to measure a real estate company’s operating performance by removing the effect of items that do not reflect ongoing property operations . Management calculates AFFO by modifying the NAREIT computation of FFO by adjusting it for certain cash and non - cash items and certain recurring and non - recurring items . For the Company these items include recurring acquisition and disposition costs, loss on the extinguishment of debt, recurring straight line deferred rental revenue, recurring stock - based compensation expense, recurring amortization of above and below market leases, recurring amortization of debt issuance costs, recurring lease commissions, and other items . Management believes that reporting AFFO in addition to FFO is a useful supplemental measure for the investment community to use when evaluating the operating performance of the Company on a comparative basis . (as of December 31, 2022) 4Q - 2022| Earnings Supplemental Reporting Definitions and Other Disclosures 21
Reporting Definitions (continued) Rent Coverage Ratio For purposes of calculating our portfolio weighted - average EBITDARM coverage ratio (“Rent Coverage Ratio”), we excluded credit - rated tenants or their subsidiaries for which financial statements were either not available or not sufficiently detailed . These ratios are based on latest available information only . Most tenant financial statements are unaudited and we have not independently verified any tenant financial information (audited or unaudited) and, therefore, we cannot assure you that such information is accurate or complete . Certain other tenants (approximately 16 % of our portfolio) are excluded from the calculation due to (i) lack of available financial information or (ii) small tenant size . Additionally, included within 16 % of non - reporting tenants is Pipeline Healthcare, which filed for Chapter 11 bankruptcy protection in October of 2022 . Additionally , our Rent Coverage Ratio adds back physician distributions and compensation . Management believes all adjustments are reasonable and necessary . Other Disclosures Non - GAAP Financial Measures Management considers certain non - GAAP financial measures to be useful supplemental measures of the Company's operating performance . For the Company, non - GAAP measures consist of EBITDA re , Adjusted EBITDA re , FFO and AFFO . A non - GAAP financial measure is generally defined as one that purports to measure financial performance, financial position or cash flows, but excludes or includes amounts that would not be so adjusted in the most comparable measure determined in accordance with GAAP . The Company reports non - GAAP financial measures because these measures are observed by management to also be among the most predominant measures used by the REIT industry and by industry analysts to evaluate REITs . For these reasons, management deems it appropriate to disclose and discuss these non - GAAP financial measures . The non - GAAP financial measures presented herein are not necessarily identical to those presented by other real estate companies due to the fact that not all real estate companies use the same definitions . These measures should not be considered as alternatives to net income, as indicators of the Company's financial performance, or as alternatives to cash flow from operating activities as measures of the Company's liquidity, nor are these measures necessarily indicative of sufficient cash flow to fund all of the Company's needs . Management believes that in order to facilitate a clear understanding of the Company's historical consolidated operating results, these measures should be examined in conjunction with net income and cash flows from operations as presented elsewhere herein . Additional Information The information in this document should be read in conjunction with the Company’s Annual Report on Form 10 - K, Quarterly Reports on Form 10 - Q, Current Reports on Form 8 - K, and other information filed with, or furnished to, the SEC . You can access the Company’s reports and amendments to those reports filed or furnished to the SEC pursuant to Section 13 (a) or 15 (d) of the Exchange Act in the “Investor Relations” section on the Company’s website (www . globalmedicalreit . com) under “SEC Filings” as soon as reasonably practicable after they are filed with, or furnished to, the SEC . The information on or connected to the Company’s website is not, and shall not be deemed to be, a part of, or incorporated into, this Earnings Supplemental . You also can review these SEC filings and other information by accessing the SEC’s website at http : //www . sec . gov . Certain information contained in this package, including, but not limited to, information contained in our Top 10 tenant profiles is derived from publicly - available third - party sources . The Company has not independently verified this information and there can be no assurance that such information is accurate or complete . ( as of December 31, 2022) 4Q - 2022| Earnings Supplemental Reporting Definitions and Other Disclosures 22
Stephen Swett stephen.swett@icrinc.com 203.682.8377 www.globalmedicalreit.com NYSE: GMRE INVESTOR RELATIONS