Exhibit 99.2
FIRST QUARTER 2024 EARNINGS SUPPLEMENTAL www.globalmedicalreit.com NYSE: GMRE Atrium Health – Winston - Salem, NC
Forward - Looking Statements Certain statements contained herein may be considered “forward - looking statements” within the meaning of the Private Securities Litigation Reform Act of 1995 , and it is the Company’s intent that any such statements be protected by the safe harbor created thereby . These forward - looking statements are identified by their use of terms and phrases such as "anticipate," "believe," "could," "estimate," "expect," "intend," "may," "should," "plan," "predict," "project," "will," "continue" and other similar terms and phrases, including references to assumptions and forecasts of future results . Except for historical information, the statements set forth herein including, but not limited to, any statements regarding our earnings, our liquidity, our tenants’ ability to pay rent to us, expected financial performance (including future cash flows associated with new tenants or the expansion of current properties), future dividends or other financial items ; any other statements concerning our plans, strategies, objectives and expectations for future operations and future portfolio occupancy rates, our pipeline of acquisition opportunities and expected acquisition activity, including the timing and/or successful completion of any acquisitions and expected rent receipts on these properties, our expected disposition activity, including the timing and/or successful completion of any dispositions and the expected use of proceeds therefrom, and any statements regarding future economic conditions or performance are forward - looking statements . These forward - looking statements are based on our current expectations, estimates and assumptions and are subject to certain risks and uncertainties . Although the Company believes that the expectations, estimates and assumptions reflected in its forward - looking statements are reasonable, actual results could differ materially from those projected or assumed in any of the Company’s forward - looking statements . Additional information concerning us and our business, including additional factors that could materially and adversely affect our financial results, include, without limitation, the risks described under Part I, Item 1 A - Risk Factors, in our Annual Report on Form 10 - K, our Quarterly Reports on Form 10 - Q, and in our other filings with the SEC . You are cautioned not to place undue reliance on forward - looking statements . The Company does not intend, and undertakes no obligation, to update any forward - looking statement . TABLE OF CONTENTS Company Overview 3 Select Quarterly Financial Data 6 Business Summary 7 Portfolio Summary 8 Key Tenants 11 Debt and Hedging Summary 12 Total Capitalization and Equity Summary 14 ESG Summary 15 Condensed Consolidated Statements of Operations 16 Condensed Consolidated Balance Sheets 17 Condensed Consolidated Statements of Cash Flows 18 Non - GAAP Reconciliations 19 Reporting Definitions and Other Disclosures 20 Legent Hospital for Special Surgery – Plano, TX 1Q - 2024 | Earnings Supplemental 2
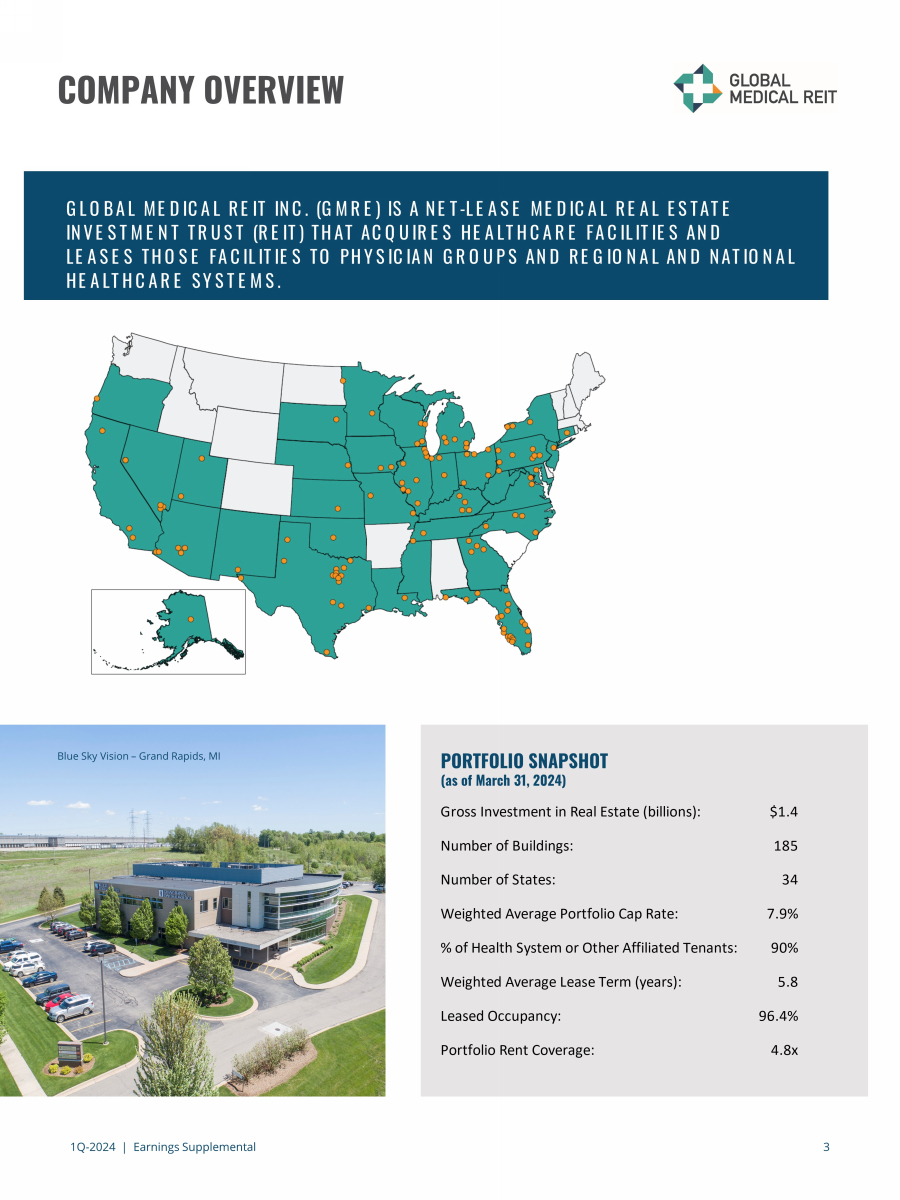
3 1Q - 2024 | Earnings Supplemental COMPANY OVERVIEW GLOBAL MEDICAL REIT INC. (GMRE) IS A NET - LEASE MEDICAL REAL ESTATE INVESTMENT TRUST (REIT) THAT ACQUIRES HEALTHCARE FACILITIES AND LEASES THOSE FACILITIES TO PHYSICIAN GROUPS AND REGIONAL AND NATIONAL HEALTHCARE SYSTEMS. PORTFOLIO SNAPSHOT (as of March 31, 2024) Blue Sky Vision – Grand Rapids, MI Gross Investment in Real Estate (billions): $1.4 Number of Buildings: 185 Number of States: 34 Weighted Average Portfolio Cap Rate: 7.9% % of Health System or Other Affiliated Tenants: 90% Weighted Average Lease Term (years): 5.8 Leased Occupancy: 96.4% Portfolio Rent Coverage: 4.8x
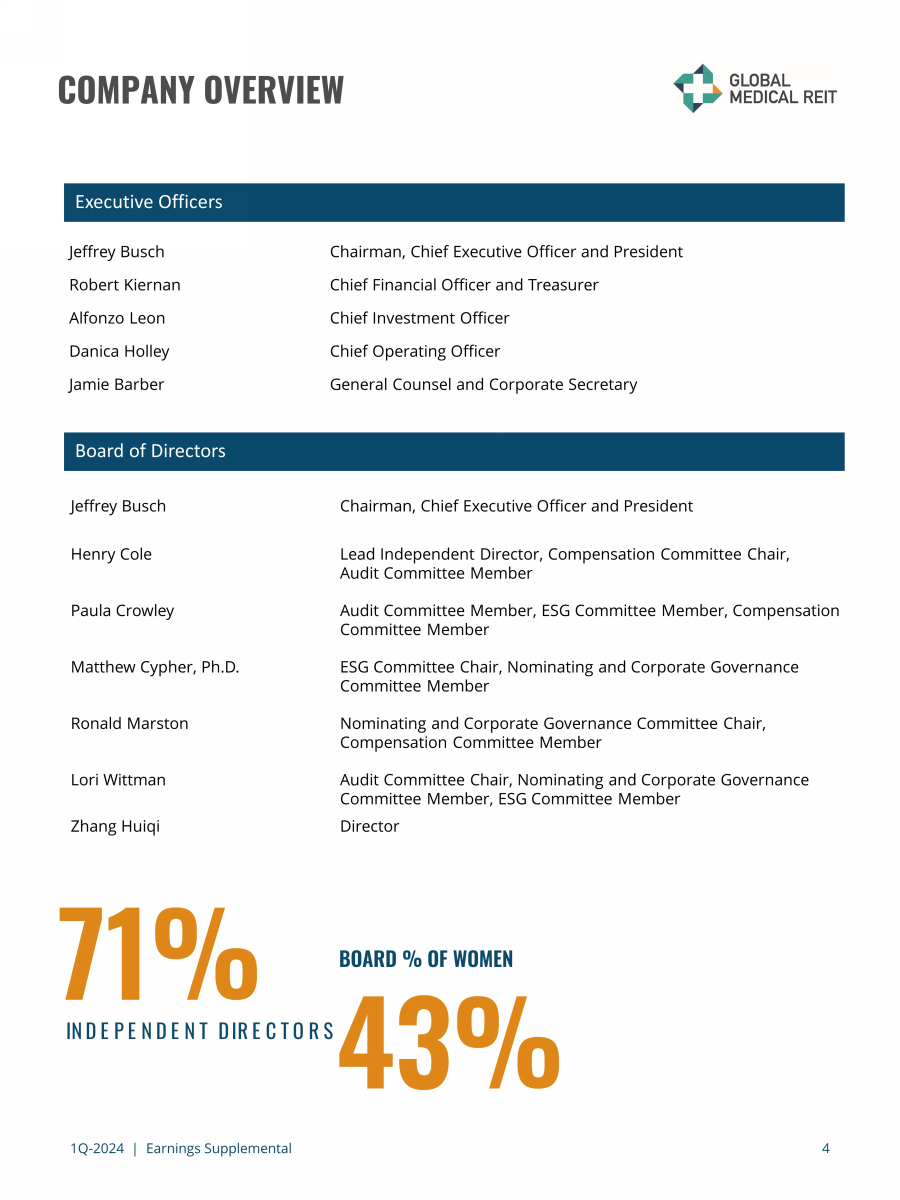
1Q - 2024 | Earnings Supplemental 4 Jeffrey Busch Chairman, Chief Executive Officer and President Robert Kiernan Chief Financial Officer and Treasurer Alfonzo Leon Chief Investment Officer Danica Holley Chief Operating Officer Jamie Barber General Counsel and Corporate Secretary Board of Directors Jeffrey Busch Chairman, Chief Executive Officer and President Henry Cole Lead Independent Director, Compensation Committee Chair, Audit Committee Member Paula Crowley Audit Committee Member, ESG Committee Member, Compensation Committee Member Matthew Cypher, Ph.D. ESG Committee Chair, Nominating and Corporate Governance Committee Member Ronald Marston Nominating and Corporate Governance Committee Chair, Compensation Committee Member Lori Wittman Audit Committee Chair, Nominating and Corporate Governance Committee Member, ESG Committee Member Zhang Huiqi Director INDEPENDENT DIRECTORS 71% BOARD % OF WOMEN COMPANY OVERVIEW 43% Executive Officers
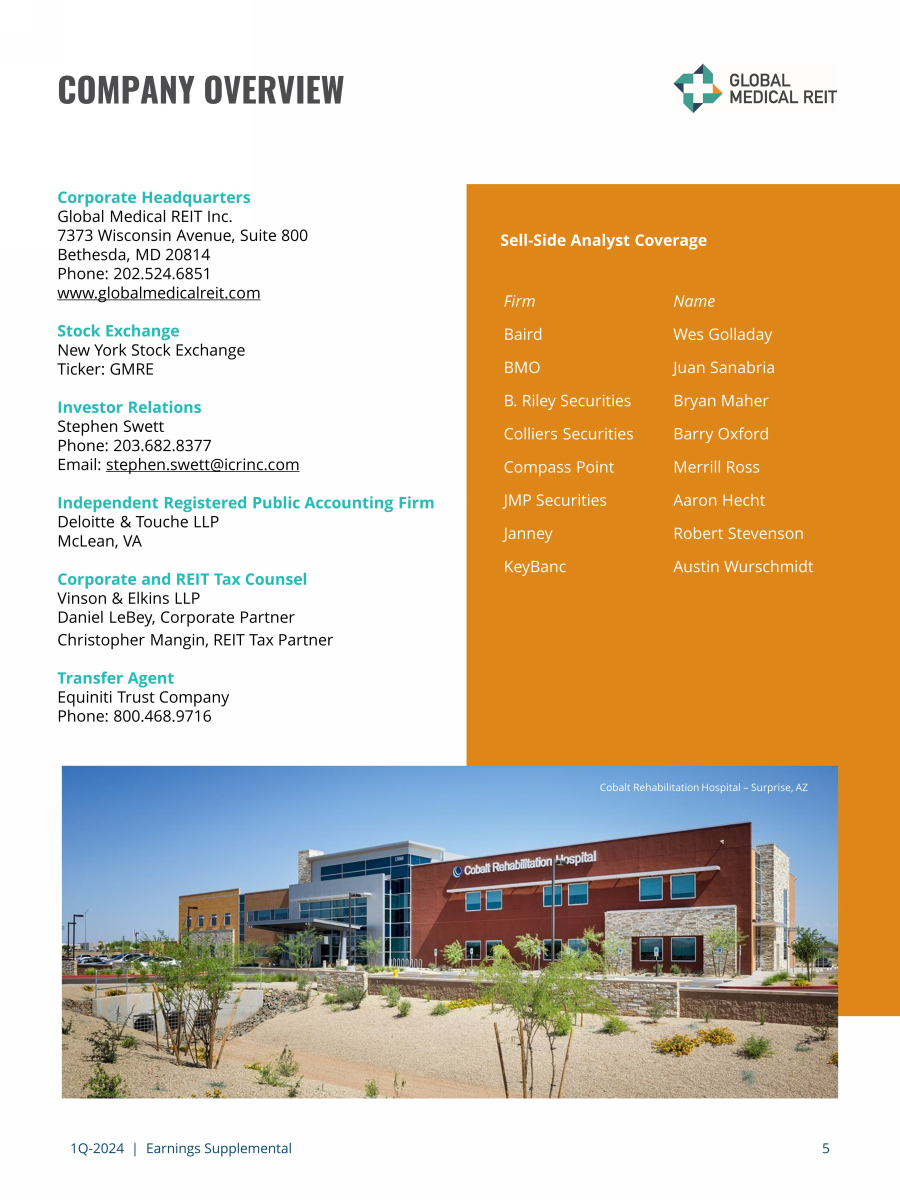
1Q - 2024 | Earnings Supplemental 5 COMPANY OVERVIEW Corporate Headquarters Global Medical REIT Inc. 7373 Wisconsin Avenue, Suite 800 Bethesda, MD 20814 Phone: 202.524.6851 www.globalmedicalreit.com Stock Exchange New York Stock Exchange Ticker: GMRE Investor Relations Stephen Swett Phone: 203.682.8377 Email: stephen.swett@icrinc.com Independent Registered Public Accounting Firm Deloitte & Touche LLP McLean, VA Corporate and REIT Tax Counsel Vinson & Elkins LLP Daniel LeBey , Corporate Partner Christopher Mangin , REIT Tax Partner Transfer Agent Equiniti Trust Company Phone: 800.468.9716 Cobalt Rehabilitation Hospital – Surprise, AZ Firm Name Baird Wes Golladay BMO Juan Sanabria B. Riley Securities Bryan Maher Colliers Securities Barry Oxford Compass Point Merrill Ross JMP Securities Aaron Hecht Janney Robert Stevenson KeyBanc Austin Wurschmidt Sell - Side Analyst Coverage
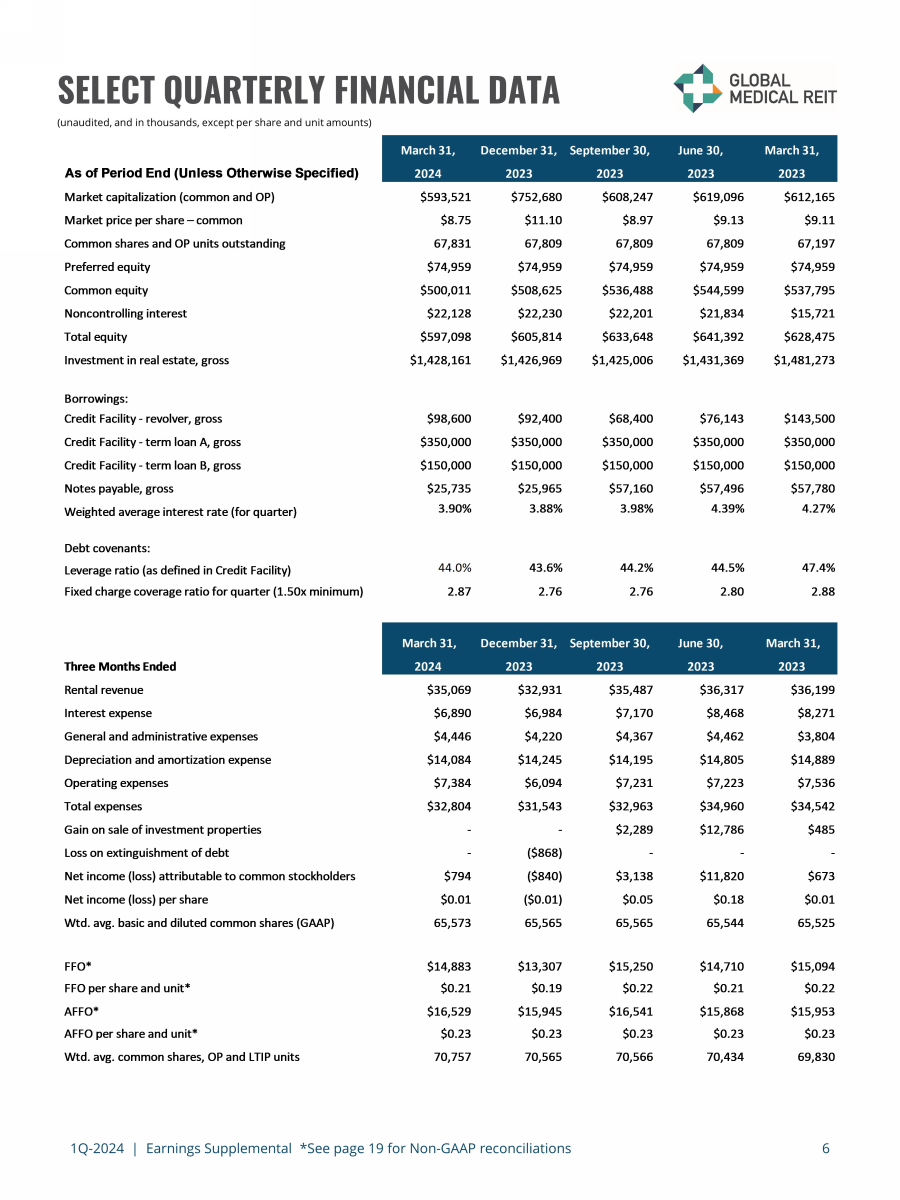
1Q - 2024 | Earnings Supplemental *See page 19 for Non - GAAP reconciliations 6 (unaudited, and in thousands, except per share and unit amounts) SELECT QUARTERLY FINANCIAL DATA March 31, December 31, September 30, June 30, March 31, As of Period End (Unless Otherwise Specified) 2024 2023 2023 2023 2023 Market capitalization (common and OP) $593,521 $752,680 $608,247 $619,096 $612,165 Market price per share – common $8.75 $11.10 $8.97 $9.13 $9.11 Common shares and OP units outstanding 67,831 67,809 67,809 67,809 67,197 Preferred equity $74,959 $74,959 $74,959 $74,959 $74,959 Common equity $500,011 $508,625 $536,488 $544,599 $537,795 Noncontrolling interest $22,128 $22,230 $22,201 $21,834 $15,721 Total equity $597,098 $605,814 $633,648 $641,392 $628,475 Investment in real estate, gross $1,428,161 $1,426,969 $1,425,006 $1,431,369 $1,481,273 Borrowings: Credit Facility - revolver, gross $98,600 $92,400 $68,400 $76,143 $143,500 Credit Facility - term loan A, gross $350,000 $350,000 $350,000 $350,000 $350,000 Credit Facility - term loan B, gross $150,000 $150,000 $150,000 $150,000 $150,000 Notes payable, gross $25,735 $25,965 $57,160 $57,496 $57,780 Weighted average interest rate (for quarter) 3.90% 3.88% 3.98% 4.39% 4.27% Debt covenants: Leverage ratio (as defined in Credit Facility) 44.0% 43.6% 44.2% 44.5% 47.4% Fixed charge coverage ratio for quarter (1.50x minimum) 2.87 2.76 2.76 2.80 2.88 March 31, December 31, September 30, June 30, March 31, Three Months Ended 2024 2023 2023 2023 2023 Rental revenue $35,069 $32,931 $35,487 $36,317 $36,199 Interest expense $6,890 $6,984 $7,170 $8,468 $8,271 General and administrative expenses $4,446 $4,220 $4,367 $4,462 $3,804 Depreciation and amortization expense $14,084 $14,245 $14,195 $14,805 $14,889 Operating expenses $7,384 $6,094 $7,231 $7,223 $7,536 Total expenses $32,804 $31,543 $32,963 $34,960 $34,542 Gain on sale of investment properties - - $2,289 $12,786 $485 Loss on extinguishment of debt - ($868) - - - Net income (loss) attributable to common stockholders $794 ($840) $3,138 $11,820 $673 Net income (loss) per share $0.01 ($0.01) $0.05 $0.18 $0.01 Wtd. avg. basic and diluted common shares (GAAP) 65,573 65,565 65,565 65,544 65,525 FFO* $14,883 $13,307 $15,250 $14,710 $15,094 FFO per share and unit* $0.21 $0.19 $0.22 $0.21 $0.22 AFFO* $16,529 $15,945 $16,541 $15,868 $15,953 AFFO per share and unit* $0.23 $0.23 $0.23 $0.23 $0.23 Wtd. avg. common shares, OP and LTIP units 70,757 70,565 70,566 70,434 69,830
1Q - 2024 | Earnings Supplemental 7 BUSINESS SUMMARY FIRST QUARTER 2024 OPERATING SUMMARY • Net income attributable to common stockholders was $0.8 million, or $0.01 per diluted share, as compared to $0.7 million, or $0.01 per diluted share, in the comparable prior year period. • Funds from Operations (“FFO”) of $14.9 million, or $0.21 per share and unit, as compared to $15.1 million, or $0.22 per share and unit, in the comparable prior year period. • Adjusted Funds from Operations (“AFFO”) of $16.5 million, or $0.23 per share and unit, as compared to $16.0 million, or $0.23 per share and unit, in the comparable prior year period. • Total revenue decreased to $35.1 million as compared to $36.2 million in the comparable prior year period, primarily reflecting the impact of the Company’s property dispositions that were completed during 2023. COMMON AND PREFERRED DIVIDENDS • On March 7, 2024, the Board of Directors (the “Board”) declared a: • $0.21 per share cash dividend to common stockholders and unitholders of record as of March 22, 2024, which was paid on April 9, 2024; and • $0.46875 per share cash dividend to holders of record as of April 15, 2024, of the Company’s Series A Preferred Stock, which was paid on April 30, 2024. INVESTMENT AND PORTFOLIO ACTIVITY • In May, the Company entered into a purchase agreement to acquire a 15 - property portfolio of outpatient medical real estate for an aggregate purchase price of $81.3 million. The properties are fully occupied and leased under triple - net or absolute triple - net leases. The Company expects to close this transaction in two tranches, with the first tranche (approximately $30 million - $35 million) closing during the third quarter of 2024 and the remainder closing during the fourth quarter of 2024. The Company’s obligation to close the acquisition is subject to certain customary terms and conditions, including due diligence reviews. Accordingly, there is no assurance that the Company will close this acquisition on a timely basis, or at all. • On May 6, 2024, one of the Company’s tenants, Steward Health Care (“Steward”), announced that it filed for Chapter 11 bankruptcy reorganization. As of March 31, 2024, Steward represented 2.8% of the Company’s annualized base rent, primarily in one facility located in Beaumont, Texas. Steward was current in its rental payments through February 2024 and as of March 31, 2024, the Company’s receivable balance from Steward was $0.5 million, including $0.2 million of deferred rent. • During the first quarter of 2024, the Company did not complete any acquisitions or dispositions. • As of March 31, 2024, the Company’s portfolio occupancy was 96.4%. CAPITAL MARKETS AND DEBT ACTIVITY • Leverage was 44.0 % as of March 31, 2024. • As of May 6, 2024, we had unutilized borrowing capacity under the Credit Facility of $290 million. • The Company did not issue any shares of common stock under its ATM program during the first quarter of 2024 or from April 1, 2024 through May 6, 2024.
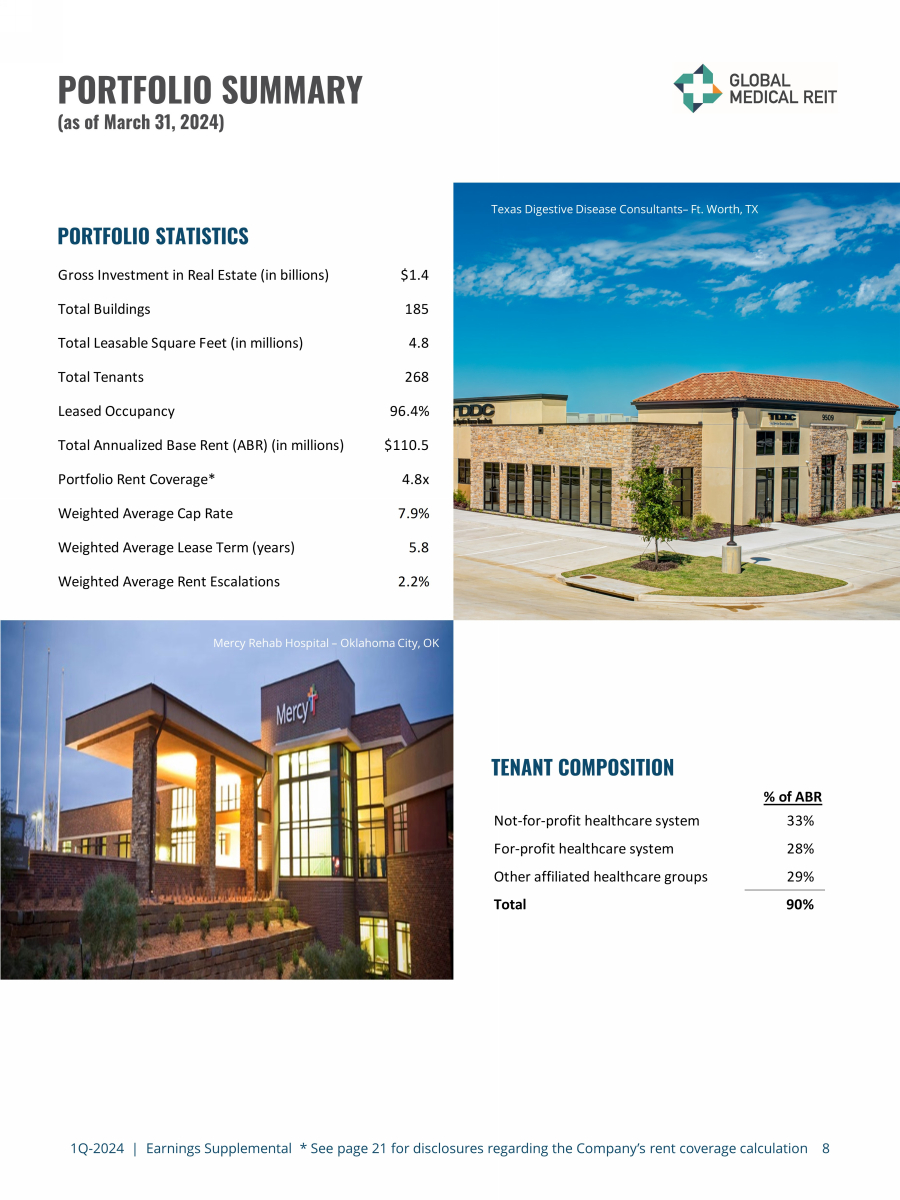
1Q - 2024 | Earnings Supplemental * See page 21 for disclosures regarding the Company’s rent coverage calculation 8 PORTFOLIO SUMMARY (as of March 31, 2024) PORTFOLIO STATISTICS TENANT COMPOSITION Texas Digestive Disease Consultants – Ft. Worth, TX Indiana Eye Clinic – Greenwood, IN Mercy Rehab Hospital – Oklahoma City, OK Gross Investment in Real Estate (in billions) $1.4 Total Buildings 185 Total Leasable Square Feet (in millions) 4.8 Total Tenants 268 Leased Occupancy 96.4% Total Annualized Base Rent (ABR) (in millions) $110.5 Portfolio Rent Coverage* 4.8x Weighted Average Cap Rate 7.9% Weighted Average Lease Term (years) 5.8 Weighted Average Rent Escalations 2.2% % of ABR Not-for-profit healthcare system 33% For-profit healthcare system 28% Other affiliated healthcare groups 29% Total 90%
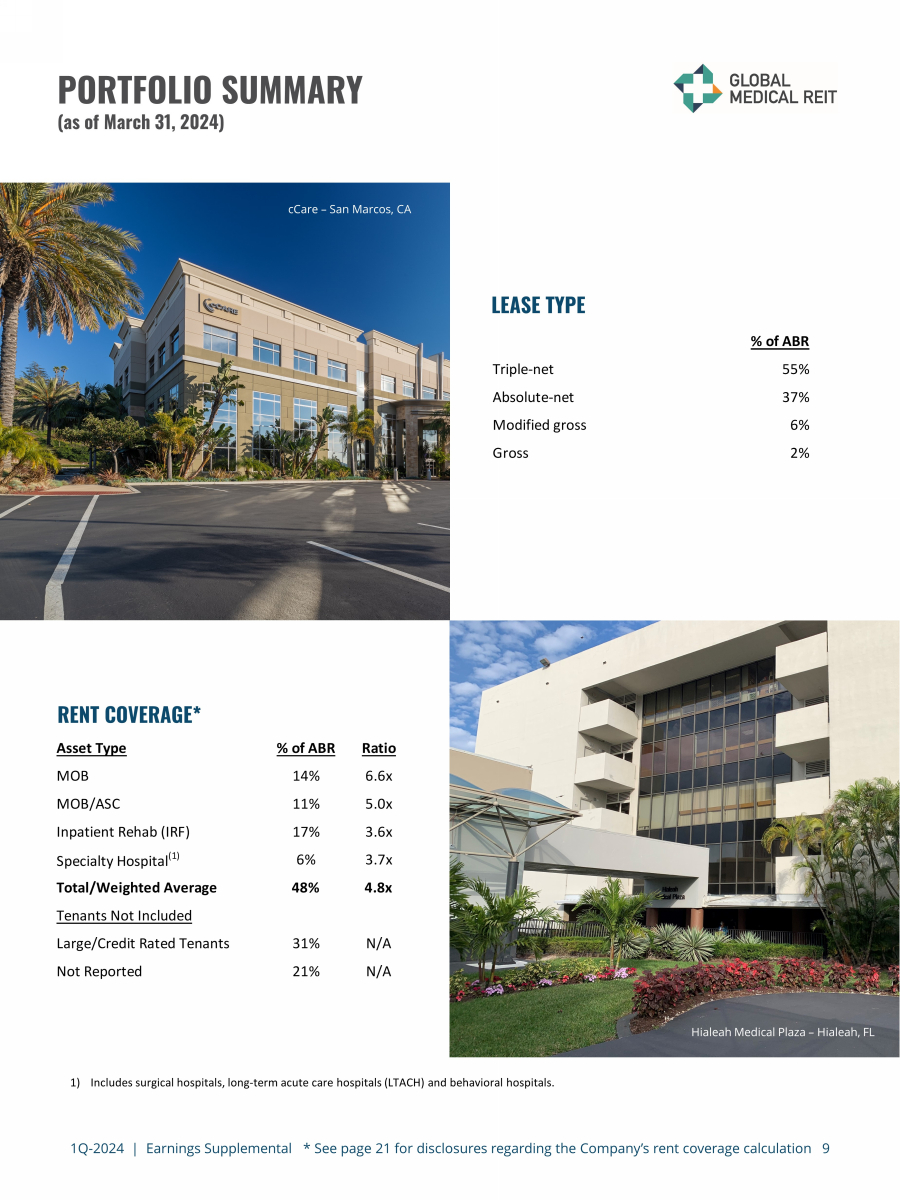
1Q - 2024 | Earnings Supplemental * See page 21 for disclosures regarding the Company’s rent coverage calculation 9 PORTFOLIO SUMMARY (as of March 31, 2024) LEASE TYPE RENT COVERAGE* 1) Includes surgical hospitals, long - term acute care hospitals (LTACH) and behavioral hospitals. cCare – San Marcos, CA Hialeah Medical Plaza – Hialeah, FL % of ABR Triple-net 55% Absolute-net 37% Modified gross 6% Gross 2% Asset Type % of ABR Ratio MOB 14% 6.6x MOB/ASC 11% 5.0x Inpatient Rehab (IRF) 17% 3.6x Specialty Hospital (1) 6% 3.7x Total/Weighted Average 48% 4.8x Tenants Not Included Large/Credit Rated Tenants 31% N/A Not Reported 21% N/A
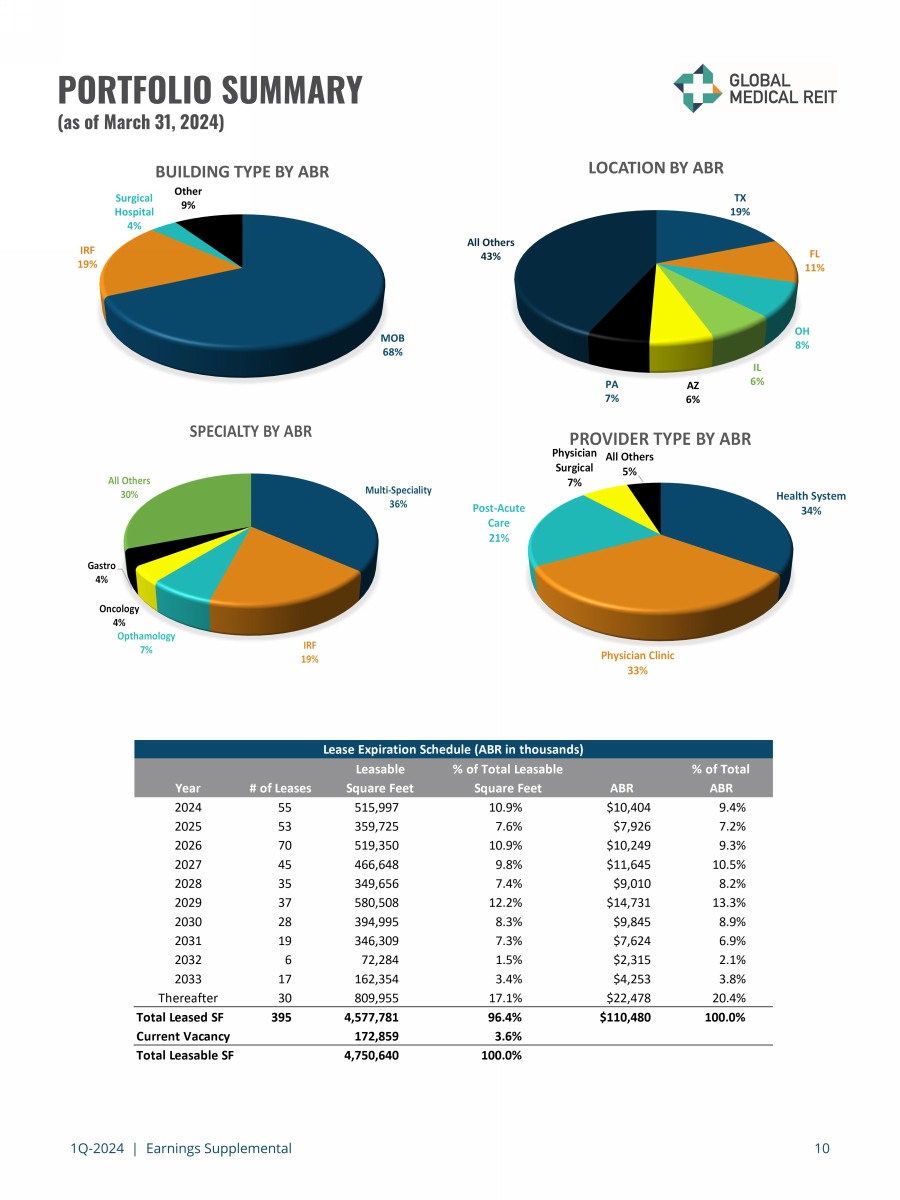
1Q - 2024 | Earnings Supplemental 10 PORTFOLIO SUMMARY (as of March 31, 2024) Mercy Rehab Hospital – Oklahoma City, OK Multi - Speciality 36% IRF 19% Opthamology 7% Oncology 4% Gastro 4% All Others 30% SPECIALTY BY ABR Health System 34% Physician Clinic 33% Post - Acute Care 21% Physician Surgical 7% All Others 5% PROVIDER TYPE BY ABR TX 19% FL 11% OH 8% PA 7% AZ 6% IL 6% All Others 43% LOCATION BY ABR MOB 68% IRF 19% Surgical Hospital 4% Other 9% BUILDING TYPE BY ABR Leasable % of Total Leasable % of Total Year # of Leases Square Feet Square Feet ABR ABR 2024 55 515,997 10.9% $10,404 9.4% 2025 53 359,725 7.6% $7,926 7.2% 2026 70 519,350 10.9% $10,249 9.3% 2027 45 466,648 9.8% $11,645 10.5% 2028 35 349,656 7.4% $9,010 8.2% 2029 37 580,508 12.2% $14,731 13.3% 2030 28 394,995 8.3% $9,845 8.9% 2031 19 346,309 7.3% $7,624 6.9% 2032 6 72,284 1.5% $2,315 2.1% 2033 17 162,354 3.4% $4,253 3.8% Thereafter 30 809,955 17.1% $22,478 20.4% Total Leased SF 395 4,577,781 96.4% $110,480 100.0% Current Vacancy 172,859 3.6% Total Leasable SF 4,750,640 100.0% Lease Expiration Schedule (ABR in thousands)
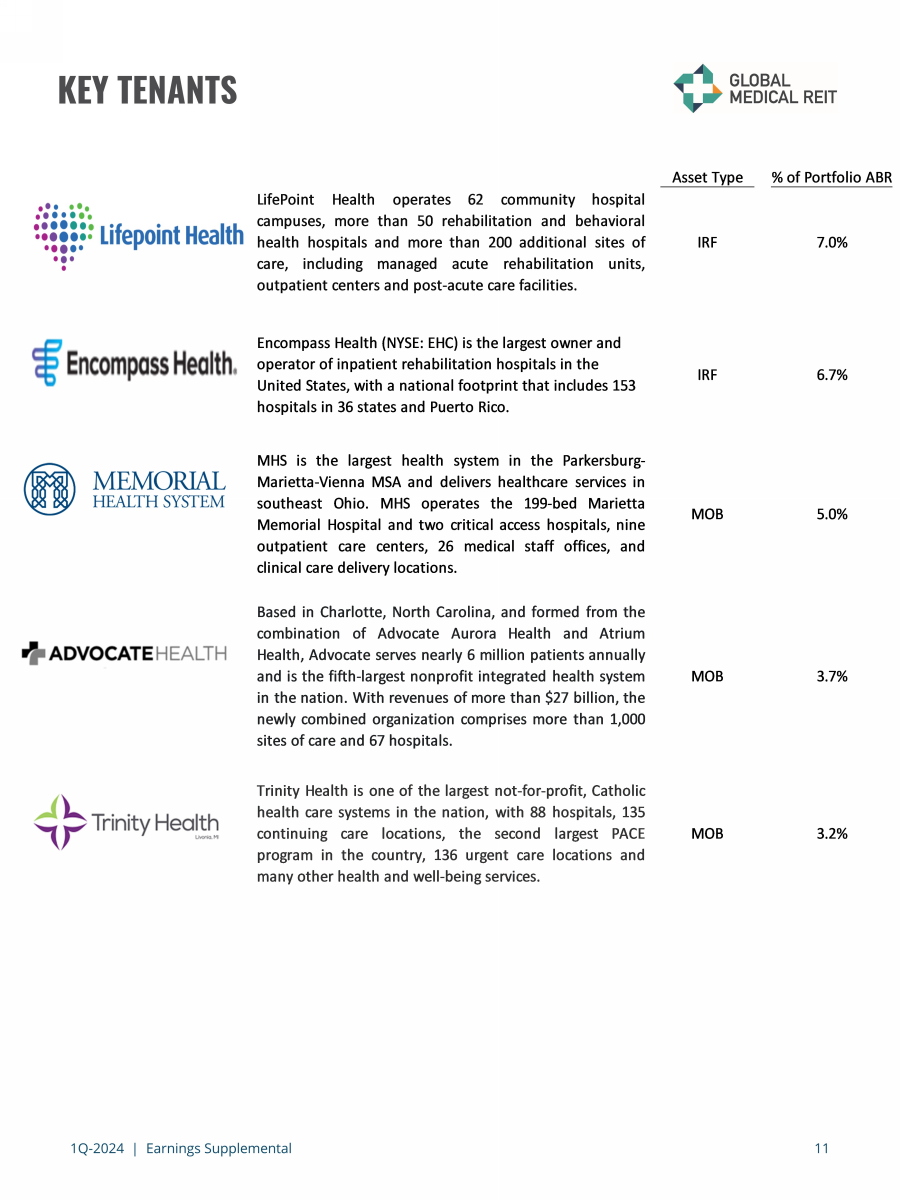
1Q - 2024 | Earnings Supplemental 11 KEY TENANTS Asset Type % of Portfolio ABR LifePoint Health operates 62 community hospital campuses, more than 50 rehabilitation and behavioral healthhospitalsandmorethan200additionalsitesof care, including managed acute rehabilitation units, outpatient centers and post-acute care facilities. IRF 7.0% Encompass Health (NYSE: EHC) is the largest owner and operator of inpatient rehabilitation hospitals in the United States, with a national footprint that includes 153 hospitals in 36 states and Puerto Rico. IRF 6.7% MHS is the largest health system in the Parkersburg- Marietta-ViennaMSAanddelivershealthcareservicesin southeast Ohio. MHS operates the 199-bed Marietta MemorialHospitalandtwocriticalaccesshospitals,nine outpatient care centers, 26 medical staff offices, and clinical care delivery locations. MOB 5.0% BasedinCharlotte,NorthCarolina,andformedfromthe combination of Advocate Aurora Health and Atrium Health,Advocateservesnearly6millionpatientsannually andisthefifth-largestnonprofitintegratedhealthsystem inthenation.Withrevenuesofmorethan$27billion,the newlycombinedorganizationcomprisesmorethan1,000 sites of care and 67 hospitals. MOB 3.7% TrinityHealthisoneofthelargestnot-for-profit,Catholic healthcaresystemsinthenation,with88hospitals,135 continuing care locations, the second largest PACE programinthecountry,136urgentcarelocationsand many other health and well-being services. MOB 3.2%
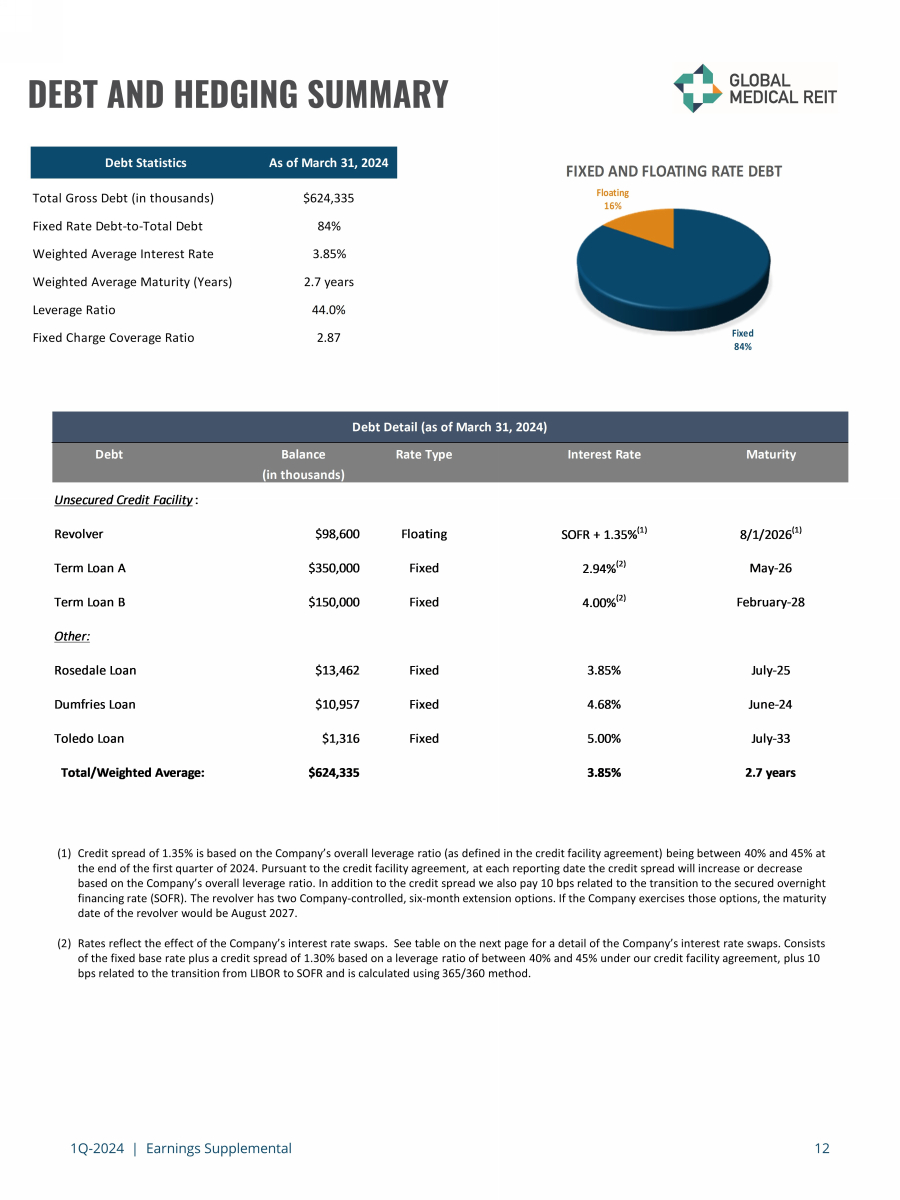
1Q - 2024 | Earnings Supplemental 12 DEBT AND HEDGING SUMMARY (1) Credit spread of 1.35% is based on the Company’s overall leverage ratio (as defined in the credit facility agreement) being b etw een 40% and 45% at the end of the first quarter of 2024. Pursuant to the credit facility agreement, at each reporting date the credit spread wil l i ncrease or decrease based on the Company’s overall leverage ratio. In addition to the credit spread we also pay 10 bps related to the transition to the secured overnight financing rate (SOFR). The revolver has two Company - controlled, six - month extension options. If the Company exercises those opti ons, the maturity date of the revolver would be August 2027. (2) Rates reflect the effect of the Company’s interest rate swaps. See table on the next page for a detail of the Company’s inte res t rate swaps. Consists of the fixed base rate plus a credit spread of 1.30% based on a leverage ratio of between 40% and 45 % under our credit facility agreement, plus 10 bps related to the transition from LIBOR to SOFR and is calculated using 365/360 method. Fixed 84% Floating 16% FIXED AND FLOATING RATE DEBT Debt Balance Rate Type Interest Rate Maturity (in thousands) Unsecured Credit Facility: Revolver $98,600 Floating SOFR + 1.35% (1) 8/1/2026 (1) Term Loan A $350,000 Fixed 2.94% (2) May-26 Term Loan B $150,000 Fixed 4.00% (2) February-28 Other: Rosedale Loan $13,462 Fixed 3.85% July-25 Dumfries Loan $10,957 Fixed 4.68% June-24 Toledo Loan $1,316 Fixed 5.00% July-33 Total/Weighted Average: $624,335 3.85% 2.7 years Debt Detail (as of March 31, 2024) Debt Statistics As of March 31, 2024 Total Gross Debt (in thousands) $624,335 Fixed Rate Debt-to-Total Debt 84% Weighted Average Interest Rate 3.85% Weighted Average Maturity (Years) 2.7 years Leverage Ratio 44.0% Fixed Charge Coverage Ratio 2.87
1Q - 2024 | Earnings Supplemental 13 DEBT AND HEDGING SUMMARY (1) Consists of a total of ten current interest rates swaps and three forward starting interest rate swaps whereby we pay (or wil l p ay) the fixed base rate listed in the table above and receive the one - month SOFR, which is the reference rate for the outstanding loans in our credit fa cility. (2) Consists of the fixed base rate plus a credit spread of 1.30% based on a leverage ratio of between 40% and 45% under our cred it facility agreement, plus 10 bps related to the transition from LIBOR to SOFR and is calculated using 365/360 method. Citrus Valley Medical Associates – Corona, CA Notional Term Term Loan A - $350,000 Current – 8/2024 Fixed base rate: 1.50% Effective interest rate: 2.94% (2) 8/2024 – 4/2026 Fixed base rate: 1.36% Effective interest rate: 2.80% (2) Term Loan B - $150,000 Current – 2/2028 Fixed base rate: 2.54% Effective interest rate: 4.00% (2) Interest Rate Swap Detail (as of March 31, 2024) (1) Weighted Average Interest Rates
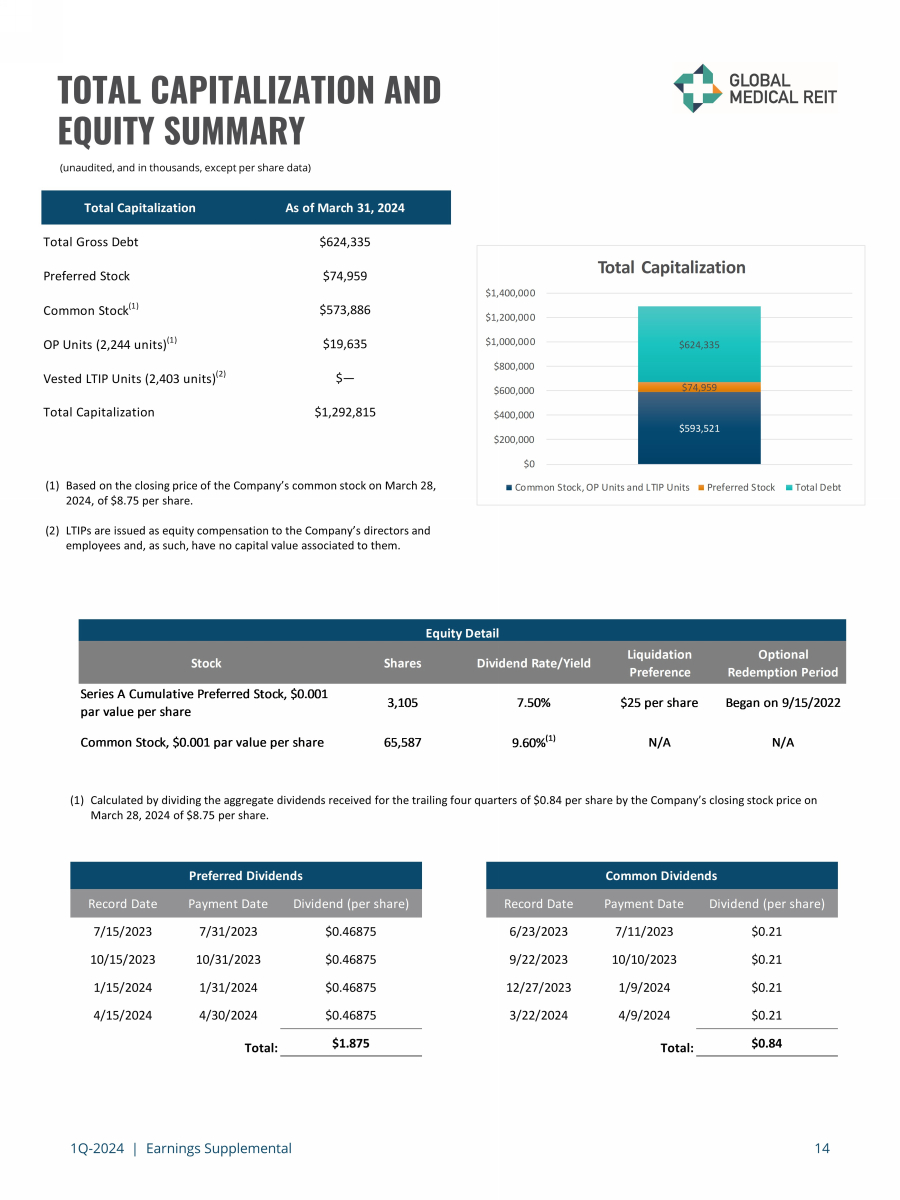
1Q - 2024 | Earnings Supplemental 14 TOTAL CAPITALIZATION AND EQUITY SUMMARY (unaudited, and in thousands, except per share data) (1) Based on the closing price of the Company’s common stock on March 28, 2024, of $8.75 per share. (2) LTIPs are issued as equity compensation to the Company’s directors and employees and, as such, have no capital value associated to them. (1) Calculated by dividing the aggregate dividends received for the trailing four quarters of $0.84 per share by the Company’s cl osi ng stock price on March 28, 2024 of $8.75 per share. $593,521 $74,959 $624,335 $0 $200,000 $400,000 $600,000 $800,000 $1,000,000 $1,200,000 $1,400,000 Total Capitalization Common Stock, OP Units and LTIP Units Preferred Stock Total Debt Stock Shares Dividend Rate/Yield Liquidation Preference Optional Redemption Period Series A Cumulative Preferred Stock, $0.001 par value per share 3,105 7.50% $25 per share Began on 9/15/2022 Common Stock, $0.001 par value per share 65,587 9.60% (1) N/A N/A Equity Detail Record Date Payment Date Dividend (per share) 6/23/2023 7/11/2023 $0.21 9/22/2023 10/10/2023 $0.21 12/27/2023 1/9/2024 $0.21 3/22/2024 4/9/2024 $0.21 Total: $0.84 Common Dividends Total Capitalization As of March 31, 2024 Total Gross Debt $624,335 Preferred Stock $74,959 Common Stock (1) $573,886 OP Units (2,244 units) (1) $19,635 Vested LTIP Units (2,403 units) (2) $— Total Capitalization $1,292,815 Record Date Payment Date Dividend (per share) 7/15/2023 7/31/2023 $0.46875 10/15/2023 10/31/2023 $0.46875 1/15/2024 1/31/2024 $0.46875 4/15/2024 4/30/2024 $0.46875 Total: $1.875 Preferred Dividends
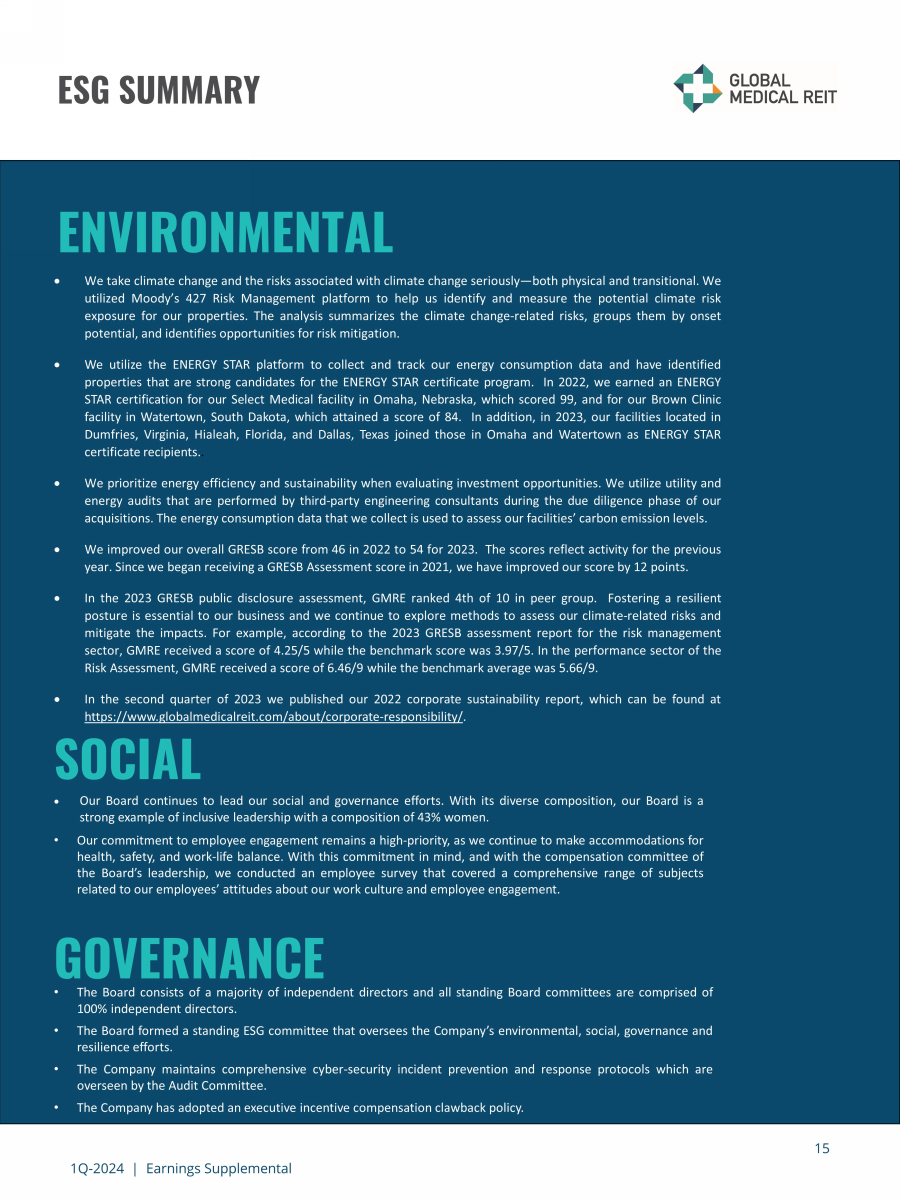
1Q - 2024 | Earnings Supplemental 15 ESG SUMMARY We take climate change and the risks associated with climate change seriously — both physical and transitional . We utilized Moody’s 427 Risk Management platform to help us identify and measure the potential climate risk exposure for our properties . The analysis summarizes the climate change - related risks, groups them by onset potential, and identifies opportunities for risk mitigation . We utilize the ENERGY STAR platform to collect and track our energy consumption data and have identified properties that are strong candidates for the ENERGY STAR certificate program . In 2022 , we earned an ENERGY STAR certification for our Select Medical facility in Omaha, Nebraska, which scored 99 , and for our Brown Clinic facility in Watertown, South Dakota, which attained a score of 84 . In addition, in 2023 , our facilities located in Dumfries, Virginia, Hialeah, Florida, and Dallas, Texas joined those in Omaha and Watertown as ENERGY STAR certificate recipients . . We prioritize energy efficiency and sustainability when evaluating investment opportunities . We utilize utility and energy audits that are performed by third - party engineering consultants during the due diligence phase of our acquisitions . The energy consumption data that we collect is used to assess our facilities’ carbon emission levels . We improved our overall GRESB score from 46 in 2022 to 54 for 2023 . The scores reflect activity for the previous year . Since we began receiving a GRESB Assessment score in 2021 , we have improved our score by 12 points . In the 2023 GRESB public disclosure assessment, GMRE ranked 4 th of 10 in peer group . Fostering a resilient posture is essential to our business and we continue to explore methods to assess our climate - related risks and mitigate the impacts . For example, according to the 2023 GRESB assessment report for the risk management sector, GMRE received a score of 4 . 25 / 5 while the benchmark score was 3 . 97 / 5 . In the performance sector of the Risk Assessment, GMRE received a score of 6 . 46 / 9 while the benchmark average was 5 . 66 / 9 . In the second quarter of 2023 we published our 2022 corporate sustainability report, which can be found at https : //www . globalmedicalreit . com/about/corporate - responsibility/ . ENVIRONMENTAL SOCIAL Our Board continues to lead our social and governance efforts . With its diverse composition, our Board is a strong example of inclusive leadership with a composition of 43 % women . • Our commitment to employee engagement remains a high - priority, as we continue to make accommodations for health, safety, and work - life balance . With this commitment in mind, and with the compensation committee of the Board’s leadership, we conducted an employee survey that covered a comprehensive range of subjects related to our employees’ attitudes about our work culture and employee engagement . GOVERNANCE • The Board consists of a majority of independent directors and all standing Board committees are comprised of 100 % independent directors . • The Board formed a standing ESG committee that oversees the Company’s environmental, social, governance and resilience efforts . • The Company maintains comprehensive cyber - security incident prevention and response protocols which are overseen by the Audit Committee . • The Company has adopted an executive incentive compensation clawback policy . • GMRE is a member of the National Association of Corporate Directors .
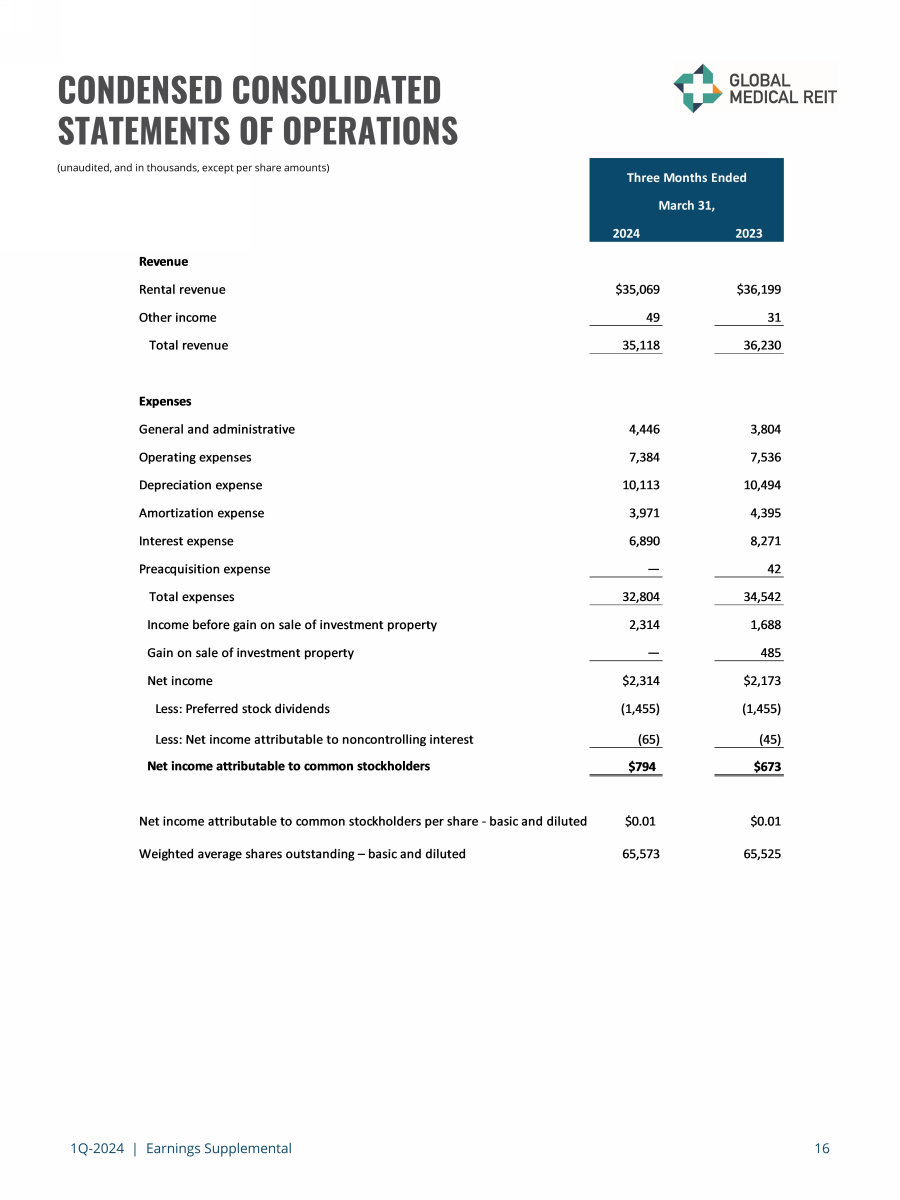
1Q - 2024 | Earnings Supplemental 16 CONDENSED CONSOLIDATED STATEMENTS OF OPERATIONS (unaudited, and in thousands, except per share amounts) 2024 2023 Revenue Rental revenue $35,069 $36,199 Other income 49 31 Total revenue 35,118 36,230 Expenses General and administrative 4,446 3,804 Operating expenses 7,384 7,536 Depreciation expense 10,113 10,494 Amortization expense 3,971 4,395 Interest expense 6,890 8,271 Preacquisition expense — 42 Total expenses 32,804 34,542 Income before gain on sale of investment property 2,314 1,688 Gain on sale of investment property — 485 Net income $2,314 $2,173 Less: Preferred stock dividends (1,455) (1,455) Less: Net income attributable to noncontrolling interest (65) (45) Net income attributable to common stockholders $794 $673 Net income attributable to common stockholders per share - basic and diluted $0.01 $0.01 Weighted average shares outstanding – basic and diluted 65,573 65,525 Three Months Ended March 31,
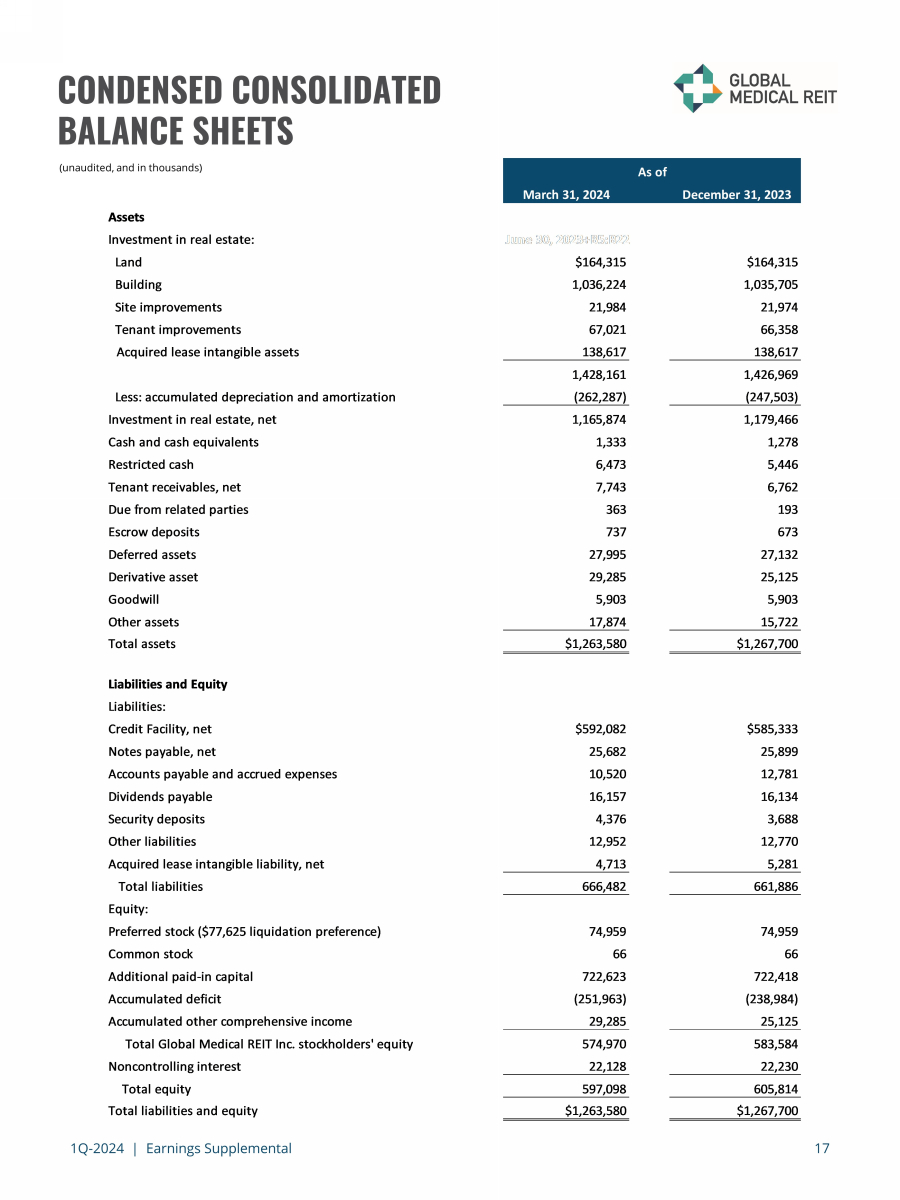
1Q - 2024 | Earnings Supplemental 17 CONDENSED CONSOLIDATED BALANCE SHEETS (unaudited, and in thousands) March 31, 2024 December 31, 2023 Assets Investment in real estate: June 30, 2023+B5:B22 Land $164,315 $164,315 Building 1,036,224 1,035,705 Site improvements 21,984 21,974 Tenant improvements 67,021 66,358 Acquired lease intangible assets 138,617 138,617 1,428,161 1,426,969 Less: accumulated depreciation and amortization (262,287) (247,503) Investment in real estate, net 1,165,874 1,179,466 Cash and cash equivalents 1,333 1,278 Restricted cash 6,473 5,446 Tenant receivables, net 7,743 6,762 Due from related parties 363 193 Escrow deposits 737 673 Deferred assets 27,995 27,132 Derivative asset 29,285 25,125 Goodwill 5,903 5,903 Other assets 17,874 15,722 Total assets $1,263,580 $1,267,700 Liabilities and Equity Liabilities: Credit Facility, net $592,082 $585,333 Notes payable, net 25,682 25,899 Accounts payable and accrued expenses 10,520 12,781 Dividends payable 16,157 16,134 Security deposits 4,376 3,688 Other liabilities 12,952 12,770 Acquired lease intangible liability, net 4,713 5,281 Total liabilities 666,482 661,886 Equity: Preferred stock ($77,625 liquidation preference) 74,959 74,959 Common stock 66 66 Additional paid-in capital 722,623 722,418 Accumulated deficit (251,963) (238,984) Accumulated other comprehensive income 29,285 25,125 Total Global Medical REIT Inc. stockholders' equity 574,970 583,584 Noncontrolling interest 22,128 22,230 Total equity 597,098 605,814 Total liabilities and equity $1,263,580 $1,267,700 As of
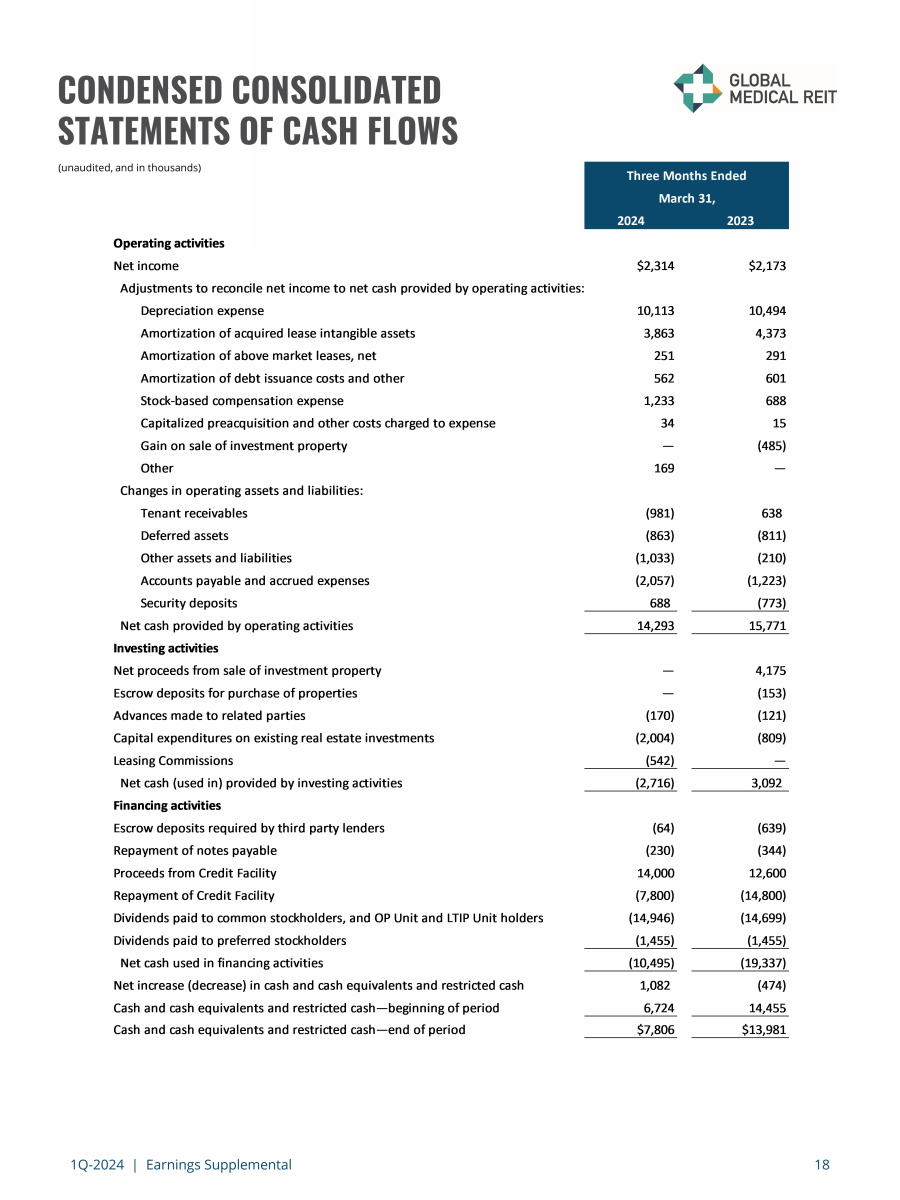
1Q - 2024 | Earnings Supplemental 18 CONDENSED CONSOLIDATED STATEMENTS OF CASH FLOWS (unaudited, and in thousands) 2024 2023 Operating activities Net income $2,314 $2,173 Adjustments to reconcile net income to net cash provided by operating activities: Depreciation expense 10,113 10,494 Amortization of acquired lease intangible assets 3,863 4,373 Amortization of above market leases, net 251 291 Amortization of debt issuance costs and other 562 601 Stock-based compensation expense 1,233 688 Capitalized preacquisition and other costs charged to expense 34 15 Gain on sale of investment property — (485) Other 169 — Changes in operating assets and liabilities: Tenant receivables (981) 638 Deferred assets (863) (811) Other assets and liabilities (1,033) (210) Accounts payable and accrued expenses (2,057) (1,223) Security deposits 688 (773) Net cash provided by operating activities 14,293 15,771 Investing activities Net proceeds from sale of investment property — 4,175 Escrow deposits for purchase of properties — (153) Advances made to related parties (170) (121) Capital expenditures on existing real estate investments (2,004) (809) Leasing Commissions (542) — Net cash (used in) provided by investing activities (2,716) 3,092 Financing activities Escrow deposits required by third party lenders (64) (639) Repayment of notes payable (230) (344) Proceeds from Credit Facility 14,000 12,600 Repayment of Credit Facility (7,800) (14,800) Dividends paid to common stockholders, and OP Unit and LTIP Unit holders (14,946) (14,699) Dividends paid to preferred stockholders (1,455) (1,455) Net cash used in financing activities (10,495) (19,337) Net increase (decrease) in cash and cash equivalents and restricted cash 1,082 (474) Cash and cash equivalents and restricted cash—beginning of period 6,724 14,455 Cash and cash equivalents and restricted cash—end of period $7,806 $13,981 Three Months Ended March 31,
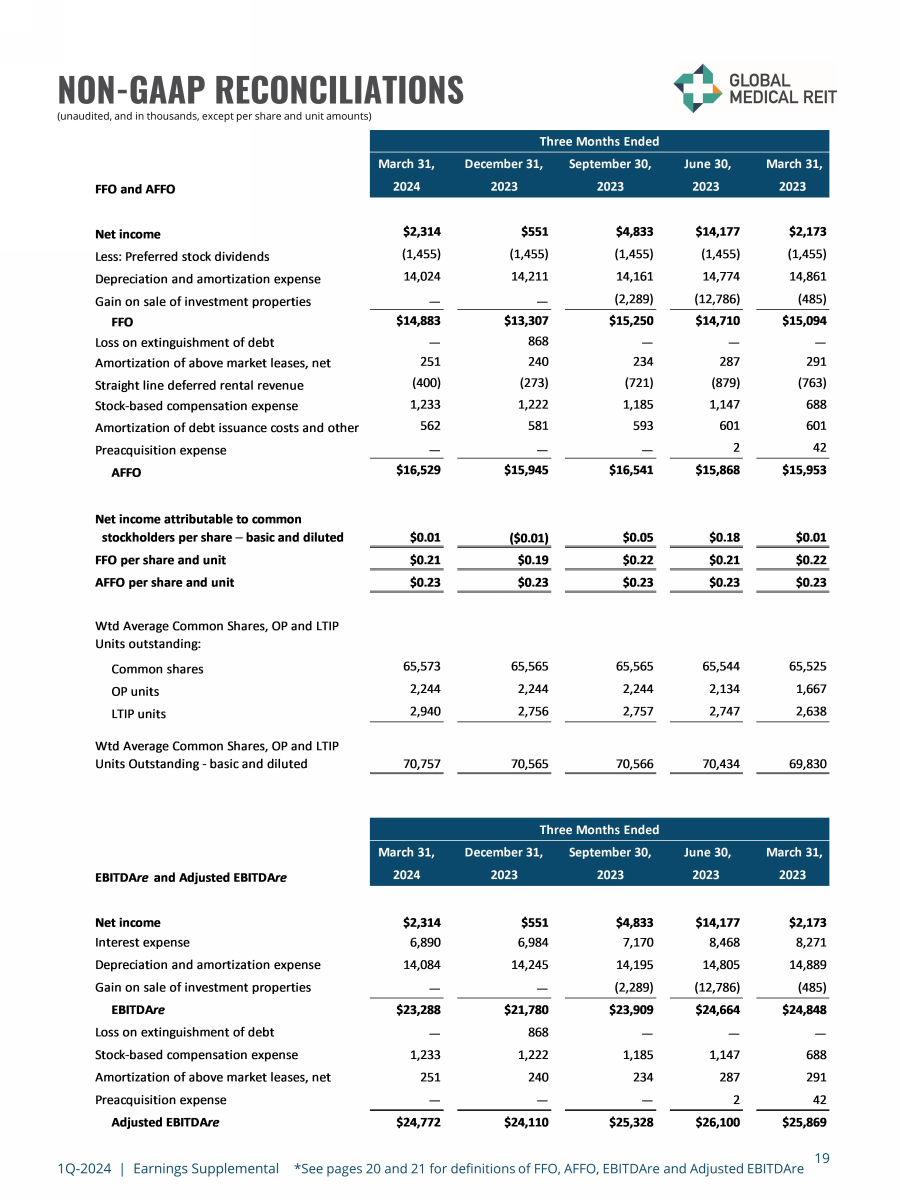
1Q - 2024 | Earnings Supplemental *See pages 20 and 21 for definitions of FFO, AFFO, EBITDAre and Adjusted EBITDAre 19 NON - GAAP RECONCILIATIONS (unaudited, and in thousands, except per share and unit amounts) March 31, December 31, September 30, June 30, March 31, FFO and AFFO 2024 2023 2023 2023 2023 Net income $2,314 $551 $4,833 $14,177 $2,173 Less: Preferred stock dividends (1,455) (1,455) (1,455) (1,455) (1,455) Depreciation and amortization expense 14,024 14,211 14,161 14,774 14,861 Gain on sale of investment properties — — (2,289) (12,786) (485) FFO $14,883 $13,307 $15,250 $14,710 $15,094 Loss on extinguishment of debt — 868 — — — Amortization of above market leases, net 251 240 234 287 291 Straight line deferred rental revenue (400) (273) (721) (879) (763) Stock-based compensation expense 1,233 1,222 1,185 1,147 688 Amortization of debt issuance costs and other 562 581 593 601 601 Preacquisition expense — — — 2 42 AFFO $16,529 $15,945 $16,541 $15,868 $15,953 Net income attributable to common stockholders per share – basic and diluted $0.01 ($0.01) $0.05 $0.18 $0.01 FFO per share and unit $0.21 $0.19 $0.22 $0.21 $0.22 AFFO per share and unit $0.23 $0.23 $0.23 $0.23 $0.23 Wtd Average Common Shares, OP and LTIP Units outstanding: Common shares 65,573 65,565 65,565 65,544 65,525 OP units 2,244 2,244 2,244 2,134 1,667 LTIP units 2,940 2,756 2,757 2,747 2,638 Wtd Average Common Shares, OP and LTIP Units Outstanding - basic and diluted 70,757 70,565 70,566 70,434 69,830 March 31, December 31, September 30, June 30, March 31, EBITDAre and Adjusted EBITDAre 2024 2023 2023 2023 2023 Net income $2,314 $551 $4,833 $14,177 $2,173 Interest expense 6,890 6,984 7,170 8,468 8,271 Depreciation and amortization expense 14,084 14,245 14,195 14,805 14,889 Gain on sale of investment properties — — (2,289) (12,786) (485) EBITDAre $23,288 $21,780 $23,909 $24,664 $24,848 Loss on extinguishment of debt — 868 — — — Stock-based compensation expense 1,233 1,222 1,185 1,147 688 Amortization of above market leases, net 251 240 234 287 291 Preacquisition expense — — — 2 42 Adjusted EBITDAre $24,772 $24,110 $25,328 $26,100 $25,869 Three Months Ended Three Months Ended
1Q - 2024 | Earnings Supplemental 20 REPORTING DEFINITIONS AND OTHER DISCLOSURES Annualized Base Rent Annualized base rent represents monthly base rent for March 2024, multiplied by 12 (or base rent net of annualized expenses for properties with gross leases). Accordingly, this methodology produces an annualized amount as of a point in time but does not take into account future ( i ) contractual rental rate increases, (ii) leasing activity or (iii) lease expirations. Additionally, leases that are accounted for on a cash - collected basis are not included in annualized base rent. Capitalization Rate The capitalization rate (“Cap Rate”) for an acquisition is calculated by dividing current Annualized Base Rent by contractual purchase price. For the portfolio capitalization rate, certain adjustments, including for subsequent capital invested, are made to the contractual purchase price. Earnings Before Interest, Taxes, Depreciation and Amortization for Real Estate (“ EBITDAre ” and “Adjusted EBITDAre ”) We calculate EBITDAre in accordance with standards established by NAREIT and define EBITDAre as net income or loss computed in accordance with GAAP plus depreciation and amortization, interest expense, gain or loss on the sale of investment properties, and impairment loss, as applicable. We define Adjusted EBITDAre as EBITDAre plus loss on the extinguishment of debt, non - cash stock compensation expense, non - cash intangible amortization related to above and below market leases, preacquisition expense and other normalizing items. Management considers EBITDAre and Adjusted EBITDAre important measures because they provide additional information to allow management, investors, and our current and potential creditors to evaluate and compare our core operating results and our ability to service debt. Funds from Operations and Adjusted Funds from Operations Funds from operations (“FFO”) and adjusted funds from operations (“AFFO”) are non - GAAP financial measures within the meaning of the rules of the SEC. The Company considers FFO and AFFO to be important supplemental measures of its operating performance and believes FFO is frequently used by securities analysts, investors, and other interested parties in the evaluation of REITs, many of which present FFO when reporting their results. In accordance with the National Association of Real Estate Investment Trusts’ (“NAREIT”) definition, FFO means net income or loss computed in accordance with GAAP before noncontrolling interests of holders of OP units and LTIP units, excluding gains (or losses) from sales of property and extraordinary items, less preferred stock dividends, plus real estate - related depreciation and amortization (excluding amortization of debt issuance costs and the amortization of above and below market leases), and after adjustments for unconsolidated partnerships and joint ventures. Because FFO excludes real estate - related depreciation and amortization (other than amortization of debt issuance costs and above and below market lease amortization expense), the Company believes that FFO provides a performance measure that, when compared period - over - period, reflects the impact to operations from trends in occupancy rates, rental rates, operating costs, development activities and interest costs, providing perspective not immediately apparent from the closest GAAP measurement, net income or loss. AFFO is a non - GAAP measure used by many investors and analysts to measure a real estate company’s operating performance by removing the effect of items that do not reflect ongoing property operations. Management calculates AFFO by modifying the NAREIT computation of FFO by adjusting it for certain cash and non - cash items and certain recurring and non - recurring items. For the Company these items include recurring acquisition and disposition costs, loss on the extinguishment of debt, recurring straight line deferred rental revenue, recurring stock - based compensation expense, recurring amortization of above and below market leases, recurring amortization of debt issuance costs, and other items. Management believes that reporting AFFO in addition to FFO is a useful supplemental measure for the investment community to use when evaluating the operating performance of the Company on a comparative basis.
1Q - 2024 | Earnings Supplemental 21 REPORTING DEFINITIONS AND OTHER DISCLOSURES Rent Coverage Ratio For purposes of calculating our portfolio weighted - average EBITDARM coverage ratio (“Rent Coverage Ratio”), we excluded credit - rated tenants or their subsidiaries for which financial statements were either not available or not sufficiently detailed. These ratios are based on the latest available information only. Most tenant financial statements are unaudited and we have not independently verified any tenant financial information (audited or unaudited) and, therefore, we cannot assure you that such information is accurate or complete. Certain other tenants (approximately 21% of our portfolio) are excluded from the calculation due to (i) lack of available financial information or (ii) small tenant size. Additionally, included within 21% of non - reporting tenants is Pipeline Healthcare, LLC, which was sold to Heights Healthcare in October 2023 and is being operated under new management. Additionally, our Rent Coverage Ratio adds back physician distributions and compensation. Management believes all adjustments are reasonable and necessary. Other Disclosures Non - GAAP Financial Measures Management considers certain non - GAAP financial measures to be useful supplemental measures of the Company's operating performance. For the Company, non - GAAP measures consist of EBITDAre , Adjusted EBITDAre , FFO and AFFO. A non - GAAP financial measure is generally defined as one that purports to measure financial performance, financial position or cash flows, but excludes or includes amounts that would not be so adjusted in the most comparable measure determined in accordance with GAAP. The Company reports non - GAAP financial measures because these measures are observed by management to also be among the most predominant measures used by the REIT industry and by industry analysts to evaluate REITs. For these reasons, management deems it appropriate to disclose and discuss these non - GAAP financial measures. The non - GAAP financial measures presented herein are not necessarily identical to those presented by other real estate companies due to the fact that not all real estate companies use the same definitions. These measures should not be considered as alternatives to net income, as indicators of the Company's financial performance, or as alternatives to cash flow from operating activities as measures of the Company's liquidity, nor are these measures necessarily indicative of sufficient cash flow to fund all of the Company's needs. Management believes that in order to facilitate a clear understanding of the Company's historical consolidated operating results, these measures should be examined in conjunction with net income and cash flows from operations as presented elsewhere herein. Additional Information The information in this document should be read in conjunction with the Company’s Annual Report on Form 10 - K, Quarterly Reports on Form 10 - Q, Current Reports on Form 8 - K, and other information filed with, or furnished to, the SEC. You can access the Company’s reports and amendments to those reports filed or furnished to the SEC pursuant to Section 13(a) or 15(d) of the Exchange Act in the “Investor Relations” section on the Company’s website (www.globalmedicalreit.com) under “SEC Filings” as soon as reasonably practicable after they are filed with, or furnished to, the SEC. The information on or connected to the Company’s website is not, and shall not be deemed to be, a part of, or incorporated into, this Earnings Supplemental. You also can review these SEC filings and other information by accessing the SEC’s website at http://www.sec.gov . Certain information contained in this package, including, but not limited to, information contained in our Top 10 tenant profiles is derived from publicly - available third - party sources. The Company has not independently verified this information and there can be no assurance that such information is accurate or complete.

INVESTOR RELATIONS globalmedicalreit.com NYSE: GMRE Stephen Swett 203.682.8377 stephen.swett@icrinc.com