Exhibit 99.2
THIRD QUARTER 2025 EARNINGS SUPPLEMENTAL www.globalmedicalreit.com NYSE: GMRE St. Joseph’s Medical Plaza – Tucson, AZ
Forward - Looking Statements Certain statements contained herein may be considered “forward - looking statements” within the meaning of the Private Securities Litigation Reform Act of 1995 , and it is the Company’s intent that any such statements be protected by the safe harbor created thereby . These forward - looking statements are identified by their use of terms and phrases such as "anticipate," "believe," "could," "estimate," "expect," "intend," "may," "should," "plan," "predict," "project," "will," "continue" and other similar terms and phrases, including references to assumptions and forecasts of future results . Except for historical information, the statements set forth herein including, but not limited to, any statements regarding our earnings, our liquidity, our tenants’ ability to pay rent to us, our ability to refinance our indebtedness, expected financial performance (including future cash flows associated with our joint venture, new tenants or the expansion of current properties), 2025 AFFO guidance, future dividends, interest rates or other financial items ; any other statements concerning our plans, strategies, objectives and expectations for future operations and future portfolio occupancy rates, our pipeline of acquisition opportunities and expected acquisition activity, including the timing and/or successful completion of any acquisitions and expected rent receipts on these properties, our expected disposition activity, including the timing and/or successful completion of any dispositions and the expected use of proceeds therefrom, and any statements regarding future economic conditions or performance are forward - looking statements . These forward - looking statements are based on our current expectations, estimates and assumptions and are subject to certain risks and uncertainties . Although the Company believes that the expectations, estimates and assumptions reflected in its forward - looking statements are reasonable, actual results could differ materially from those projected or assumed in any of the Company’s forward - looking statements . Additional information concerning us and our business, including additional factors that could materially and adversely affect our financial results, include, without limitation, the risks described under Part I, Item 1 A - Risk Factors, in our Annual Report on Form 10 - K, our Quarterly Reports on Form 10 - Q, and in our other filings with the SEC . You are cautioned not to place undue reliance on forward - looking statements . The Company does not intend, and undertakes no obligation, to update any forward - looking statement . TABLE OF CONTENTS 3 Company Overview 6 Select Quarterly Financial Data 7 Business Summary 8 Acquisitions / Dispositions 9 Portfolio Summary 11 Key Tenants 12 Debt and Hedging Summary 14 Total Capitalization and Equity Summary 15 Condensed Consolidated Statements of Operations 16 Condensed Consolidated Balance Sheets 17 Condensed Consolidated Statements of Cash Flows 18 Non - GAAP Reconciliations 21 Reporting Definitions and Other Disclosures Legent Hospital for Special Surgery – Plano, TX 3Q - 2025 | Earnings Supplemental 2
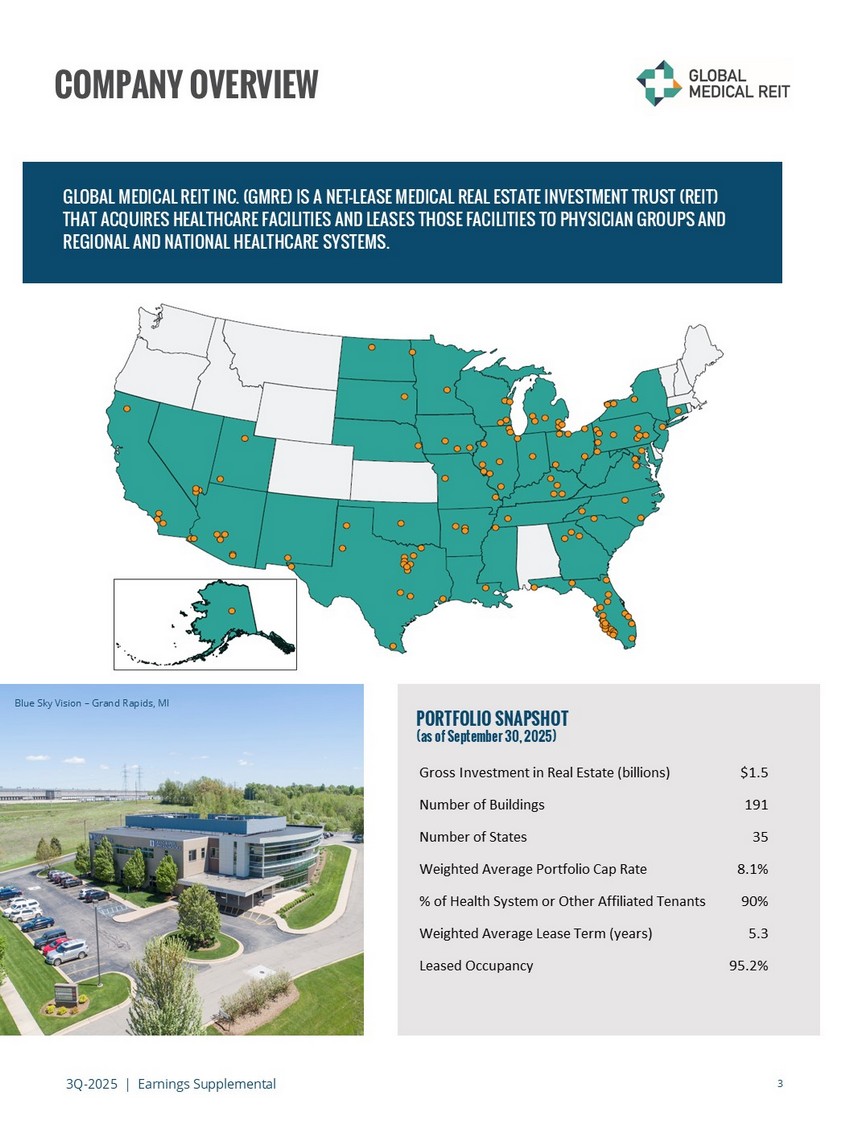
3Q - 2025 | Earnings Supplemental 3 COMPANY OVERVIEW GLOBAL MEDICAL REIT INC. (GMRE) IS A NET - LEASE MEDICAL REAL ESTATE INVESTMENT TRUST (REIT) THAT ACQUIRES HEALTHCARE FACILITIES AND LEASES THOSE FACILITIES TO PHYSICIAN GROUPS AND REGIONAL AND NATIONAL HEALTHCARE SYSTEMS. PORTFOLIO SNAPSHOT (as of September 30, 2025) Blue Sky Vision – Grand Rapids, MI Gross Investment in Real Estate (billions) $1.5 Number of Buildings 191 Number of States 35 Weighted Average Portfolio Cap Rate 8.1% % of Health System or Other Affiliated Tenants 90% Weighted Average Lease Term (years) 5.3 Leased Occupancy 95.2%

63% 3Q - 2025 | Earnings Supplemental 4 Chief Executive Officer and President Mark Decker, Jr. Chief Financial Officer and Treasurer Robert Kiernan Chief Investment Officer Alfonzo Leon Chief Operating Officer Danica Holley General Counsel and Corporate Secretary Jamie Barber Board of Directors Chairman of the Board Jeffrey Busch ESG Committee Chair, Compensation Committee Member, Audit Committee Member, Nominating and Corporate Governance Committee Member Henry Cole Compensation Committee Chair, Audit Committee Member, Nominating and Corporate Governance Committee Member Paula Crowley Nominating and Corporate Governance Committee Chair, ESG Committee Member, Audit Committee Member Matthew Cypher, Ph.D. Chief Executive Officer and President Mark Decker, Jr. Nominating and Corporate Governance Committee Member, Compensation Committee Member Ronald Marston Lead Independent Director, Audit Committee Chair, ESG Committee Member Lori Wittman Director Zhang Huiqi INDEPENDENT DIRECTORS BOARD % OF WOMEN COMPANY OVERVIEW 38% Executive Officers
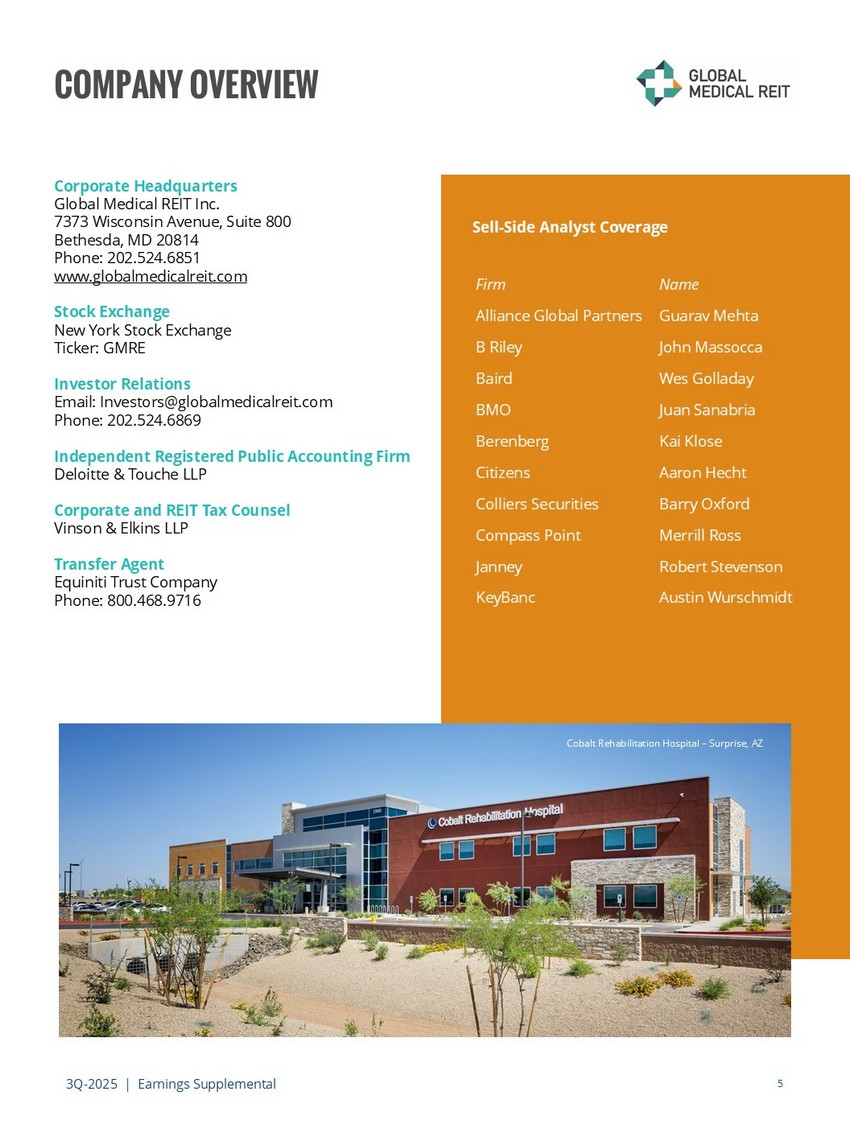
3Q - 2025 | Earnings Supplemental 5 COMPANY OVERVIEW Corporate Headquarters Global Medical REIT Inc. 7373 Wisconsin Avenue, Suite 800 Bethesda, MD 20814 Phone: 202.524.6851 www.globalmedicalreit.com Stock Exchange New York Stock Exchange Ticker: GMRE Investor Relations Email: Investors@globalmedicalreit.com Phone: 202.524.6869 Independent Registered Public Accounting Firm Deloitte & Touche LLP Corporate and REIT Tax Counsel Vinson & Elkins LLP Transfer Agent Equiniti Trust Company Phone: 800.468.9716 Cobalt Rehabilitation Hospital – Surprise, AZ Name Firm Guarav Mehta Alliance Global Partners John Massocca B Riley Wes Golladay Baird Juan Sanabria BMO Kai Klose Berenberg Aaron Hecht Citizens Barry Oxford Colliers Securities Merrill Ross Compass Point Robert Stevenson Janney Austin Wurschmidt KeyBanc Sell - Side Analyst Coverage
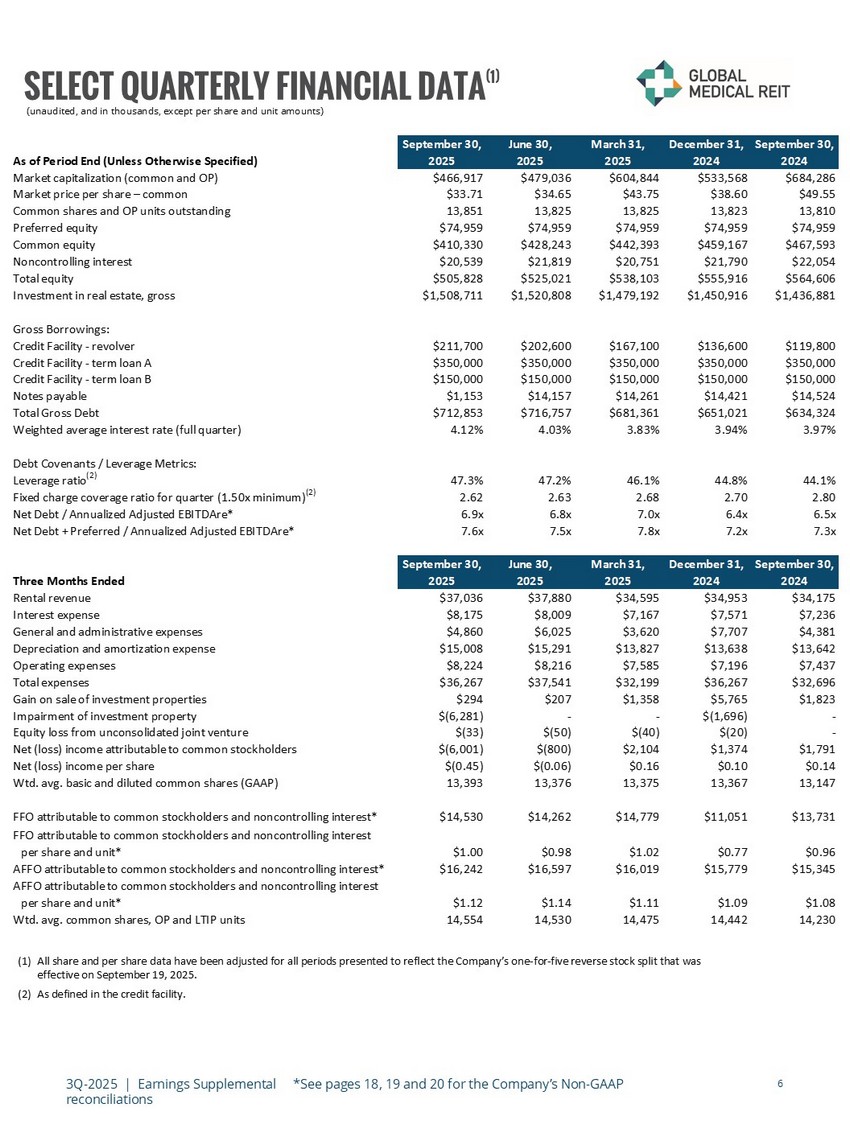
3Q - 2025 | Earnings Supplemental *See pages 18, 19 and 20 for the Company’s Non - GAAP reconciliations 6 (unaudited, and in thousands, except per share and unit amounts) SELECT QUARTERLY FINANCIAL DATA (1) (1) All share and per share data have been adjusted for all periods presented to reflect the Company’s one - for - five reverse stock sp lit that was effective on September 19, 2025. (2) As defined in the credit facility. September 30, June 30, March 31, December 31, September 30, As of Period End (Unless Otherwise Specified) 2025 2025 2025 2024 2024 Market capitalization (common and OP) $466,917 $479,036 $604,844 $533,568 $684,286 Market price per share – common $33.71 $34.65 $43.75 $38.60 $49.55 Common shares and OP units outstanding 13,851 13,825 13,825 13,823 13,810 Preferred equity $74,959 $74,959 $74,959 $74,959 $74,959 Common equity $410,330 $428,243 $442,393 $459,167 $467,593 Noncontrolling interest $20,539 $21,819 $20,751 $21,790 $22,054 Total equity $505,828 $525,021 $538,103 $555,916 $564,606 Investment in real estate, gross $1,508,711 $1,520,808 $1,479,192 $1,450,916 $1,436,881 Gross Borrowings: Credit Facility - revolver $211,700 $202,600 $167,100 $136,600 $119,800 Credit Facility - term loan A $350,000 $350,000 $350,000 $350,000 $350,000 Credit Facility - term loan B $150,000 $150,000 $150,000 $150,000 $150,000 Notes payable $1,153 $14,157 $14,261 $14,421 $14,524 Total Gross Debt $712,853 $716,757 $681,361 $651,021 $634,324 Weighted average interest rate (full quarter) 4.12% 4.03% 3.83% 3.94% 3.97% Debt Covenants / Leverage Metrics: Leverage ratio (2) 47.3% 47.2% 46.1% 44.8% 44.1% Fixed charge coverage ratio for quarter (1.50x minimum) (2) 2.62 2.63 2.68 2.70 2.80 Net Debt / Annualized Adjusted EBITDAre* 6.9x 6.8x 7.0x 6.4x 6.5x Net Debt + Preferred / Annualized Adjusted EBITDAre* 7.6x 7.5x 7.8x 7.2x 7.3x September 30, June 30, March 31, December 31, September 30, Three Months Ended 2025 2025 2025 2024 2024 Rental revenue $37,036 $37,880 $34,595 $34,953 $34,175 Interest expense $8,175 $8,009 $7,167 $7,571 $7,236 General and administrative expenses $4,860 $6,025 $3,620 $7,707 $4,381 Depreciation and amortization expense $15,008 $15,291 $13,827 $13,638 $13,642 Operating expenses $8,224 $8,216 $7,585 $7,196 $7,437 Total expenses $36,267 $37,541 $32,199 $36,267 $32,696 Gain on sale of investment properties $294 $207 $1,358 $5,765 $1,823 Impairment of investment property $(6,281) - - $(1,696) - Equity loss from unconsolidated joint venture $(33) $(50) $(40) $(20) - Net (loss) income attributable to common stockholders $(6,001) $(800) $2,104 $1,374 $1,791 Net (loss) income per share $(0.45) $(0.06) $0.16 $0.10 $0.14 Wtd. avg. basic and diluted common shares (GAAP) 13,393 13,376 13,375 13,367 13,147 FFO attributable to common stockholders and noncontrolling interest* $14,530 $14,262 $14,779 $11,051 $13,731 FFO attributable to common stockholders and noncontrolling interest per share and unit* $1.00 $0.98 $1.02 $0.77 $0.96 AFFO attributable to common stockholders and noncontrolling interest* $16,242 $16,597 $16,019 $15,779 $15,345 AFFO attributable to common stockholders and noncontrolling interest per share and unit* $1.12 $1.14 $1.11 $1.09 $1.08 Wtd. avg. common shares, OP and LTIP units 14,554 14,530 14,475 14,442 14,230
3Q - 2025 | Earnings Supplemental See pages 18,19 and 20 for the Company’s Non - GAAP reconciliations 7 BUSINESS SUMMARY THIRD QUARTER 2025 OPERATING SUMMARY (1) • Net loss attributable to common stockholders was $6.0 million, or $0.45 per diluted share, as compared to net income of $1.8 million, or $0.14 per diluted share, in the comparable prior year period. The current quarter net loss primarily resulted from a $6.3 million impairment charge recognized during the quarter related to our facility in Aurora, IL, an unoccupied health system administrative use facility, which was subsequently sold during the quarter. • Funds from operations attributable to common stockholders and noncontrolling interest (“FFO”) increased to $14.5 million, or $1.00 per share and unit, as compared to $13.7 million, or $0.96 per share and unit, in the comparable prior year period, representing a 4% year - over - year increase on a per share and unit basis. • Adjusted funds from operations attributable to common stockholders and noncontrolling interest (“AFFO”) increased to $16.2 million, or $1.12 per share and unit, as compared to $15.3 million, or $1.08 per share and unit, in the comparable prior year period, representing a 4% year - over - year increase on a per share and unit basis. • Third quarter same - store cash net operating income (“Same - Store Cash NOI”) growth was 2.7% on a year - over - year basis. • Portfolio leased occupancy was 95.2% at September 30, 2025. INVESTMENT AND PORTFOLIO ACTIVITY • During the quarter, the Company completed the disposition of two facilities, receiving aggregate gross proceeds of $3.8 million, resulting in an aggregate gain of $0.3 million. Prior to completion of the sale of its facility in Aurora, IL, the Company recognized an impairment charge of $6.3 million. This facility was used as administrative space for a healthcare system tenant, and after the COVID - 19 pandemic, the healthcare system reduced its administrative space usage and thus did not renew its lease. CAPITAL MARKETS AND DEBT ACTIVITY • In July 2025, we fully repaid the $12.9 million Rosedale loan using borrowings from the revolving credit facility. • In August 2025, we established a $50 million common stock repurchase program (the “Stock Repurchase Program”). As of November 3, 2025, we had not repurchased any shares of our common stock under the Stock Repurchase Program. • In September 2025, we completed a one - for - five reverse stock split (the “Reverse Stock Split”) of the Company’s issued and outstanding shares of common stock. • In October 2025, we amended and restated our credit facility to, among other things, extend the maturities of the revolver and Term Loan A components of our credit facility. Additional details on the maturities and rates can be found on pages 12 and 13. • At September 30, 2025, consolidated debt outstanding was $713 million and the Company’s leverage was 47.3%, and Net Debt / Annualized Adjusted EBITDAre was 6.9x for the quarter. • As of November 3, 2025, the Company’s borrowing capacity under the credit facility was $171 million. (1) All share and per share data have been adjusted for all periods presented to reflect the Company’s one - for - five reverse stock sp lit that was effective on September 19, 2025.
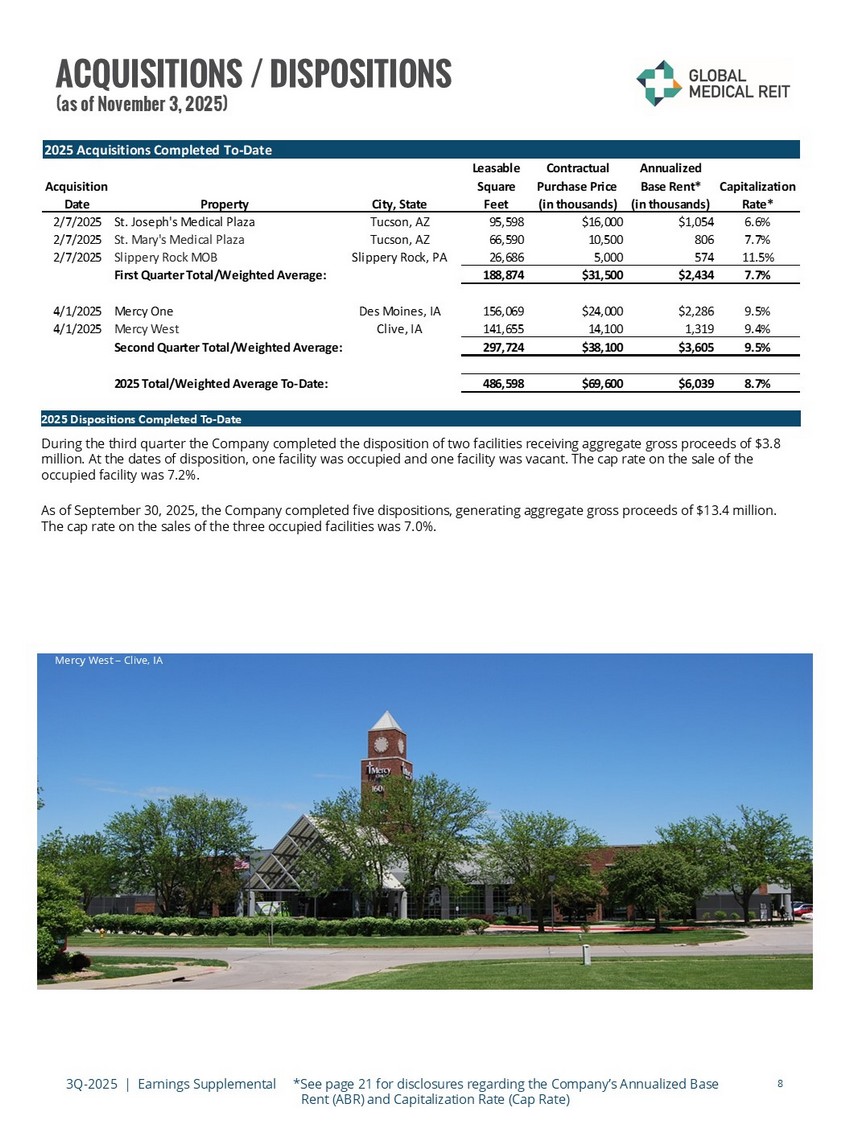
3Q - 2025 | Earnings Supplemental *See page 21 for disclosures regarding the Company’s Annualized Base Rent (ABR) and Capitalization Rate (Cap Rate) 8 ACQUISITIONS / DISPOSITIONS (as of November 3, 2025) Pediatrics Plus – Russellville, AR 2025 Dispositions Completed To - Date During the third quarter the Company completed the disposition of two facilities receiving aggregate gross proceeds of $3.8 million. At the dates of disposition, one facility was occupied and one facility was vacant. The cap rate on the sale of the occupied facility was 7.2%. As of September 30, 2025, the Company completed five dispositions, generating aggregate gross proceeds of $13.4 million. The cap rate on the sales of the three occupied facilities was 7.0%. Mercy West – Clive, IA Acquisition Date Property City, State Leasable Square Feet Contractual Purchase Price (in thousands) Annualized Base Rent* (in thousands) Capitalization Rate* 2/7/2025 St. Joseph's Medical Plaza Tucson, AZ 95,598 $16,000 $1,054 6.6% 2/7/2025 St. Mary's Medical Plaza Tucson, AZ 66,590 10,500 806 7.7% 2/7/2025 Slippery Rock MOB Slippery Rock, PA 26,686 5,000 574 11.5% First Quarter Total/Weighted Average: 188,874 $31,500 $2,434 7.7% 4/1/2025 Mercy One Des Moines, IA 156,069 $24,000 $2,286 9.5% 4/1/2025 Mercy West Clive, IA 141,655 14,100 1,319 9.4% Second Quarter Total/Weighted Average: 297,724 $38,100 $3,605 9.5% 2025 Total/Weighted Average To-Date: 486,598 $69,600 $6,039 8.7% 2025 Acquisitions Completed To-Date
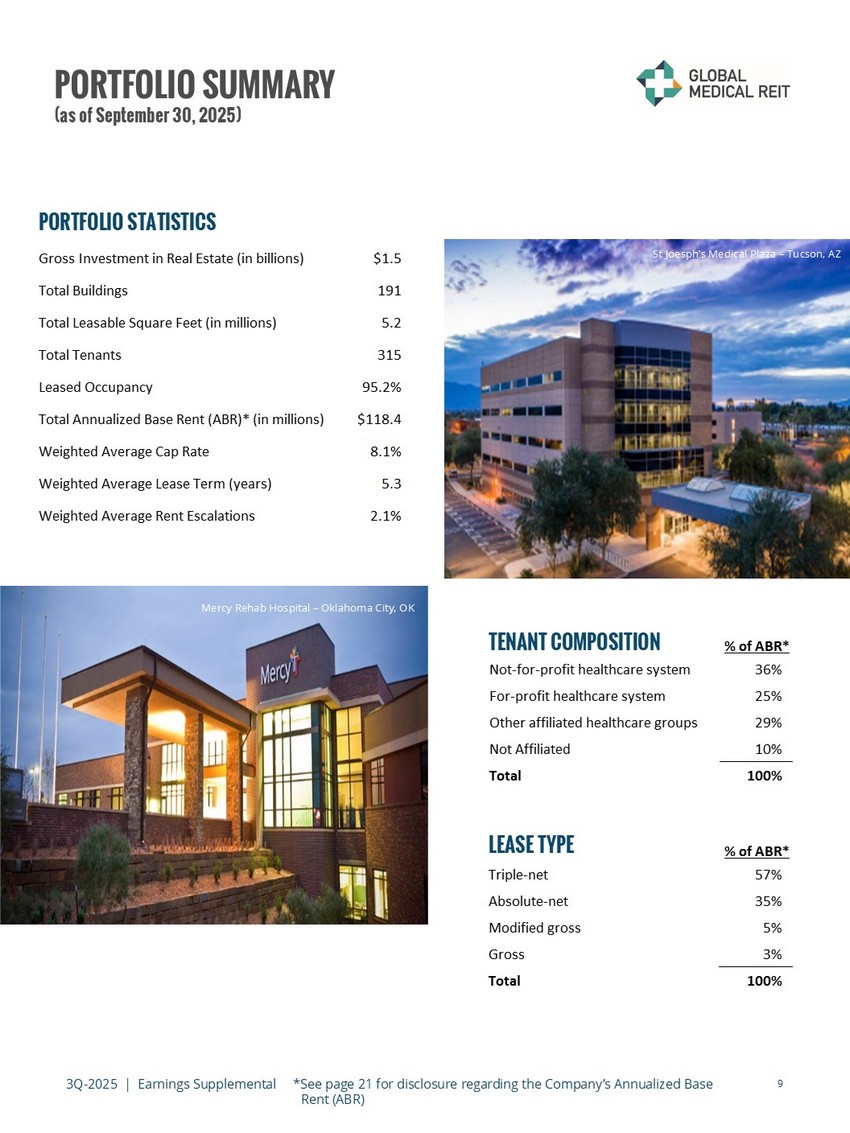
3Q - 2025 | Earnings Supplemental *See page 21 for disclosure regarding the Company’s Annualized Base Rent (ABR) 9 PORTFOLIO SUMMARY (as of September 30, 2025) PORTFOLIO STATISTICS TENANT COMPOSITION Texas Digestive Disease Consultants – Ft. Worth, TX Indiana Eye Clinic – Greenwood, IN Mercy Rehab Hospital – Oklahoma City, OK St Joesph’s Medical Plaza – Tucson, AZ LEASE TYPE Gross Investment in Real Estate (in billions) $1.5 Total Buildings 191 Total Leasable Square Feet (in millions) 5.2 Total Tenants 315 Leased Occupancy 95.2% Total Annualized Base Rent (ABR)* (in millions) $118.4 Weighted Average Cap Rate 8.1% Weighted Average Lease Term (years) 5.3 Weighted Average Rent Escalations 2.1% % of ABR* Not-for-profit healthcare system 36% For-profit healthcare system 25% Other affiliated healthcare groups 29% Not Affiliated 10% Total 100% % of ABR* Triple-net 57% Absolute-net 35% Modified gross 5% Gross 3% Total 100%
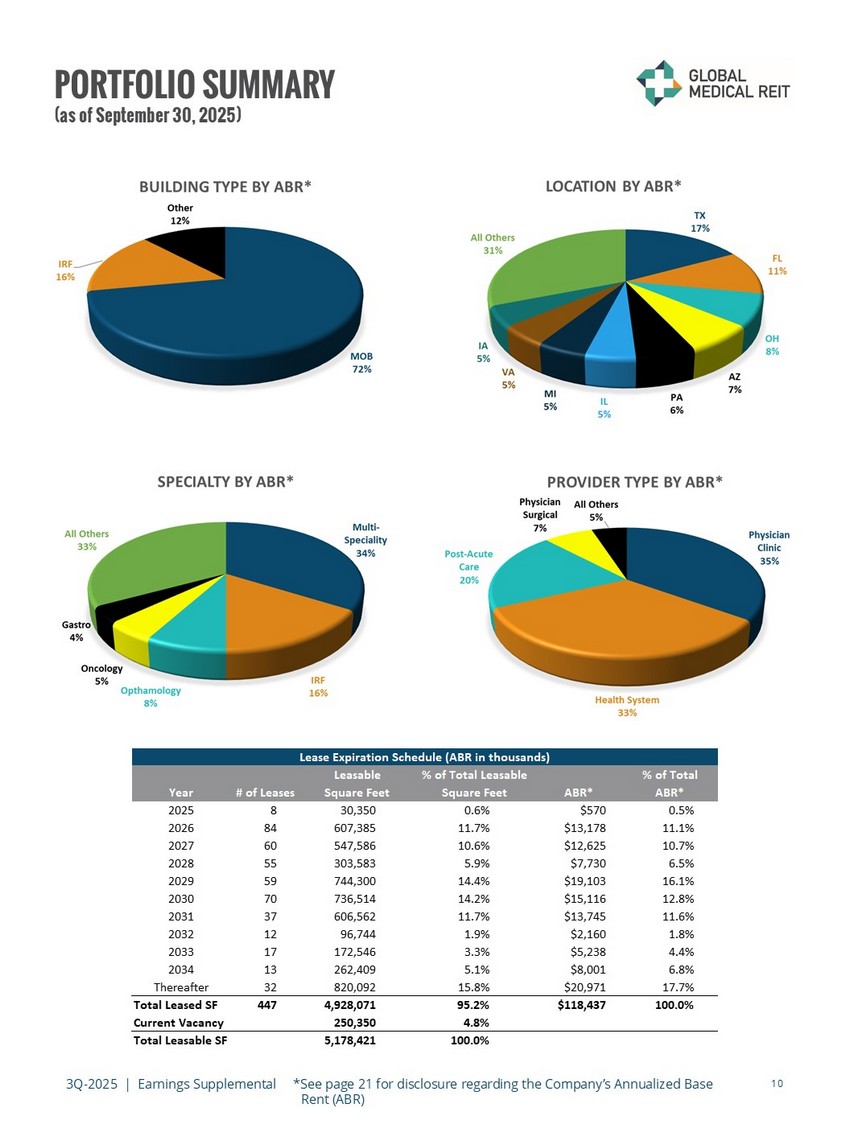
3Q - 2025 | Earnings Supplemental *See page 21 for disclosure regarding the Company’s Annualized Base Rent (ABR) 10 PORTFOLIO SUMMARY (as of September 30, 2025) Leasable % of Total Leasable % of Total Year # of Leases Square Feet Square Feet ABR* ABR* 2025 8 30,350 0.6% $570 0.5% 2026 84 607,385 11.7% $13,178 11.1% 2027 60 547,586 10.6% $12,625 10.7% 2028 55 303,583 5.9% $7,730 6.5% 2029 59 744,300 14.4% $19,103 16.1% 2030 70 736,514 14.2% $15,116 12.8% 2031 37 606,562 11.7% $13,745 11.6% 2032 12 96,744 1.9% $2,160 1.8% 2033 17 172,546 3.3% $5,238 4.4% 2034 13 262,409 5.1% $8,001 6.8% Thereafter 32 820,092 15.8% $20,971 17.7% Total Leased SF 447 4,928,071 95.2% $118,437 100.0% Current Vacancy 250,350 4.8% Total Leasable SF 5,178,421 100.0% Lease Expiration Schedule (ABR in thousands)
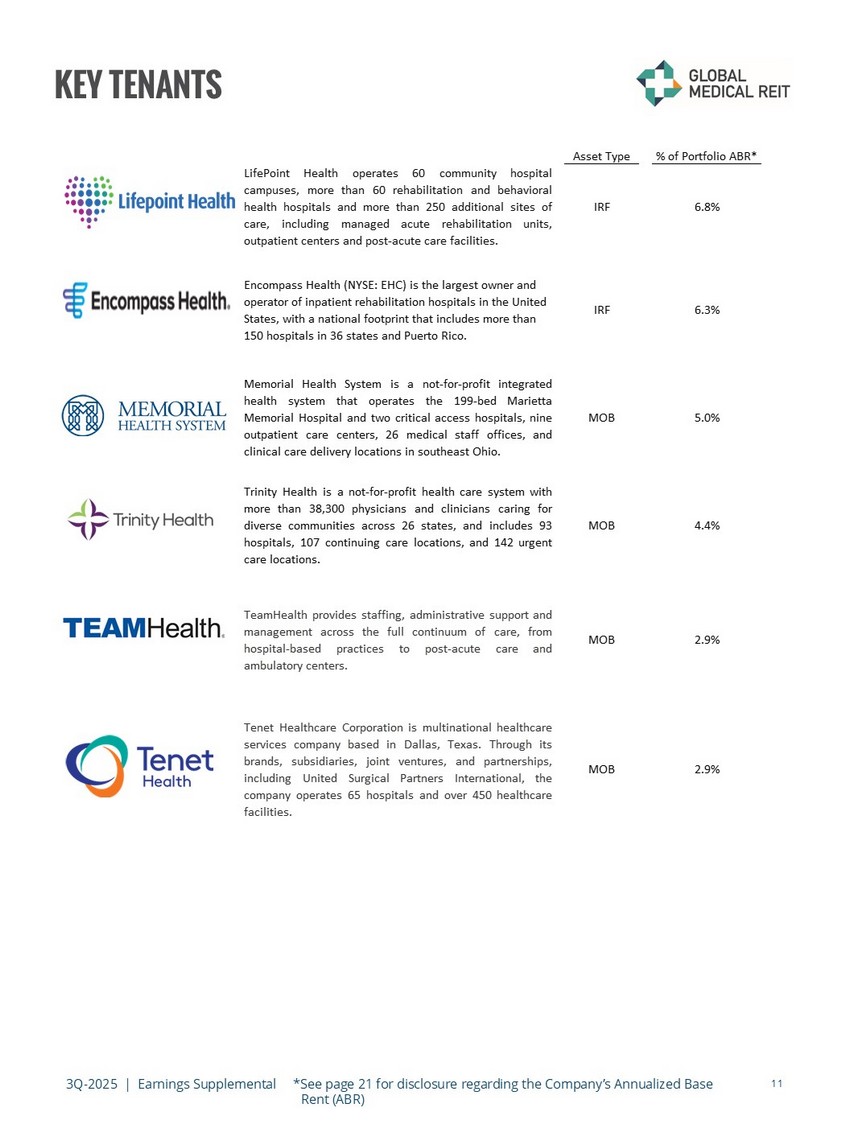
3Q - 2025 | Earnings Supplemental *See page 21 for disclosure regarding the Company’s Annualized Base Rent (ABR) 11 KEY TENANTS Asset Type % of Portfolio ABR* LifePoint Health operates 60 community hospital campuses, more than 60 rehabilitation and behavioral healthhospitalsandmorethan250additionalsitesof care, including managed acute rehabilitation units, outpatient centers and post-acute care facilities. IRF 6.8% Encompass Health (NYSE: EHC) is the largest owner and operator of inpatient rehabilitation hospitals in the United States, with a national footprint that includes more than 150 hospitals in 36 states and Puerto Rico. IRF 6.3% Memorial Health System is a not-for-profit integrated health system that operates the 199-bed Marietta MemorialHospitalandtwocriticalaccesshospitals,nine outpatient care centers, 26 medical staff offices, and clinical care delivery locations in southeast Ohio. MOB 5.0% TrinityHealthisanot-for-profithealthcaresystemwith more than 38,300 physicians and clinicians caring for diversecommunitiesacross26states,and includes93 hospitals,107continuingcarelocations,and142urgent care locations. MOB 4.4% TeamHealthprovidesstaffing,administrativesupportand management across the full continuum of care, from hospital-based practices to post-acute care and ambulatory centers. MOB 2.9% TenetHealthcareCorporationismultinationalhealthcare services company based in Dallas, Texas. Through its brands, subsidiaries, joint ventures, and partnerships, including United Surgical Partners International, the companyoperates65hospitalsandover450healthcare facilities. MOB 2.9%
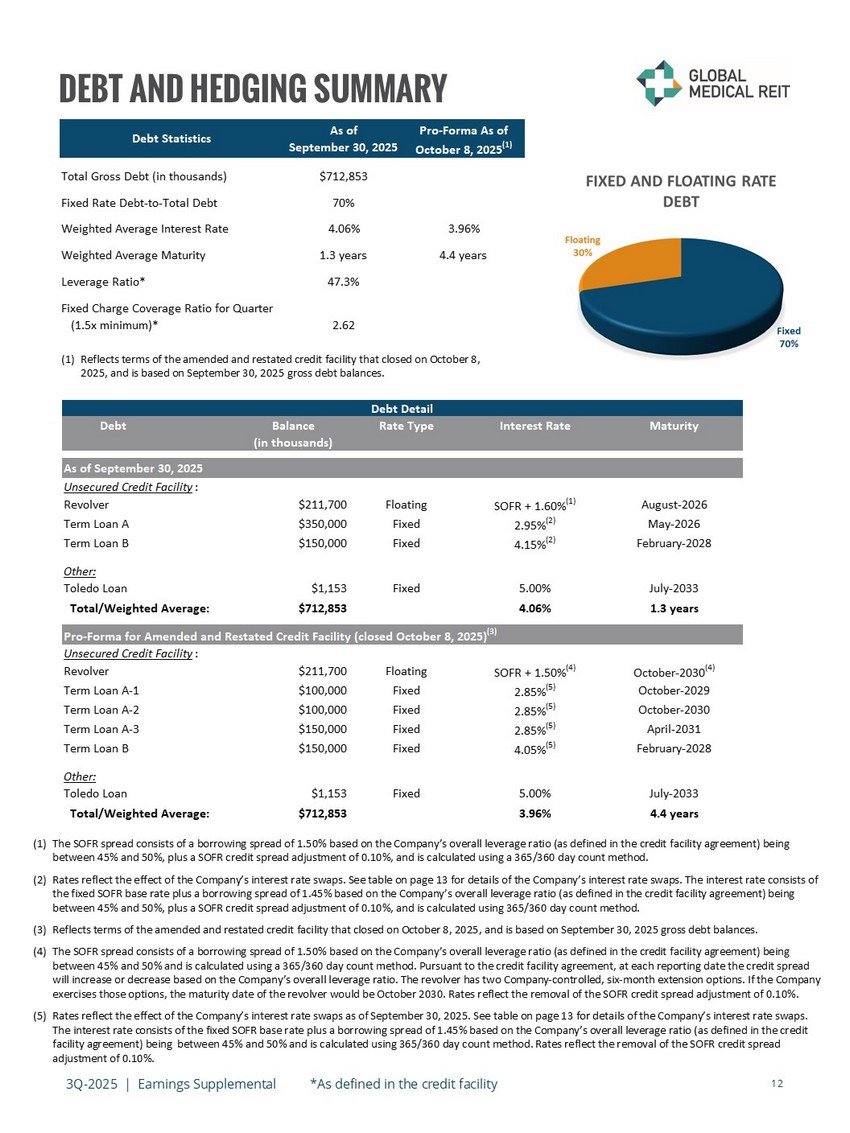
3Q - 2025 | Earnings Supplemental *As defined in the credit facility 12 DEBT AND HEDGING SUMMARY (1) The SOFR spread consists of a borrowing spread of 1.50% based on the Company’s overall leverage ratio (as defined in the cred it facility agreement) being between 45% and 50%, plus a SOFR credit spread adjustment of 0.10%, and is calculated using a 365/360 day count method. (2) Rates reflect the effect of the Company’s interest rate swaps. See table on page 13 for details of the Company’s interest rat e s waps. The interest rate c onsists of the fixed SOFR base rate plus a borrowing spread of 1.45% based on the Company’s overall leverage ratio (as defined in the credit facility agreement) being between 45% and 50%, plus a SOFR credit spread adjustment of 0.10%, and is calculated using 365/360 day count method . (3) Reflects terms of the amended and restated credit facility that closed on October 8, 2025, and is based on September 30, 2025 gr oss debt balances. (4) The SOFR spread consists of a borrowing spread of 1.50% based on the Company’s overall leverage ratio (as defined in the cred it facility agreement) being between 45% and 50% and is calculated using a 365/360 day count method. Pursuant to the credit facility agreement, at each re por ting date the credit spread will increase or decrease based on the Company’s overall leverage ratio. The revolver has two Company - controlled, six - month exte nsion options. If the Company exercises those options, the maturity date of the revolver would be October 2030. Rates reflect the removal of the SOFR credi t s pread adjustment of 0.10%. (5) Rates reflect the effect of the Company’s interest rate swaps as of September 30, 2025. See table on page 13 for details of t he Company’s interest rate swaps. The interest rate c onsists of the fixed SOFR base rate plus a borrowing spread of 1.45% based on the Company’s overall leverage ratio (as define d i n the credit facility agreement) being between 45% and 50% and is calculated using 365/360 day count method. Rates reflect the removal of the SOFR credit spread adjustment of 0.10%. (1) Reflects terms of the amended and restated credit facility that closed on October 8, 2025, and is based on September 30, 2025 gross debt balances. Debt Statistics As of September 30, 2025 Pro-Forma As of October 8, 2025 (1) Total Gross Debt (in thousands) $712,853 Fixed Rate Debt-to-Total Debt 70% Weighted Average Interest Rate 4.06% 3.96% Weighted Average Maturity 1.3 years 4.4 years Leverage Ratio* 47.3% Fixed Charge Coverage Ratio for Quarter (1.5x minimum)* 2.62 Debt Balance Rate Type Interest Rate Maturity (in thousands) As of September 30, 2025 Unsecured Credit Facility: Revolver $211,700 Floating SOFR + 1.60% (1) August-2026 Term Loan A $350,000 Fixed 2.95% (2) May-2026 Term Loan B $150,000 Fixed 4.15% (2) February-2028 Other: Toledo Loan $1,153 Fixed 5.00% July-2033 Total/Weighted Average: $712,853 4.06% 1.3 years Pro-Forma for Amended and Restated Credit Facility (closed October 8, 2025) (3) Unsecured Credit Facility: Revolver $211,700 Floating SOFR + 1.50% (4) October-2030 (4) Term Loan A-1 $100,000 Fixed 2.85% (5) October-2029 Term Loan A-2 $100,000 Fixed 2.85% (5) October-2030 Term Loan A-3 $150,000 Fixed 2.85% (5) April-2031 Term Loan B $150,000 Fixed 4.05% (5) February-2028 Other: Toledo Loan $1,153 Fixed 5.00% July-2033 Total/Weighted Average: $712,853 3.96% 4.4 years Debt Detail
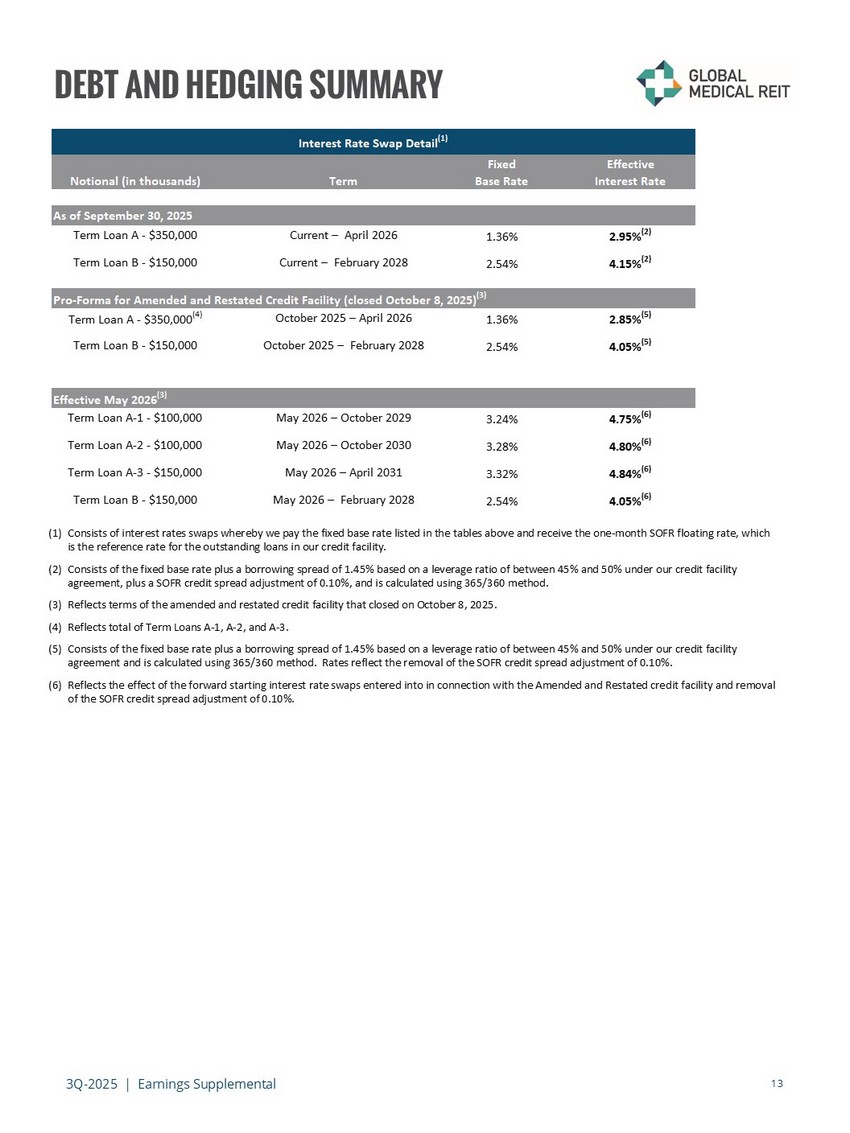
3Q - 2025 | Earnings Supplemental 13 DEBT AND HEDGING SUMMARY Citrus Valley Medical Associates – Corona, CA (1) Consists of interest rates swaps whereby we pay the fixed base rate listed in the tables above and receive the one - month SOFR fl oating rate, which is the reference rate for the outstanding loans in our credit facility. (2) Consists of the fixed base rate plus a borrowing spread of 1.45% based on a leverage ratio of between 45% and 50% under our c red it facility agreement, plus a SOFR credit spread adjustment of 0.10%, and is calculated using 365/360 method. (3) Reflects terms of the amended and restated credit facility that closed on October 8, 2025. (4) Reflects total of Term Loans A - 1, A - 2, and A - 3. (5) Consists of the fixed base rate plus a borrowing spread of 1.45% based on a leverage ratio of between 45% and 50% under our c red it facility agreement and is calculated using 365/360 method. Rates reflect the removal of the SOFR credit spread adjustment of 0.10%. (6) Reflects the effect of the forward starting interest rate swaps entered into in connection with the Amended and Restated cred it facility and removal of the SOFR credit spread adjustment of 0.10%. Fixed Effective Notional (in thousands) Term Base Rate Interest Rate As of September 30, 2025 Term Loan A - $350,000 Current – April 2026 1.36% 2.95% (2) Term Loan B - $150,000 Current – February 2028 2.54% 4.15% (2) Pro-Forma for Amended and Restated Credit Facility (closed October 8, 2025) (3) Term Loan A - $350,000 (4) October 2025 – April 2026 1.36% 2.85% (5) Term Loan B - $150,000 October 2025 – February 2028 2.54% 4.05% (5) Effective May 2026 (3) Term Loan A-1 - $100,000 May 2026 – October 2029 3.24% 4.75% (6) Term Loan A-2 - $100,000 May 2026 – October 2030 3.28% 4.80% (6) Term Loan A-3 - $150,000 May 2026 – April 2031 3.32% 4.84% (6) Term Loan B - $150,000 May 2026 – February 2028 2.54% 4.05% (6) Interest Rate Swap Detail (1)
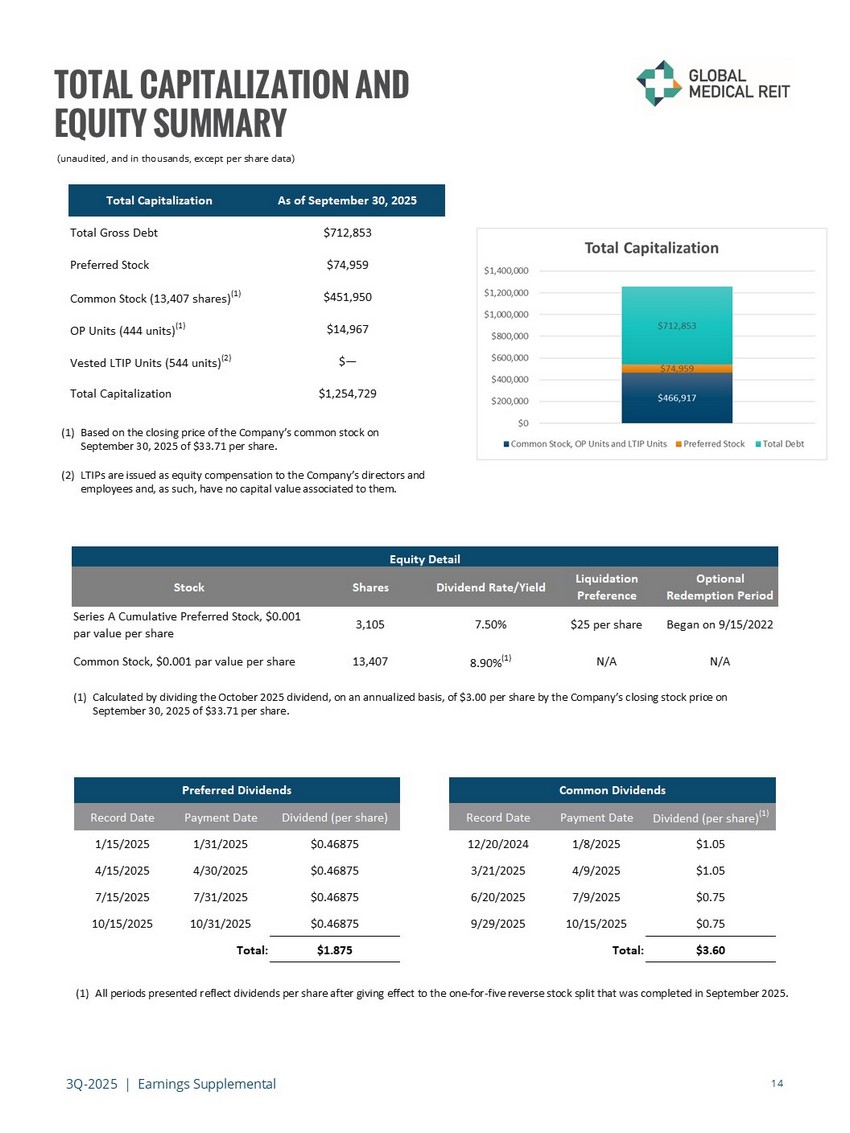
3Q - 2025 | Earnings Supplemental 14 TOTAL CAPITALIZATION AND EQUITY SUMMARY (unaudited, and in thousands, except per share data) (1) Based on the closing price of the Company’s common stock on September 30, 2025 of $33.71 per share. (2) LTIPs are issued as equity compensation to the Company’s directors and employees and, as such, have no capital value associated to them. (1) Calculated by dividing the October 2025 dividend, on an annualized basis, of $3.00 per share by the Company’s closing stock p ric e on September 30, 2025 of $33.71 per share. (1) All periods presented reflect dividends per share after giving effect to the one - for - five reverse stock split that was completed in September 2025. Total Capitalization As of September 30, 2025 Total Gross Debt $712,853 Preferred Stock $74,959 Common Stock (13,407 shares) (1) $451,950 OP Units (444 units) (1) $14,967 Vested LTIP Units (544 units) (2) $— Total Capitalization $1,254,729 Stock Shares Dividend Rate/Yield Liquidation Preference Optional Redemption Period Series A Cumulative Preferred Stock, $0.001 par value per share 3,105 7.50% $25 per share Began on 9/15/2022 Common Stock, $0.001 par value per share 13,407 8.90% (1) N/A N/A Equity Detail Record Date Payment Date Dividend (per share) Record Date Payment Date Dividend (per share) (1) 1/15/2025 1/31/2025 $0.46875 12/20/2024 1/8/2025 $1.05 4/15/2025 4/30/2025 $0.46875 3/21/2025 4/9/2025 $1.05 7/15/2025 7/31/2025 $0.46875 6/20/2025 7/9/2025 $0.75 10/15/2025 10/31/2025 $0.46875 9/29/2025 10/15/2025 $0.75 Total: $1.875 Total: $3.60 Preferred Dividends Common Dividends
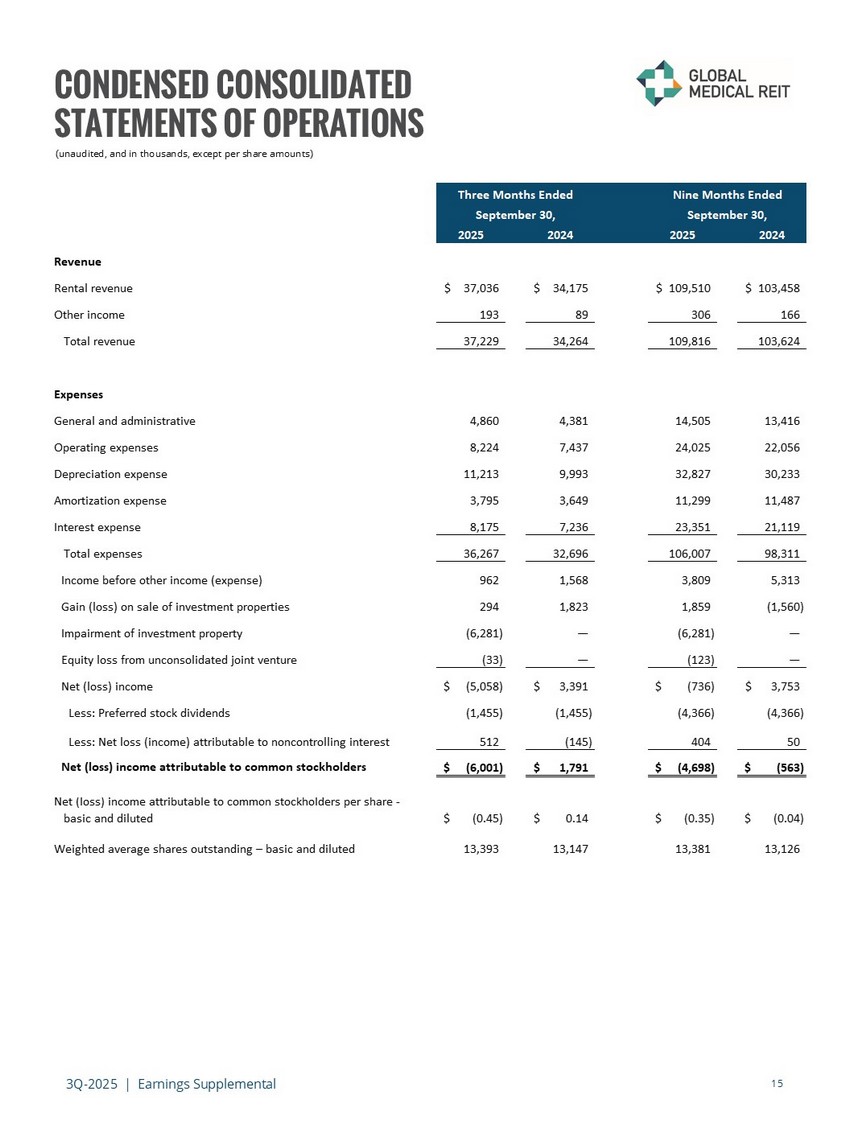
3Q - 2025 | Earnings Supplemental 15 CONDENSED CONSOLIDATED STATEMENTS OF OPERATIONS (unaudited, and in thousands, except per share amounts) 2025 2024 2025 2024 Revenue Rental revenue 37,036$ 34,175$ 109,510$ 103,458$ Other income 193 89 306 166 Total revenue 37,229 34,264 109,816 103,624 Expenses General and administrative 4,860 4,381 14,505 13,416 Operating expenses 8,224 7,437 24,025 22,056 Depreciation expense 11,213 9,993 32,827 30,233 Amortization expense 3,795 3,649 11,299 11,487 Interest expense 8,175 7,236 23,351 21,119 Total expenses 36,267 32,696 106,007 98,311 Income before other income (expense) 962 1,568 3,809 5,313 Gain (loss) on sale of investment properties 294 1,823 1,859 (1,560) Impairment of investment property (6,281) — (6,281) — Equity loss from unconsolidated joint venture (33) — (123) — Net (loss) income (5,058)$ 3,391$ (736)$ 3,753$ Less: Preferred stock dividends (1,455) (1,455) (4,366) (4,366) Less: Net loss (income) attributable to noncontrolling interest 512 (145) 404 50 Net (loss) income attributable to common stockholders (6,001)$ 1,791$ (4,698)$ (563)$ Net (loss) income attributable to common stockholders per share - basic and diluted (0.45)$ 0.14$ (0.35)$ (0.04)$ Weighted average shares outstanding – basic and diluted 13,393 13,147 13,381 13,126 Three Months Ended Nine Months Ended September 30, September 30,
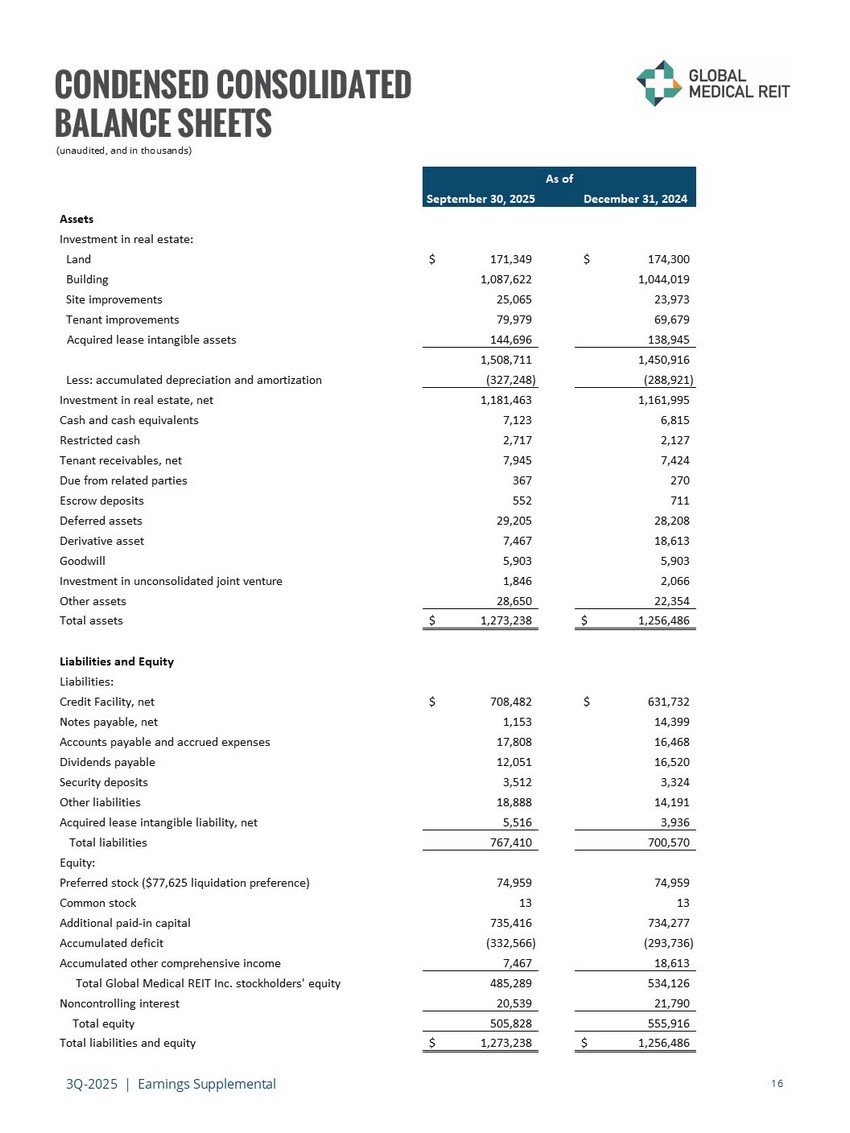
3Q - 2025 | Earnings Supplemental 16 CONDENSED CONSOLIDATED BALANCE SHEETS (unaudited, and in thousands) September 30, 2025 December 31, 2024 Assets Investment in real estate: Land 171,349$ 174,300$ Building 1,087,622 1,044,019 Site improvements 25,065 23,973 Tenant improvements 79,979 69,679 Acquired lease intangible assets 144,696 138,945 1,508,711 1,450,916 Less: accumulated depreciation and amortization (327,248) (288,921) Investment in real estate, net 1,181,463 1,161,995 Cash and cash equivalents 7,123 6,815 Restricted cash 2,717 2,127 Tenant receivables, net 7,945 7,424 Due from related parties 367 270 Escrow deposits 552 711 Deferred assets 29,205 28,208 Derivative asset 7,467 18,613 Goodwill 5,903 5,903 Investment in unconsolidated joint venture 1,846 2,066 Other assets 28,650 22,354 Total assets 1,273,238$ 1,256,486$ Liabilities and Equity Liabilities: Credit Facility, net 708,482$ 631,732$ Notes payable, net 1,153 14,399 Accounts payable and accrued expenses 17,808 16,468 Dividends payable 12,051 16,520 Security deposits 3,512 3,324 Other liabilities 18,888 14,191 Acquired lease intangible liability, net 5,516 3,936 Total liabilities 767,410 700,570 Equity: Preferred stock ($77,625 liquidation preference) 74,959 74,959 Common stock 13 13 Additional paid-in capital 735,416 734,277 Accumulated deficit (332,566) (293,736) Accumulated other comprehensive income 7,467 18,613 Total Global Medical REIT Inc. stockholders' equity 485,289 534,126 Noncontrolling interest 20,539 21,790 Total equity 505,828 555,916 Total liabilities and equity 1,273,238$ 1,256,486$ As of
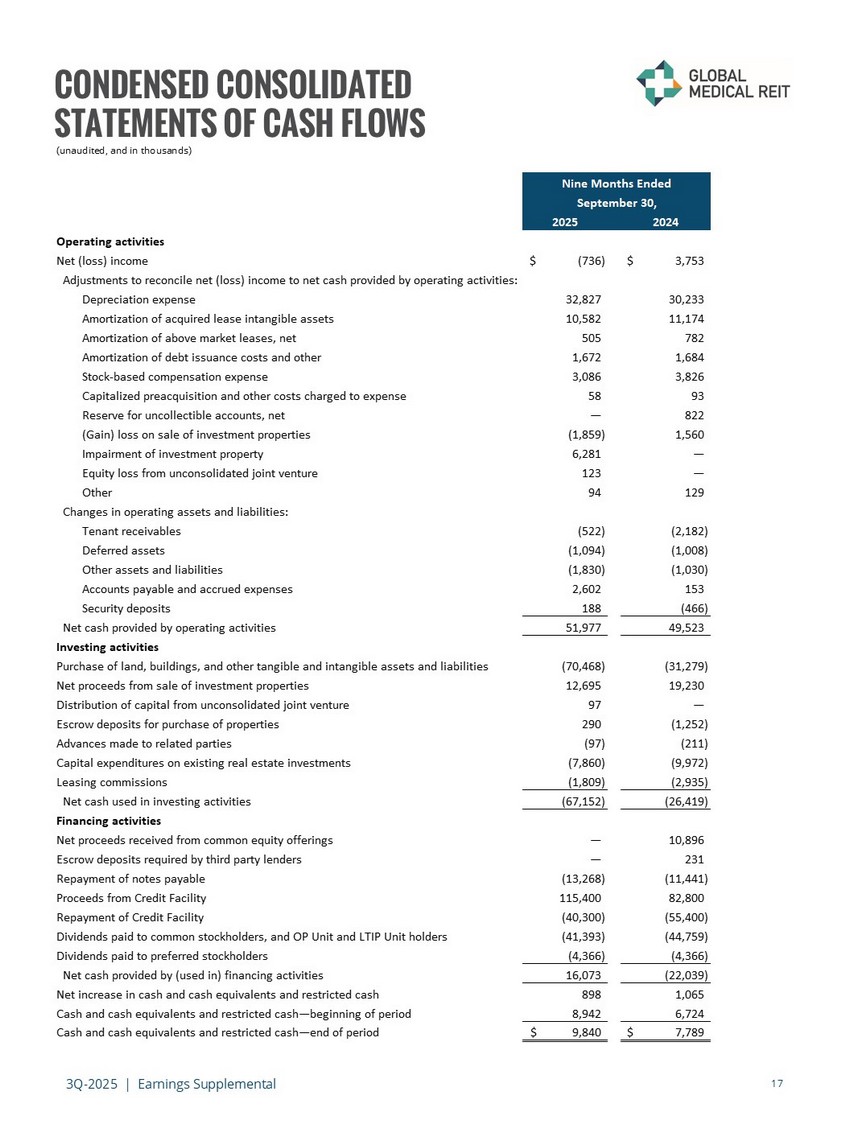
3Q - 2025 | Earnings Supplemental 17 CONDENSED CONSOLIDATED STATEMENTS OF CASH FLOWS (unaudited, and in thousands) 2025 2024 Operating activities Net (loss) income (736)$ 3,753$ Adjustments to reconcile net (loss) income to net cash provided by operating activities: Depreciation expense 32,827 30,233 Amortization of acquired lease intangible assets 10,582 11,174 Amortization of above market leases, net 505 782 Amortization of debt issuance costs and other 1,672 1,684 Stock-based compensation expense 3,086 3,826 Capitalized preacquisition and other costs charged to expense 58 93 Reserve for uncollectible accounts, net — 822 (Gain) loss on sale of investment properties (1,859) 1,560 Impairment of investment property 6,281 — Equity loss from unconsolidated joint venture 123 — Other 94 129 Changes in operating assets and liabilities: Tenant receivables (522) (2,182) Deferred assets (1,094) (1,008) Other assets and liabilities (1,830) (1,030) Accounts payable and accrued expenses 2,602 153 Security deposits 188 (466) Net cash provided by operating activities 51,977 49,523 Investing activities Purchase of land, buildings, and other tangible and intangible assets and liabilities (70,468) (31,279) Net proceeds from sale of investment properties 12,695 19,230 Distribution of capital from unconsolidated joint venture 97 — Escrow deposits for purchase of properties 290 (1,252) Advances made to related parties (97) (211) Capital expenditures on existing real estate investments (7,860) (9,972) Leasing commissions (1,809) (2,935) Net cash used in investing activities (67,152) (26,419) Financing activities Net proceeds received from common equity offerings — 10,896 Escrow deposits required by third party lenders — 231 Repayment of notes payable (13,268) (11,441) Proceeds from Credit Facility 115,400 82,800 Repayment of Credit Facility (40,300) (55,400) Dividends paid to common stockholders, and OP Unit and LTIP Unit holders (41,393) (44,759) Dividends paid to preferred stockholders (4,366) (4,366) Net cash provided by (used in) financing activities 16,073 (22,039) Net increase in cash and cash equivalents and restricted cash 898 1,065 Cash and cash equivalents and restricted cash—beginning of period 8,942 6,724 Cash and cash equivalents and restricted cash—end of period 9,840$ 7,789$ Nine Months Ended September 30,
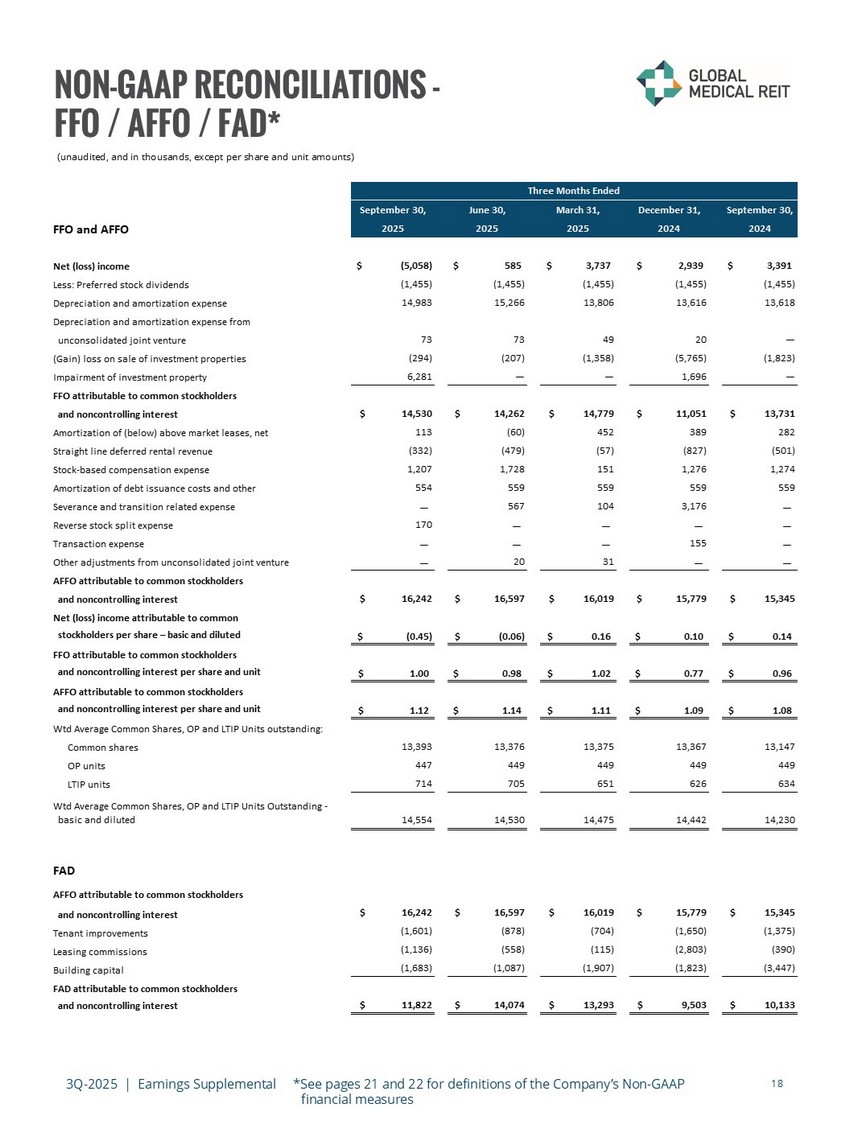
NON - GAAP RECONCILIATIONS - FFO / AFFO / FAD* 3Q - 2025 | Earnings Supplemental *See pages 21 and 22 for definitions of the Company’s Non - GAAP financial measures 18 (unaudited, and in thousands, except per share and unit amounts) September 30, June 30, March 31, December 31, September 30, 2025 2025 2025 2024 2024 Net (loss) income (5,058)$ 585$ 3,737$ 2,939$ 3,391$ Less: Preferred stock dividends (1,455) (1,455) (1,455) (1,455) (1,455) Depreciation and amortization expense 14,983 15,266 13,806 13,616 13,618 Depreciation and amortization expense from unconsolidated joint venture 73 73 49 20 — (Gain) loss on sale of investment properties (294) (207) (1,358) (5,765) (1,823) Impairment of investment property 6,281 — — 1,696 — FFO attributable to common stockholders and noncontrolling interest $ 14,530 $ 14,262 $ 14,779 $ 11,051 $ 13,731 Amortization of (below) above market leases, net 113 (60) 452 389 282 Straight line deferred rental revenue (332) (479) (57) (827) (501) Stock-based compensation expense 1,207 1,728 151 1,276 1,274 Amortization of debt issuance costs and other 554 559 559 559 559 Severance and transition related expense — 567 104 3,176 — Reverse stock split expense 170 — — — — Transaction expense — — — 155 — Other adjustments from unconsolidated joint venture — 20 31 — — AFFO attributable to common stockholders and noncontrolling interest $ 16,242 $ 16,597 $ 16,019 $ 15,779 $ 15,345 Net (loss) income attributable to common stockholders per share – basic and diluted (0.45)$ (0.06)$ 0.16$ 0.10$ 0.14$ FFO attributable to common stockholders and noncontrolling interest per share and unit 1.00$ 0.98$ 1.02$ 0.77$ 0.96$ AFFO attributable to common stockholders and noncontrolling interest per share and unit 1.12$ 1.14$ 1.11$ 1.09$ 1.08$ Wtd Average Common Shares, OP and LTIP Units outstanding: Common shares 13,393 13,376 13,375 13,367 13,147 OP units 447 449 449 449 449 LTIP units 714 705 651 626 634 Wtd Average Common Shares, OP and LTIP Units Outstanding - basic and diluted 14,554 14,530 14,475 14,442 14,230 FAD AFFO attributable to common stockholders and noncontrolling interest $ 16,242 $ 16,597 $ 16,019 $ 15,779 $ 15,345 Tenant improvements (1,601) (878) (704) (1,650) (1,375) Leasing commissions (1,136) (558) (115) (2,803) (390) Building capital (1,683) (1,087) (1,907) (1,823) (3,447) FAD attributable to common stockholders and noncontrolling interest $ 11,822 $ 14,074 $ 13,293 $ 9,503 $ 10,133 Three Months Ended FFO and AFFO
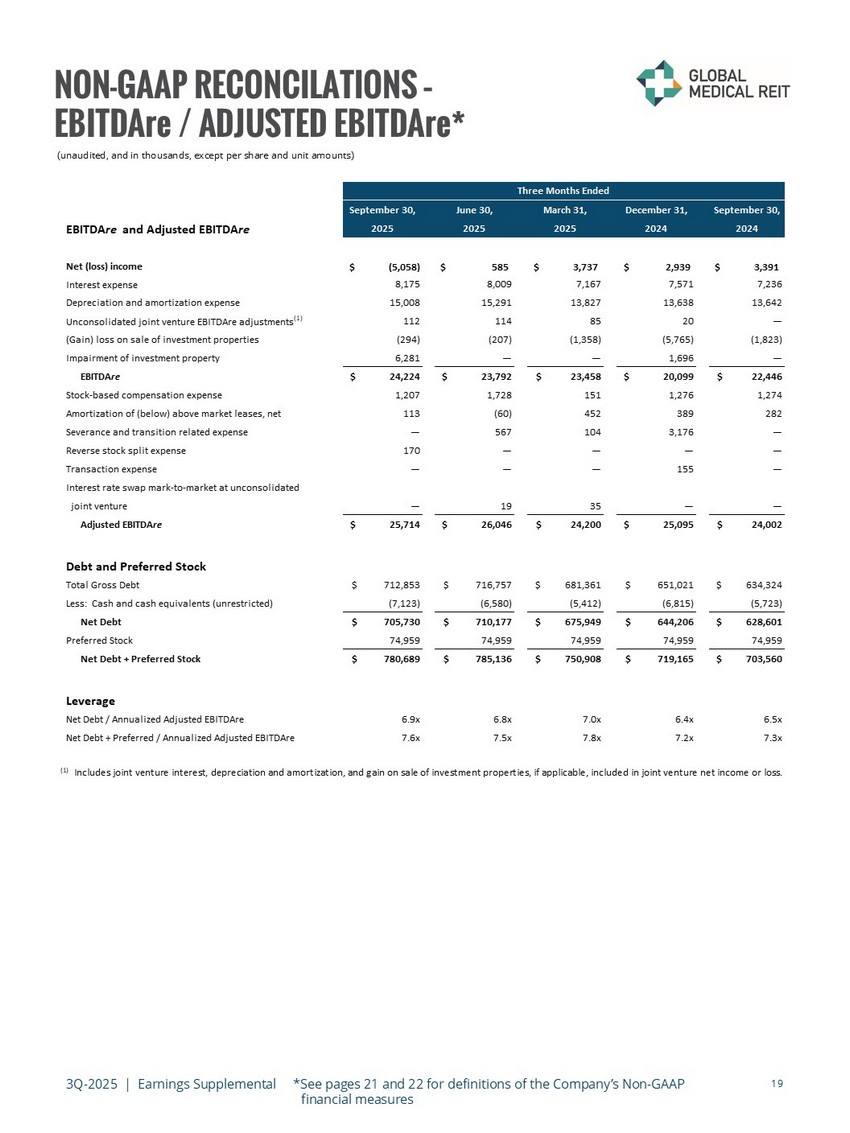
3Q - 2025 | Earnings Supplemental *See pages 21 and 22 for definitions of the Company’s Non - GAAP financial measures 19 NON - GAAP RECONCILATIONS – EBITDAre / ADJUSTED EBITDAre * (unaudited, and in thousands, except per share and unit amounts) (1) Includes joint venture interest, depreciation and amortization, and gain on sale of investment properties, if applicable, inc lud ed in joint venture net income or loss. September 30, June 30, March 31, December 31, September 30, EBITDAre and Adjusted EBITDAre 2025 2025 2025 2024 2024 Net (loss) income (5,058)$ 585$ 3,737$ 2,939$ 3,391$ Interest expense 8,175 8,009 7,167 7,571 7,236 Depreciation and amortization expense 15,008 15,291 13,827 13,638 13,642 Unconsolidated joint venture EBITDAre adjustments (1) 112 114 85 20 — (Gain) loss on sale of investment properties (294) (207) (1,358) (5,765) (1,823) Impairment of investment property 6,281 — — 1,696 — EBITDAre $ 24,224 $ 23,792 $ 23,458 $ 20,099 $ 22,446 Stock-based compensation expense 1,207 1,728 151 1,276 1,274 Amortization of (below) above market leases, net 113 (60) 452 389 282 Severance and transition related expense — 567 104 3,176 — Reverse stock split expense 170 — — — — Transaction expense — — — 155 — Interest rate swap mark-to-market at unconsolidated joint venture — 19 35 — — Adjusted EBITDAre $ 25,714 $ 26,046 $ 24,200 $ 25,095 $ 24,002 Debt and Preferred Stock Total Gross Debt $ 712,853 $ 716,757 $ 681,361 $ 651,021 $ 634,324 Less: Cash and cash equivalents (unrestricted) (7,123) (6,580) (5,412) (6,815) (5,723) Net Debt $ 705,730 $ 710,177 $ 675,949 $ 644,206 $ 628,601 Preferred Stock 74,959 74,959 74,959 74,959 74,959 Net Debt + Preferred Stock $ 780,689 $ 785,136 $ 750,908 $ 719,165 $ 703,560 Leverage Net Debt / Annualized Adjusted EBITDAre 6.9x 6.8x 7.0x 6.4x 6.5x Net Debt + Preferred / Annualized Adjusted EBITDAre 7.6x 7.5x 7.8x 7.2x 7.3x Three Months Ended
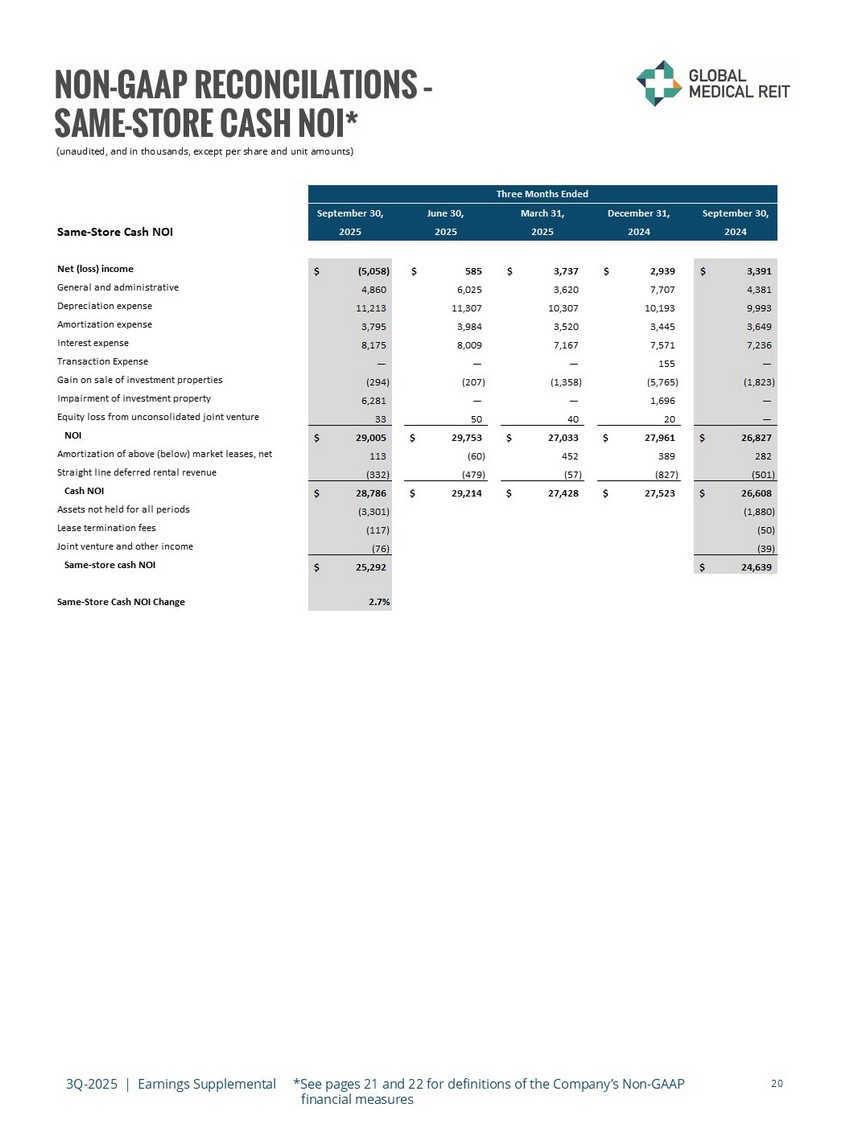
3Q - 2025 | Earnings Supplemental *See pages 21 and 22 for definitions of the Company’s Non - GAAP financial measures 20 NON - GAAP RECONCILATIONS – SAME - STORE CASH NOI* (unaudited, and in thousands, except per share and unit amounts) September 30, June 30, March 31, December 31, September 30, Same-Store Cash NOI 2025 2025 2025 2024 2024 Net (loss) income (5,058)$ 585$ 3,737$ 2,939$ 3,391$ General and administrative 4,860 6,025 3,620 7,707 4,381 Depreciation expense 11,213 11,307 10,307 10,193 9,993 Amortization expense 3,795 3,984 3,520 3,445 3,649 Interest expense 8,175 8,009 7,167 7,571 7,236 Transaction Expense — — — 155 — Gain on sale of investment properties (294) (207) (1,358) (5,765) (1,823) Impairment of investment property 6,281 — — 1,696 — Equity loss from unconsolidated joint venture 33 50 40 20 — NOI 29,005$ 29,753$ 27,033$ 27,961$ 26,827$ Amortization of above (below) market leases, net 113 (60) 452 389 282 Straight line deferred rental revenue (332) (479) (57) (827) (501) Cash NOI 28,786$ 29,214$ 27,428$ 27,523$ 26,608$ Assets not held for all periods (3,301) (1,880) Lease termination fees (117) (50) Joint venture and other income (76) (39) Same-store cash NOI 25,292$ 24,639$ Same-Store Cash NOI Change 2.7% Three Months Ended
3Q - 2025 | Earnings Supplemental 21 REPORTING DEFINITIONS AND OTHER DISCLOSURES Annualized Base Rent Annualized base rent represents monthly base rent for September 2025 (or, for recent acquisitions, monthly base rent for the month of acquisition), multiplied by 12 (or base rent net of annualized expenses for properties with gross leases). Accordingly, this methodology produces an annualized amount as of a point in time but does not take into account future ( i ) contractual rental rate increases, (ii) leasing activity or (iii) lease expirations. Additionally, leases that are accounte d f or on a cash - collected basis, or that are in a free rent period, are not included in annualized base rent. Capitalization Rate The capitalization rate (“Cap Rate”) for an acquisition is calculated by dividing current Annualized Base Rent by contractual purchase price. For the portfolio cap rate, certain adjustments, including for subsequent capital invested, are made to the contractual purchase price. Funds from Operations Attributable to Common Stockholders and Noncontrolling Interest and Adjusted Funds from Operations Attributable to Common Stockholders and Noncontrolling Interest Funds from operations attributable to common stockholders and noncontrolling interest (“FFO”) and adjusted funds from operations attributable to common stockholders and noncontrolling interest (“AFFO”) are non - GAAP financial measures within the meaning of the rules of the SEC. The Company considers FFO and AFFO to be important supplemental measures of its operating performance and believes FFO is frequently used by securities analysts, investors, and other interested parties in the evaluation of REITs, many of which present FFO when reporting their results. In accordance with the National Association of Real Estate Investment Trusts’ (“NAREIT”) definition, FFO means net income or loss computed in accordance with GAAP before noncontrolling interests of holders of OP units and LTIP units, excluding gains (or losses) from sales of property and extraordinary items, property impairment losses, less preferred stock dividends, plus real estate - related depreciation and amortization (excluding amortization of debt issuance costs and the amortization of above and below market leases), and after adjustments for unconsolidated partnerships and joint ventures calculated to reflect FFO on the same basis. Because FFO excludes real estate - related depreciation and amortization (other than amortization of debt issuance costs and above and below market lease amortization expense), the Company believes that FFO provides a performance measure that, when compared period - over - period, reflects the impact to operations from trends in occupancy rates, rental rates, operating costs, development activities and interest costs, providing perspective not immediately apparent from the closest GAAP measurement, net income or loss. AFFO is a non - GAAP measure used by many investors and analysts to measure a real estate company’s operating performance by removing the effect of items that do not reflect ongoing property operations. Management calculates AFFO by modifying the NAREIT computation of FFO by adjusting it for certain cash and non - cash items and certain recurring and non - recurring items. For the Company these items include: (a) recurring acquisition and disposition costs, (b) loss on the extinguishment of debt, (c) recurring straight line deferred rental revenue, (d) recurring stock - based compensation expense, (e) recurring amortization of above and below market leases, (f) recurring amortization of debt issuance costs, (g) severance and transition related expense, (h) reverse stock split expense, ( i ) transaction expense and (j) other items related to unconsolidated partnerships and joint ventures. Management believes that reporting AFFO in addition to FFO is a useful supplemental measure for the investment community to use when evaluating the operating performance of the Company on a comparative basis. Funds Available for Distribution Attributable to Common Stockholders and Noncontrolling Interest We calculate funds available for distribution attributable to common stockholders and noncontrolling interest (“FAD”) by subtracting from AFFO capital expenditures, including tenant improvements, and leasing commissions. Management believes FAD is useful in analyzing the portion of cash flow that is available for distribution to stockholders and unitholders. Investors, analysts and the Company utilize FAD as an indicator of common dividend potential.
3Q - 2025 | Earnings Supplemental 22 REPORTING DEFINITIONS AND OTHER DISCLOSURES Earnings Before Interest, Taxes, Depreciation and Amortization for Real Estate (“ EBITDAre ” and “Adjusted EBITDAre ”) We calculate EBITDAre in accordance with standards established by NAREIT and define EBITDAre as net income or loss computed in accordance with GAAP plus depreciation and amortization, interest expense, gain or loss on the sale of investment properties, property impairment losses, and adjustments for unconsolidated partnerships and joint ventures, to reflect EBITDAre on the same basis, as applicable. We define Adjusted EBITDAre as EBITDAre plus loss on extinguishment of debt, non - cash stock compensation expense, non - cash intangible amortization related to above and below market leases, severance and transition related expense, reverse stock split expense, transaction expense, adjustments related to our investment in unconsolidated joint ventures, and other normalizing items. Management considers EBITDAre and Adjusted EBITDAre important measures because they provide additional information to allow management, investors, and our current and potential creditors to evaluate and compare our core operating results and our ability to service debt. NOI, Cash NOI and Same - Store Cash NOI We consider net operating income, or NOI, to be an appropriate supplemental measure to net income because it helps both investors and management understand the core operations of our properties. We define NOI as total net (loss) income, plus depreciation and amortization expenses, general and administrative expenses, transaction expenses, impairments, gain/loss on sale of real estate, interest expense, and other non - operating items. Cash NOI and Same Store Cash NOI are key performance indicators. Management considers these to be supplemental measures that allow investors, analysts and Company management to measure unlevered property - level cash operating results. The Company defines Cash NOI as NOI excluding non - cash items such as above and below market lease intangibles and straight - line rent. Cash NOI is historical and not necessarily indicative of future results. Same Store Cash NOI compares Cash NOI for stabilized properties. Stabilized properties are properties that have been included in operations for the duration of the year - over - year comparison period presented. Accordingly, stabilized properties exclude properties that were recently acquired or disposed of, properties classified as held for sale, properties undergoing redevelopment, and newly redeveloped or developed properties. Same Store Cash NOI also excludes lease terminations fees and joint venture and other income in order to remove non - recurring items and joint venture - related income from our NOI. Other Disclosures Non - GAAP Financial Measures Management considers certain non - GAAP financial measures to be useful supplemental measures of the Company's operating performance. For the Company, non - GAAP measures consist of FFO attributable to common stockholders and noncontrolling interest, AFFO attributable to common stockholders and noncontrolling interest, FAD attributable to common stockholders and noncontrolling interest, EBITDAre and Adjusted EBITDAre , Net Operating Income (“NOI”), cash NOI and same - store cash NOI. A non - GAAP financial measure is generally defined as one that purports to measure financial performance, financial position or cash flows, but excludes or includes amounts that would not be so adjusted in the most comparable measure determined in accordance with GAAP. The Company reports non - GAAP financial measures because these measures are observed by management to also be among the most predominant measures used by the REIT industry and by industry analysts to evaluate REITs. For these reasons, management deems it appropriate to disclose and discuss these non - GAAP financial measures. The non - GAAP financial measures presented herein are not necessarily identical to those presented by other real estate companies due to the fact that not all real estate companies use the same definitions. These measures should not be considered as alternatives to net income, as indicators of the Company's financial performance, or as alternatives to cash flow from operating activities as measures of the Company's liquidity, nor are these measures necessarily indicative of sufficient cash flow to fund all of the Company's needs. Management believes that in order to facilitate a clear understanding of the Company's historical consolidated operating results, these measures should be examined in conjunction with net income and cash flows from operations as presented elsewhere herein.
3Q - 2025 | Earnings Supplemental 23 REPORTING DEFINITIONS AND OTHER DISCLOSURES Additional Information The information in this document should be read in conjunction with the Company’s Annual Report on Form 10 - K, Quarterly Reports on Form 10 - Q, Current Reports on Form 8 - K, and other information filed with, or furnished to, the SEC. You can access the Company’s reports and amendments to those reports filed or furnished to the SEC pursuant to Section 13(a) or 15(d) of the Exchange Act in the “Investor Relations” section on the Company’s website (www.globalmedicalreit.com) under “SEC Filings” as soon as reasonably practicable after they are filed with, or furnished to, the SEC. The information on or connected to the Company’s website is not, and shall not be deemed to be, a part of, or incorporated into, this Earnings Supplemental. You also can review these SEC filings and other information by accessing the SEC’s website at http://www.sec.gov . Certain information contained in this package, including, but not limited to, information contained in our key tenants profiles is derived from publicly - available third - party sources. The Company has not independently verified this information and there can be no assurance that such information is accurate or complete.

INVESTOR RELATIONS globalmedicalreit.com NYSE: GMRE Contact: investors@globalmedicalreit.com 202.524.6869