Exhibit 99.1
www.globalmedicalreit.com Capital Partners to Health Care Providers INVESTOR PRESENTATION November 13, 2017
www.globalmedicalreit.com DISCLAIMER 2 This presentation is for informational purposes only and does not constitute an offer to sell, or a solicitation of offers to purchase, Global Medical REIT Inc . (the “Company’s” ; or “GMR’s”) securities . The information contained in this presentation does not purport to be complete and should not be relied upon as a basis for making an investment decision in the Company’s securities . This presentation also contains statements that, to the extent they are not recitations of historical fact, constitute “forward - looking statements . ” Forward - looking statements are typically identified by the use of terms such as “may,” “should,” “expect,” “could,” “intend,” “plan,” “anticipate,” “estimate,” “believe,” “continue,” “predict,” “potential” or the negative of such terms and other comparable terminology . The forward - looking statements included herein are based upon the Company’s current expectations, plans, estimates, assumptions and beliefs that involve numerous risks and uncertainties . Assumptions relating to the foregoing involve judgments with respect to, among other things, future economic, competitive and market conditions and future business decisions, all of which are difficult or impossible to predict accurately and many of which are beyond the Company’s control . Although the Company believes that the expectations reflected in such forward - looking statements are based on reasonable assumptions, the Company’s actual results and performance could differ materially from those set forth in the forward - looking statements due to the impact of many factors including, but not limited to, those discussed under “Risk Factors” in the Company’s Annual Report on Form 10 - K/A filed with the Securities and Exchange Commission on May 5 , 2017 and Quarterly Reports on Form 10 - Q and any prospectus or prospectus supplement filed with the Securities and Exchange Commission . The Company undertakes no obligation to update or revise any such information for any reason after the date of this presentation, unless required by law .
www.globalmedicalreit.com AT A GLANCE ▪ Well - positioned to execute on pipeline acquisitions using revolving credit facility ▪ Addition of recently - announced ATM program provides acquisition financing optionality STOCK INFORMATION * 3 BALANCE SHEET HIGHLIGHTS • Market Capitalization: $200.7 million • Common shares outstanding: 21.6 million • Series A preferred shares outstanding: $75 million, 7.50% * Data is as of November 10, 2017 KEY BUSINESS POINTS • $441 million gross investment • Healthcare REIT focused on the acquisition and sale - leaseback of healthcare facilities • Substantial pipeline of high quality, purpose - built facilities • Experienced management with deep relationships in sector • Attractive industry tailwinds, recession - resistant asset class
www.globalmedicalreit.com LEADERSHIP 4 ▪ Over 30 years of experience in financial accounting, reporting and management, including extensive experience in SEC reportin g a nd Sarbanes - Oxley compliance ▪ Served as the Senior Vice President, Controller and Chief Accounting Officer of FBR & Co. (“FBR” NASDAQ: FBRC) beginning in O cto ber 2007 ▪ Prior role as Senior Vice President, Controller and Chief Accounting Officer of Arlington Asset Investment Corp. (NYSE: AI) ▪ Previously Senior Manager in the assurance practice at Ernst & Young ▪ Over 17 years of experience in real estate finance and has completed $ 3 billion of transactions ▪ Prior experience as principal at investment advisor to pension funds and investment banker representing healthcare systems, developers and REITs ▪ Healthcare real estate investment banker for Cain Brothers DANICA HOLLEY, Chief Operating Officer ALFONZO LEON , Chief Investment Officer ▪ Over 20 years of experience in healthcare, real estate development, management and investment ▪ Former assistant to the U.S. Secretary of Housing & Urban Development ▪ United States Special Representative to United Nations in Geneva ▪ Developed large - scale residential, commercial, hospitality and retail properties ▪ Management and business development experience spans more than 18 years ▪ More than a decade of experience managing multinational teams for complex service delivery across disciplines ▪ More than 8 years in healthcare programs and infrastructure as Executive Director of Safe Blood International ROBERT KIERNAN , Chief Financial Officer and Treasurer JEFFREY BUSCH , Chairman, Chief Executive Officer and President JAMIE BARBER, General Counsel and Corporate Secretary ALLEN WEBB, Senior Vice President, SEC Reporting and Technical Accounting ▪ Over 25 years of experience in SEC reporting and compliance ▪ Previously worked within the SEC’s Division of Corporation Finance, Real Estate industry group. ▪ Previously served as manager in the assurance practice of Arthur Andersen, focused primarily on Real Estate industry clients ▪ More than a decade of experience with SEC compliance and reporting matters, corporate governance, investment banking and REIT - re lated capital markets ▪ Served as Associate General Counsel of FBR (NASDAQ: FBRC) beginning in July 2012 ▪ Prior role as Senior Associate – REIT Capital Markets at Hunton & Williams LLP, where he represented public REITs in conjunction with their SEC compliance requirements, corporate governance matters, offerings of equity and debt securities and merger and acquisition transactions ▪ Previously with Sullivan & Cromwell LLP and KPMG
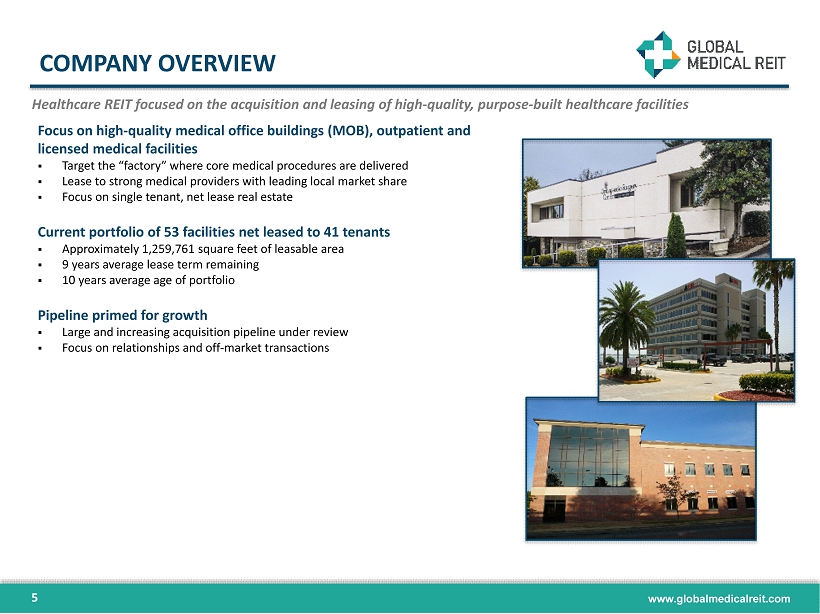
www.globalmedicalreit.com COMPANY OVERVIEW 5 Healthcare REIT focused on the acquisition and leasing of high - quality, purpose - built healthcare facilities Focus on high - quality medical office buildings (MOB), outpatient and licensed medical facilities ▪ Target the “factory” where core medical procedures are delivered ▪ Lease to strong medical providers with leading local market share ▪ Focus on single tenant, net lease real estate Current portfolio of 53 facilities net leased to 41 tenants ▪ Approximately 1,259,761 square feet of leasable area ▪ 9 years average lease term remaining ▪ 10 years average age of portfolio Pipeline primed for growth ▪ Large and increasing acquisition pipeline under review ▪ Focus on relationships and off - market transactions
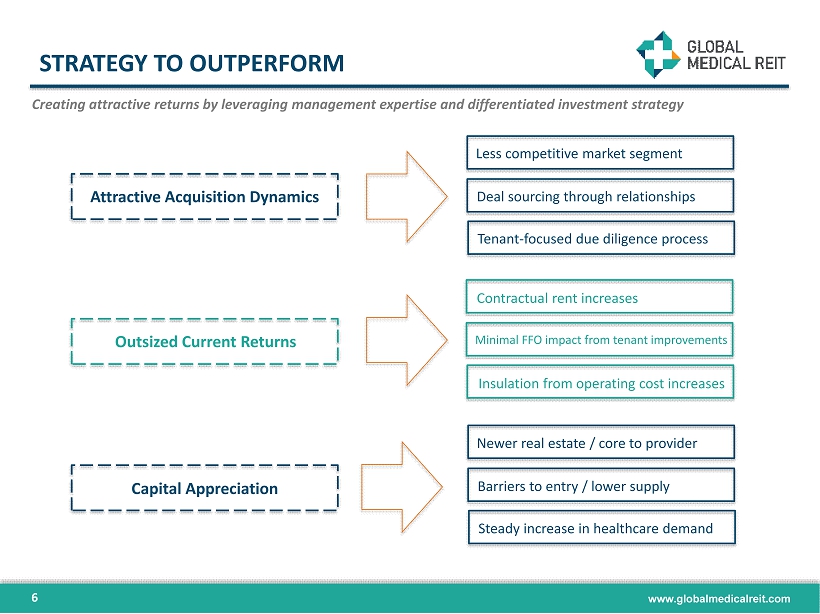
www.globalmedicalreit.com STRATEGY TO OUTPERFORM 6 Creating attractive returns by leveraging management expertise and differentiated investment strategy Attractive Acquisition Dynamics Outsized Current Returns Capital Appreciation Less competitive market segment Deal sourcing through relationships Tenant - focused due diligence process Contractual rent increases Minimal FFO impact from tenant improvements Insulation from operating cost increases Newer real estate / core to provider Barriers to entry / lower supply Steady increase in healthcare demand
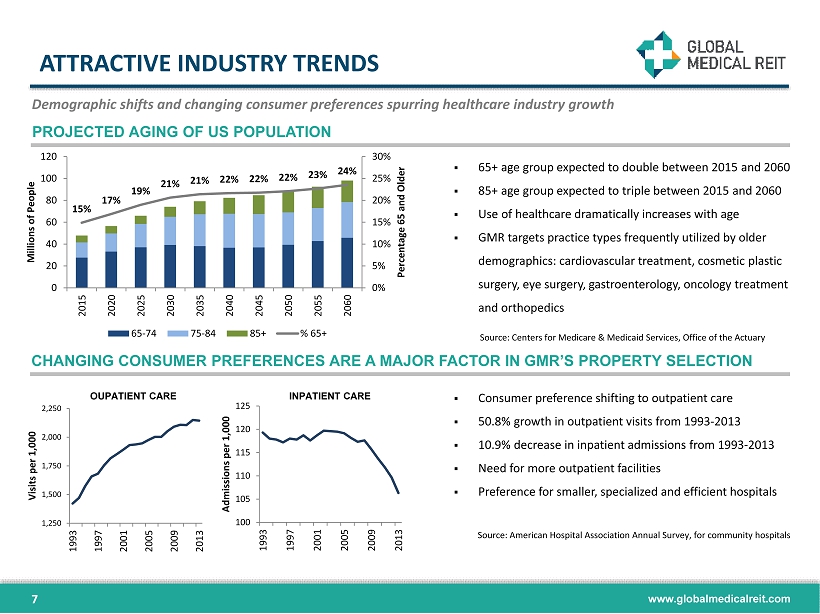
www.globalmedicalreit.com ATTRACTIVE INDUSTRY TRENDS 7 PROJECTED AGING OF US POPULATION CHANGING CONSUMER PREFERENCES ARE A MAJOR FACTOR IN GMR’S PROPERTY SELECTION 15% 17% 19% 21% 21% 22% 22% 22% 23% 24% 0% 5% 10% 15% 20% 25% 30% 0 20 40 60 80 100 120 2015 2020 2025 2030 2035 2040 2045 2050 2055 2060 Percentage 65 and Older Millions of People 65-74 75-84 85+ % 65+ ▪ 65+ age group expected to double between 2015 and 2060 ▪ 85+ age group expected to triple between 2015 and 2060 ▪ Use of healthcare dramatically increases with age ▪ GMR targets practice types frequently utilized by older demographics: cardiovascular treatment, cosmetic plastic surgery, eye surgery, gastroenterology, oncology treatment and orthopedics Source: Centers for Medicare & Medicaid Services, Office of the Actuary 1,250 1,500 1,750 2,000 2,250 1993 1997 2001 2005 2009 2013 Visits per 1,000 100 105 110 115 120 125 1993 1997 2001 2005 2009 2013 Admissions per 1,000 OUPATIENT CARE INPATIENT CARE Demographic shifts and changing consumer preferences spurring healthcare industry growth ▪ Consumer preference shifting to outpatient care ▪ 50.8% growth in outpatient visits from 1993 - 2013 ▪ 10.9% decrease in inpatient admissions from 1993 - 2013 ▪ Need for more outpatient facilities ▪ Preference for smaller, specialized and efficient hospitals Source: American Hospital Association Annual Survey, for community hospitals
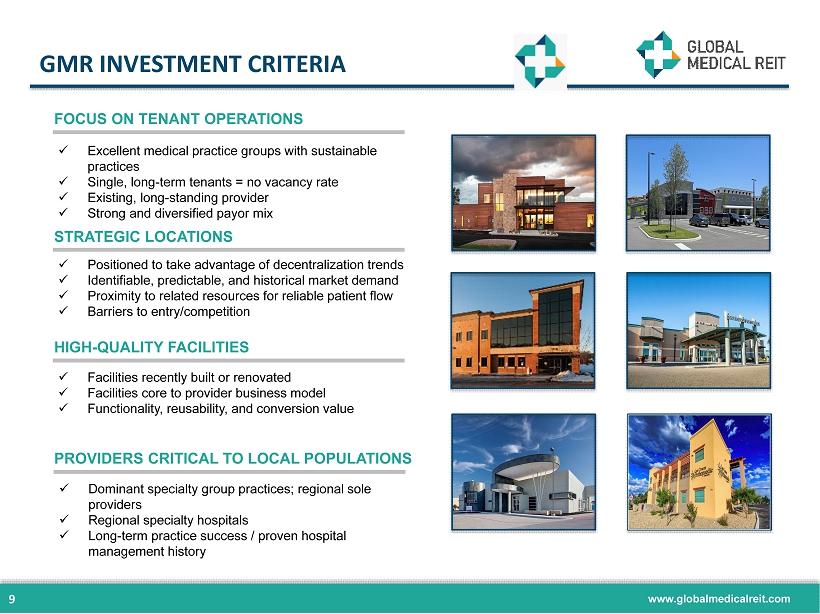
www.globalmedicalreit.com GMR INVESTMENT CRITERIA 9 HIGH - QUALITY FACILITIES x Facilities recently built or renovated x Facilities core to provider business model x Functionality, reusability, and conversion value FOCUS ON TENANT OPERATIONS x Excellent medical practice groups with sustainable practices x Single, long - term tenants = no vacancy rate x Existing, long - standing provider x Strong and diversified payor mix STRATEGIC LOCATIONS x Positioned to take advantage of decentralization trends x Identifiable, predictable, and historical market demand x Proximity to related resources for reliable patient flow x Barriers to entry/competition x Dominant specialty group practices; regional sole providers x Regional specialty hospitals x Long - term practice success / proven hospital management history PROVIDERS CRITICAL TO LOCAL POPULATIONS
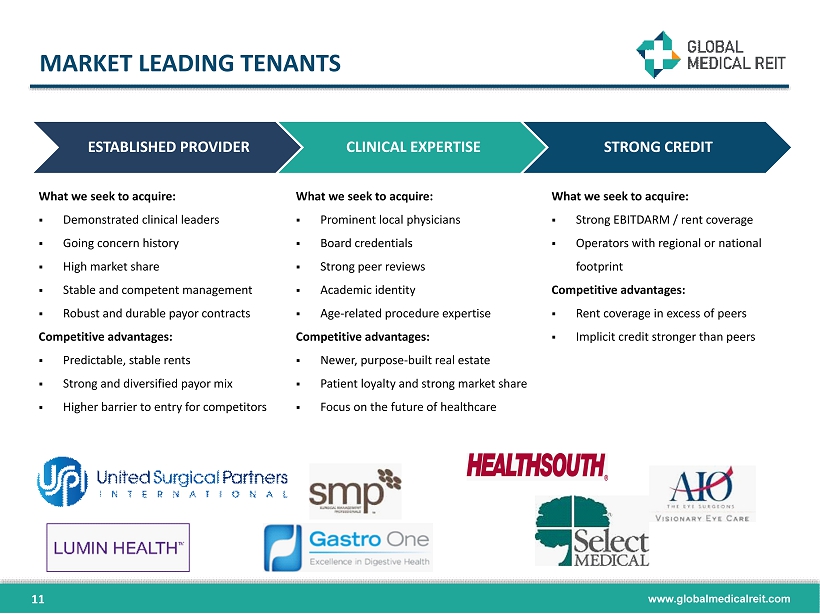
www.globalmedicalreit.com MARKET LEADING TENANTS ESTABLISHED PROVIDER CLINICAL EXPERTISE STRONG CREDIT 11 What we seek to acquire: ▪ Demonstrated clinical leaders ▪ Going concern history ▪ High market share ▪ Stable and competent management ▪ Robust and durable payor contracts Competitive advantages: ▪ Predictable, stable rents ▪ Strong and diversified payor mix ▪ Higher barrier to entry for competitors What we seek to acquire: ▪ Prominent local physicians ▪ Board credentials ▪ Strong peer reviews ▪ Academic identity ▪ Age - related procedure expertise Competitive advantages: ▪ Newer, purpose - built real estate ▪ Patient loyalty and strong market share ▪ Focus on the future of healthcare What we seek to acquire: ▪ Strong EBITDARM / rent coverage ▪ Operators with regional or national footprint Competitive advantages: ▪ Rent coverage in excess of peers ▪ Implicit credit stronger than peers
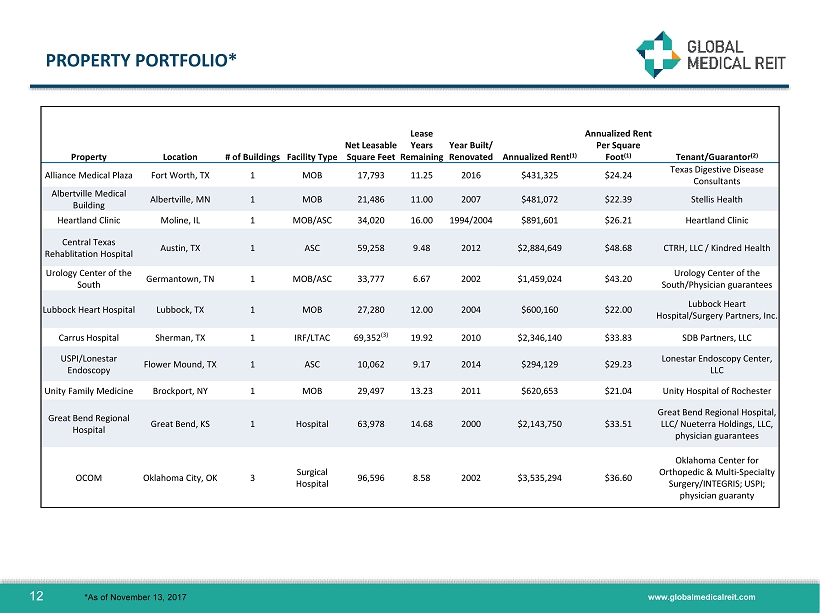
www.globalmedicalreit.com PROPERTY PORTFOLIO* 11 *As of November 13, 2017 12 Property Location # of Buildings Facility Type Net Leasable Square Feet Lease Years Remaining Year Built/ Renovated Annualized Rent (1) Annualized Rent Per Square Foot (1) Tenant/Guarantor (2) Alliance Medical Plaza Fort Worth, TX 1 MOB 17,793 11.25 2016 $431,325 $24.24 Texas Digestive Disease Consultants Albertville Medical Building Albertville, MN 1 MOB 21,486 11.00 2007 $481,072 $22.39 Stellis Health Heartland Clinic Moline, IL 1 MOB/ASC 34,020 16.00 1994/2004 $891,601 $26.21 Heartland Clinic Central Texas Rehablitation Hospital Austin, TX 1 ASC 59,258 9.48 2012 $2,884,649 $48.68 CTRH, LLC / Kindred Health Urology Center of the South Germantown, TN 1 MOB/ASC 33,777 6.67 2002 $1,459,024 $43.20 Urology Center of the South/Physician guarantees Lubbock Heart Hospital Lubbock, TX 1 MOB 27,280 12.00 2004 $600,160 $22.00 Lubbock Heart Hospital/Surgery Partners, Inc. Carrus Hospital Sherman, TX 1 IRF/LTAC 69,352 (3) 19.92 2010 $2,346,140 $33.83 SDB Partners, LLC USPI/Lonestar Endoscopy Flower Mound, TX 1 ASC 10,062 9.17 2014 $294,129 $29.23 Lonestar Endoscopy Center, LLC Unity Family Medicine Brockport, NY 1 MOB 29,497 13.23 2011 $620,653 $21.04 Unity Hospital of Rochester Great Bend Regional Hospital Great Bend, KS 1 Hospital 63,978 14.68 2000 $2,143,750 $33.51 Great Bend Regional Hospital, LLC/ Nueterra Holdings, LLC, physician guarantees OCOM Oklahoma City, OK 3 Surgical Hospital 96,596 8.58 2002 $3,535,294 $36.60 Oklahoma Center for Orthopedic & Multi - Specialty Surgery/INTEGRIS; USPI; physician guaranty
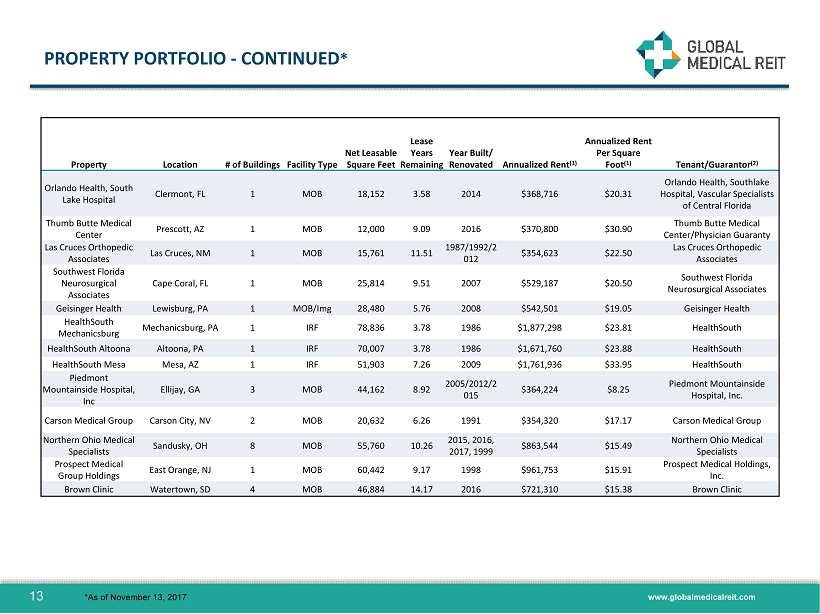
www.globalmedicalreit.com PROPERTY PORTFOLIO - CONTINUED * 12 *As of November 13, 2017 13 Property Location # of Buildings Facility Type Net Leasable Square Feet Lease Years Remaining Year Built/ Renovated Annualized Rent (1) Annualized Rent Per Square Foot (1) Tenant/Guarantor (2) Orlando Health, South Lake Hospital Clermont, FL 1 MOB 18,152 3.58 2014 $368,716 $20.31 Orlando Health, Southlake Hospital, Vascular Specialists of Central Florida Thumb Butte Medical Center Prescott, AZ 1 MOB 12,000 9.09 2016 $370,800 $30.90 Thumb Butte Medical Center/Physician Guaranty Las Cruces Orthopedic Associates Las Cruces, NM 1 MOB 15,761 11.51 1987/1992/2 012 $354,623 $22.50 Las Cruces Orthopedic Associates Southwest Florida Neurosurgical Associates Cape Coral, FL 1 MOB 25,814 9.51 2007 $529,187 $20.50 Southwest Florida Neurosurgical Associates Geisinger Health Lewisburg, PA 1 MOB/Img 28,480 5.76 2008 $542,501 $19.05 Geisinger Health HealthSouth Mechanicsburg Mechanicsburg, PA 1 IRF 78,836 3.78 1986 $1,877,298 $23.81 HealthSouth HealthSouth Altoona Altoona, PA 1 IRF 70,007 3.78 1986 $1,671,760 $23.88 HealthSouth HealthSouth Mesa Mesa, AZ 1 IRF 51,903 7.26 2009 $1,761,936 $33.95 HealthSouth Piedmont Mountainside Hospital, Inc Ellijay, GA 3 MOB 44,162 8.92 2005/2012/2 015 $364,224 $8.25 Piedmont Mountainside Hospital, Inc. Carson Medical Group Carson City, NV 2 MOB 20,632 6.26 1991 $354,320 $17.17 Carson Medical Group Northern Ohio Medical Specialists Sandusky, OH 8 MOB 55,760 10.26 2015, 2016, 2017, 1999 $863,544 $15.49 Northern Ohio Medical Specialists Prospect Medical Group Holdings East Orange, NJ 1 MOB 60,442 9.17 1998 $961,753 $15.91 Prospect Medical Holdings, Inc. Brown Clinic Watertown, SD 4 MOB 46,884 14.17 2016 $721,310 $15.38 Brown Clinic
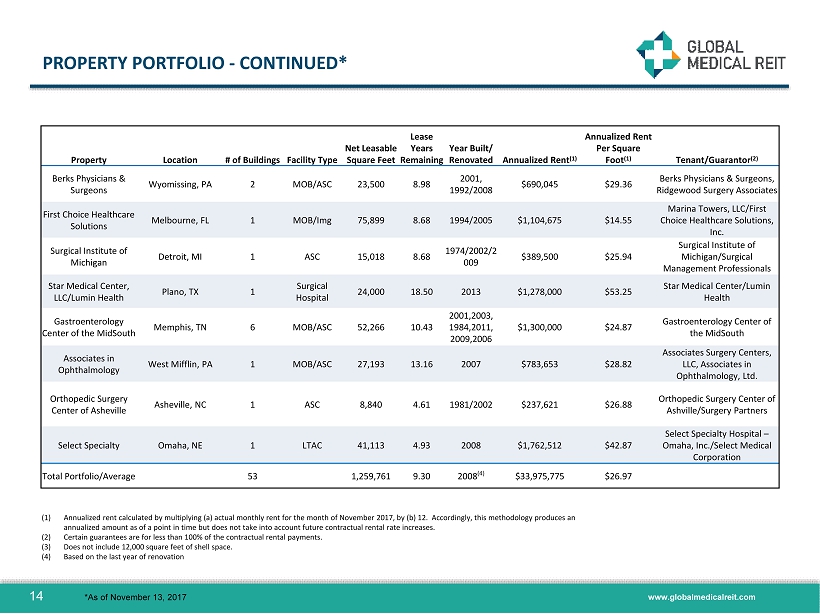
www.globalmedicalreit.com PROPERTY PORTFOLIO - CONTINUED* (1) Annualized rent calculated by multiplying (a) actual monthly rent for the month of November 2017, by (b) 12. Accordingly, this methodology produces an annualized amount as of a point in time but does not take into account future contractual rental rate increases. (2) Certain guarantees are for less than 100% of the contractual rental payments. (3) Does not include 12,000 square feet of shell space. (4) Based on the last year of renovation *As of November 13, 2017 14 Property Location # of Buildings Facility Type Net Leasable Square Feet Lease Years Remaining Year Built/ Renovated Annualized Rent (1) Annualized Rent Per Square Foot (1) Tenant/Guarantor (2) Berks Physicians & Surgeons Wyomissing, PA 2 MOB/ASC 23,500 8.98 2001, 1992/2008 $690,045 $29.36 Berks Physicians & Surgeons, Ridgewood Surgery Associates First Choice Healthcare Solutions Melbourne, FL 1 MOB/Img 75,899 8.68 1994/2005 $1,104,675 $14.55 Marina Towers, LLC/First Choice Healthcare Solutions, Inc. Surgical Institute of Michigan Detroit, MI 1 ASC 15,018 8.68 1974/2002/2 009 $389,500 $25.94 Surgical Institute of Michigan/Surgical Management Professionals Star Medical Center, LLC/Lumin Health Plano, TX 1 Surgical Hospital 24,000 18.50 2013 $1,278,000 $53.25 Star Medical Center/Lumin Health Gastroenterology Center of the MidSouth Memphis, TN 6 MOB/ASC 52,266 10.43 2001,2003, 1984,2011, 2009,2006 $1,300,000 $24.87 Gastroenterology Center of the MidSouth Associates in Ophthalmology West Mifflin, PA 1 MOB/ASC 27,193 13.16 2007 $783,653 $28.82 Associates Surgery Centers, LLC, Associates in Ophthalmology, Ltd. Orthopedic Surgery Center of Asheville Asheville, NC 1 ASC 8,840 4.61 1981/2002 $237,621 $26.88 Orthopedic Surgery Center of Ashville/Surgery Partners Select Specialty Omaha, NE 1 LTAC 41,113 4.93 2008 $1,762,512 $42.87 Select Specialty Hospital – Omaha, Inc./Select Medical Corporation Total Portfolio/Average 53 1,259,761 9.30 2008 (4) $33,975,775 $26.97
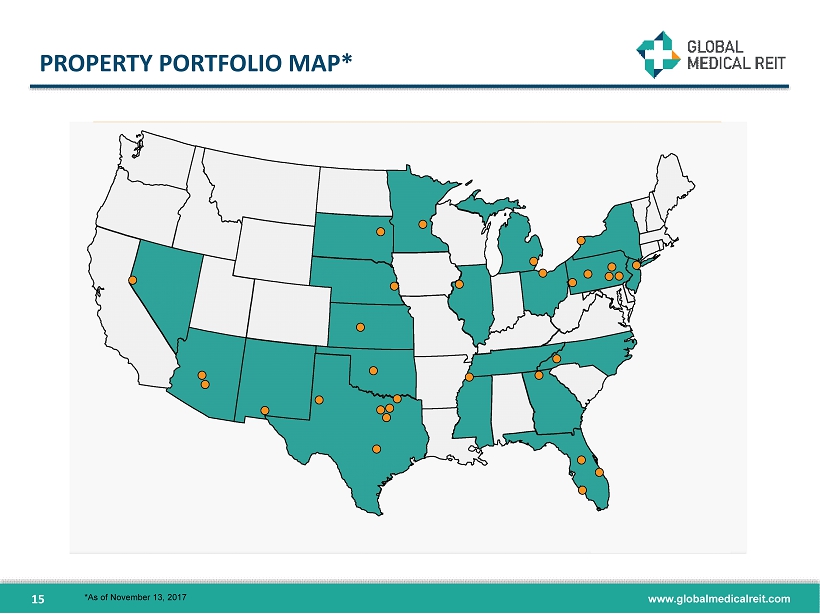
www.globalmedicalreit.com PROPERTY PORTFOLIO MAP* 15 *As of November 13, 2017
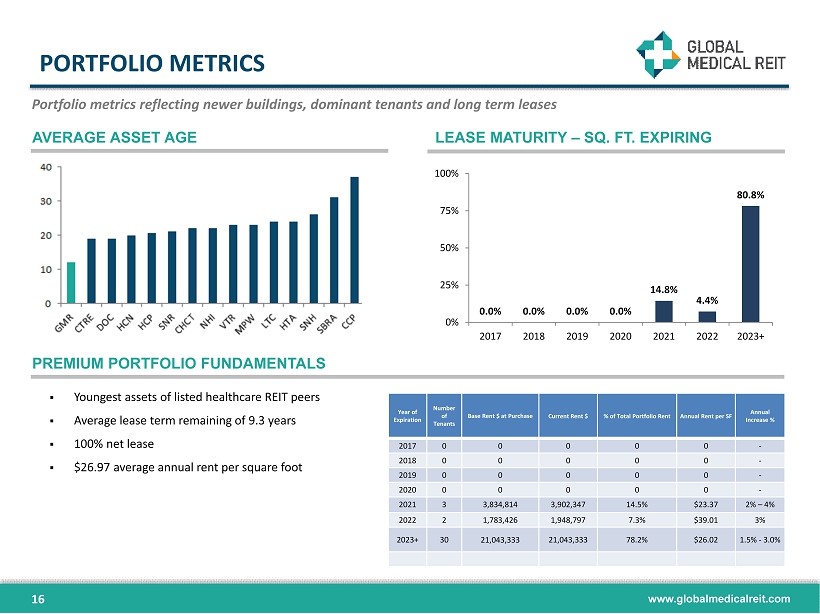
www.globalmedicalreit.com PORTFOLIO METRICS AVERAGE ASSET AGE LEASE MATURITY – SQ. FT. EXPIRING PREMIUM PORTFOLIO FUNDAMENTALS Portfolio metrics reflecting newer buildings, dominant tenants and long term leases 0.0% 0.0% 0.0% 0.0% 14.8% 4.4% 80.8% 0% 25% 50% 75% 100% 2017 2018 2019 2020 2021 2022 2023+ 16 ▪ Youngest assets of listed healthcare REIT peers ▪ Average lease term remaining of 9.3 years ▪ 100% net lease ▪ $26.97 average annual rent per square foot Year of Expiration Number of Tenants Base Rent $ at Purchase Current Rent $ % of Total Portfolio Rent Annual Rent per SF Annual Increase % 2017 0 0 0 0 0 - 2018 0 0 0 0 0 - 2019 0 0 0 0 0 - 2020 0 0 0 0 0 - 2021 3 3,834,814 3,902,347 14.5% $23.37 2% – 4% 2022 2 1,783,426 1,948,797 7.3% $39.01 3% 2023+ 30 21,043,333 21,043,333 78.2% $26.02 1.5% - 3.0%
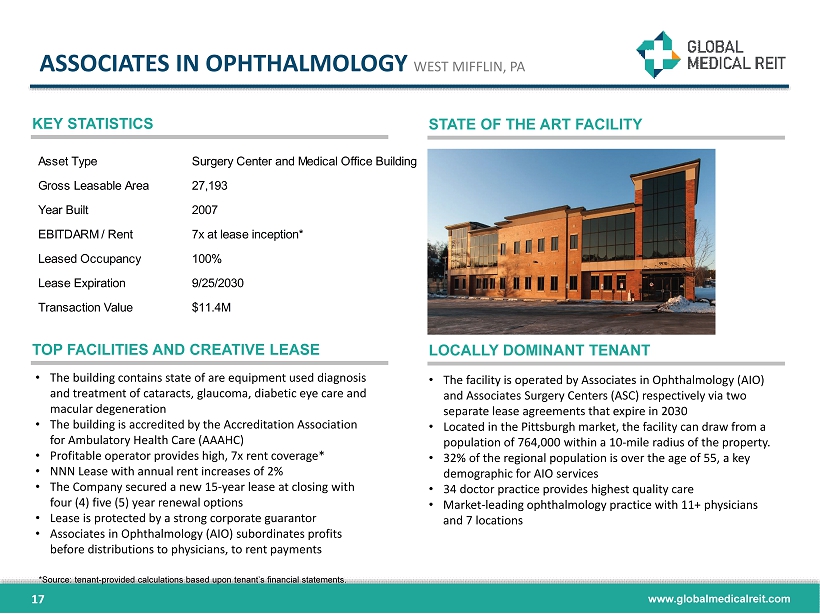
www.globalmedicalreit.com ASSOCIATES IN OPHTHALMOLOGY WEST MIFFLIN, PA KEY STATISTICS STATE OF THE ART FACILITY TOP FACILITIES AND CREATIVE LEASE LOCALLY DOMINANT TENANT • The building contains state of are equipment used diagnosis and treatment of cataracts, glaucoma, diabetic eye care and macular degeneration • The building is accredited by the Accreditation Association for Ambulatory Health Care (AAAHC) • Profitable operator provides high, 7x rent coverage* • NNN Lease with annual rent increases of 2% • The Company secured a new 15 - year lease at closing with four (4) five (5) year renewal options • Lease is protected by a strong corporate guarantor • Associates in Ophthalmology (AIO) subordinates profits before distributions to physicians, to rent payments • The facility is operated by Associates in Ophthalmology (AIO) and Associates Surgery Centers (ASC) respectively via two separate lease agreements that expire in 2030 • Located in the Pittsburgh market, the facility can draw from a population of 764,000 within a 10 - mile radius of the property. • 32% of the regional population is over the age of 55, a key demographic for AIO services • 34 doctor practice provides highest quality care • Market - leading ophthalmology practice with 11+ physicians and 7 locations 17 Asset Type Surgery Center and Medical Office Building Gross Leasable Area 27,193 Year Built 2007 EBITDARM / Rent 7x at lease inception* Leased Occupancy 100% Lease Expiration 9/25/2030 Transaction Value $11.4M *Source: tenant - provided calculations based upon tenant’s financial statements.
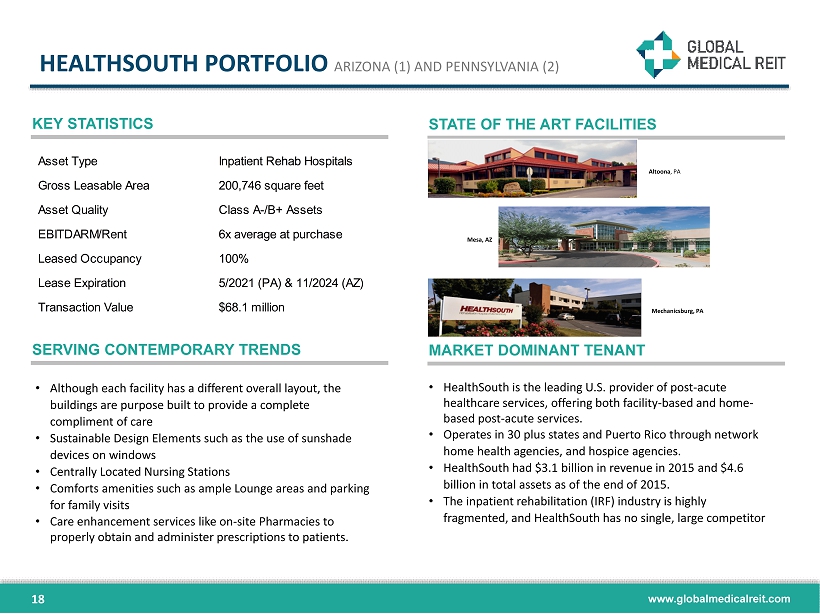
www.globalmedicalreit.com • Although each facility has a different overall layout, the buildings are purpose built to provide a complete compliment of care • Sustainable Design Elements such as the use of sunshade devices on windows • Centrally Located Nursing Stations • Comforts amenities such as ample Lounge areas and parking for family visits • Care enhancement services like on - site Pharmacies to properly obtain and administer prescriptions to patients. HEALTHSOUTH PORTFOLIO ARIZONA (1) AND PENNSYLVANIA (2) KEY STATISTICS STATE OF THE ART FACILITIES SERVING CONTEMPORARY TRENDS MARKET DOMINANT TENANT • HealthSouth is the leading U.S. provider of post - acute healthcare services, offering both facility - based and home - based post - acute services. • Operates in 30 plus states and Puerto Rico through network home health agencies, and hospice agencies. • HealthSouth had $3.1 billion in revenue in 2015 and $4.6 billion in total assets as of the end of 2015. • The inpatient rehabilitation (IRF) industry is highly fragmented, and HealthSouth has no single, large competitor 18 Asset Type Inpatient Rehab Hospitals Gross Leasable Area 200,746 square feet Asset Quality Class A-/B+ Assets EBITDARM/Rent 6x average at purchase Leased Occupancy 100% Lease Expiration 5/2021 (PA) & 11/2024 (AZ) Transaction Value $68.1 million Altoona , PA Mechanicsburg, PA Mesa, AZ
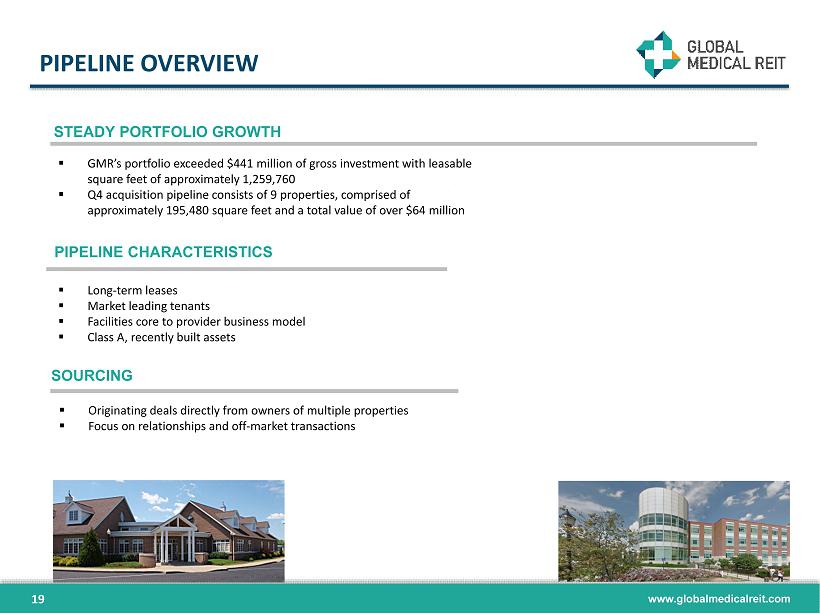
www.globalmedicalreit.com PIPELINE OVERVIEW STEADY PORTFOLIO GROWTH ▪ GMR’s portfolio exceeded $441 million of gross investment with leasable square feet of approximately 1,259,760 ▪ Q4 acquisition pipeline consists of 9 properties, comprised of approximately 195,480 square feet and a total value of over $64 million PIPELINE CHARACTERISTICS ▪ Long - term leases ▪ Market leading tenants ▪ Facilities core to provider business model ▪ Class A, recently built assets ▪ Originating deals directly from owners of multiple properties ▪ Focus on relationships and off - market transactions SOURCING 19 East Orange, NJ*
www.globalmedicalreit.com INVESTMENT HIGHLIGHTS Management Team with Public REIT Experience Attractive Industry Trends Market Leading Tenants High Quality Portfolio Substantial Pipeline of High Quality Assets 20

www.globalmedicalreit.com APPENDIX 21
www.globalmedicalreit.com INDEPENDENT DIRECTORS 22 ▪ President of Global Development International, providing development support and oversight for initiatives in medical and hea lth care programs (e.g. Instant Labs Medical Diagnostics, MedPharm & MPRC Group) ▪ Former President and Founder of international programs at The Futures Group International, a healthcare consulting firm ▪ Director of International Health and Population Programs for GE’s Center for Advanced Studies ▪ Yale (B.S.); Johns Hopkins (MA) ▪ Professor at Georgetown University’s McDonough School of Business as the director of the Real Estate Finance Initiative ▪ Former director at Invesco Real Estate (NYSE: IVR) where he was responsible for oversight of the Underwriting Group, which ac qui red $10.2 billion worth of institutional real estate ▪ Underwrote $1.5 billion of acquisitions and oversaw the Valuations group, which marked to market Invesco’s more than $13 bil lio n North American portfolio ▪ Penn State University (B.S.); Texas A&M University (M.S. and Ph.D.) ▪ Over 40 years experience in managing financial functions for large and small publicly traded companies ▪ Previously CFO of three public companies, Arlington Asset Investment Corp . , FBR Capital Markets and Jupiter National, Inc . ▪ Director of Wheeler Real Estate Investment Trust (NASDAQ : WHLR) and trustee and treasurer of Nichols College ▪ Nichols College (B . S . ) ; CPA (inactive) ▪ Founder and CEO of Health Care Corporation of America (HCCA) Management Company, originally a subsidiary of Hospital Corporation of America (HCA) ▪ 30 + years in international healthcare focused on healthcare systems with prior experience developing the Twelfth Evacuation Hospital in Vietnam ▪ Tennessee Technological University (B . S . ) ; California Western University (Ph . D . ) HENRY COLE (LEAD INDEPENDENT DIRECTOR) MATTHEW CYPHER, Ph.D. KURT HARRINGTON RONALD MARSTON ▪ Rear Admiral (Retired) and Chief Veterinary Medical Officer of United States Public Health Service ▪ Former Assistant United States Surgeon General, point person for global development support with a focus on less developed countries ▪ Epidemic Intelligence Service Officer with the U . S . Centers for Disease Control and Prevention (CDC) ▪ Chief epidemiologist with the Centers of Devices and Radiological Health in the US Food and Drug Administration (FDA) ▪ Tuskegee University (B . S . & DVM) ; University in Michigan (M . P . H . ) ; Johns Hopkins University (Ph . D . ) DR. ROSCOE MOORE Majority independent Board with strong backgrounds in healthcare, real estate and capital markets
www.globalmedicalreit.com INTERESTED DIRECTORS 23 ▪ Over 20 years of experience in healthcare, real estate development, management and investment ▪ Former assistant to the U.S. Secretary of Housing & Urban Development ▪ United States Special Representative to United Nations in Geneva ▪ Developed large - scale residential, commercial, hospitality and retail properties ▪ Approximately 20 years experience in real estate development in China ▪ Serves as President of Henan Real Estate Chamber of Commerce ▪ Co - founder of Henan Zensun Real Estate, one of the top 100 property development companies in China ▪ Honored with many awards as an outstanding developer and contributor to the Henan real estate industry ▪ Supervisor for Henan Hongguang Real Estate Limited, a company engaged in property development in China ▪ Supervisor for Henan Zensun Corporate Development Company Limited, a company engaged in construction and management in China ▪ University College London (B . S) ; Beijing Forestry University (B . S) ; University of Leicester (MA) ; JEFFREY BUSCH , Chairman, CEO and President ZHANG JINGGUO , Director ZHANG HUIQI , Director
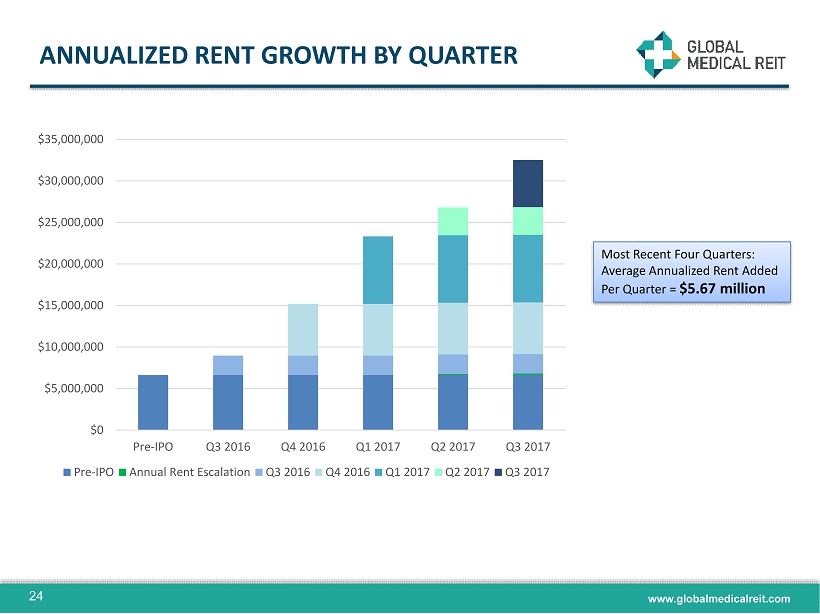
www.globalmedicalreit.com ANNUALIZED RENT GROWTH BY QUARTER $0 $5,000,000 $10,000,000 $15,000,000 $20,000,000 $25,000,000 $30,000,000 $35,000,000 Pre-IPO Q3 2016 Q4 2016 Q1 2017 Q2 2017 Q3 2017 Pre-IPO Annual Rent Escalation Q3 2016 Q4 2016 Q1 2017 Q2 2017 Q3 2017 Most Recent Four Quarters: Average Annualized Rent Added Per Quarter = $5.67 million 24
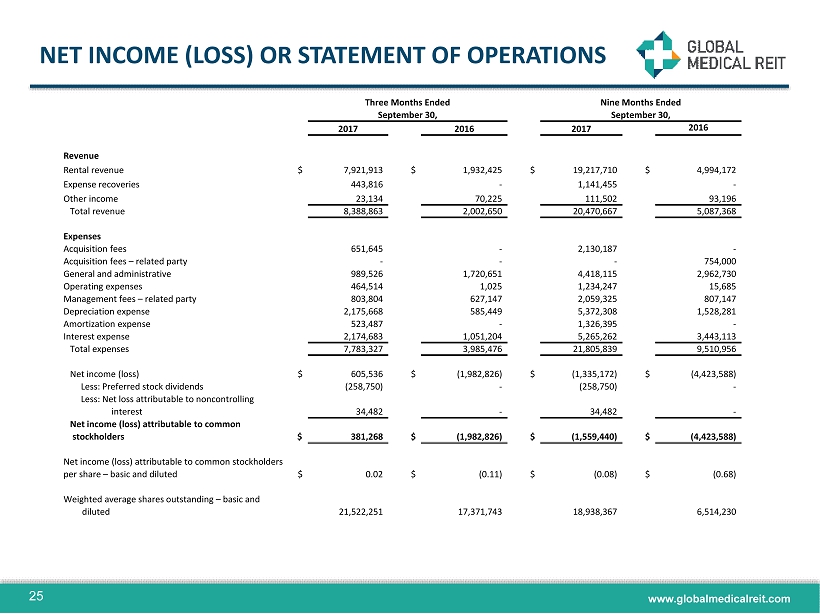
www.globalmedicalreit.com NET INCOME (LOSS) OR STATEMENT OF OPERATIONS 25 Three Months Ended September 30, Nine Months Ended September 30, 2017 2016 2017 2016 Revenue Rental revenue $ 7,921,913 $ 1,932,425 $ 19,217,710 $ 4,994,172 Expense recoveries 443,816 - 1,141,455 - Other income 23,134 70,225 111,502 93,196 Total revenue 8,388,863 2,002,650 20,470,667 5,087,368 Expenses Acquisition fees 651,645 - 2,130,187 - Acquisition fees – related party - - - 754,000 General and administrative 989,526 1,720,651 4,418,115 2,962,730 Operating expenses 464,514 1,025 1,234,247 15,685 Management fees – related party 803,804 627,147 2,059,325 807,147 Depreciation expense 2,175,668 585,449 5,372,308 1,528,281 Amortization expense 523,487 - 1,326,395 - Interest expense 2,174,683 1,051,204 5,265,262 3,443,113 Total expenses 7,783,327 3,985,476 21,805,839 9,510,956 Net income (loss) $ 605,536 $ (1,982,826) $ (1,335,172) $ (4,423,588) Less: Preferred stock dividends (258,750) - (258,750) - Less: Net loss attributable to noncontrolling interest 34,482 - 34,482 - Net income (loss) attributable to common stockholders $ 381,268 $ (1,982,826) $ (1,559,440) $ (4,423,588) Net income (loss) attributable to common stockholders per share – basic and diluted $ 0.02 $ (0.11) $ (0.08) $ (0.68) Weighted average shares outstanding – basic and diluted 21,522,251 17,371,743 18,938,367 6,514,230
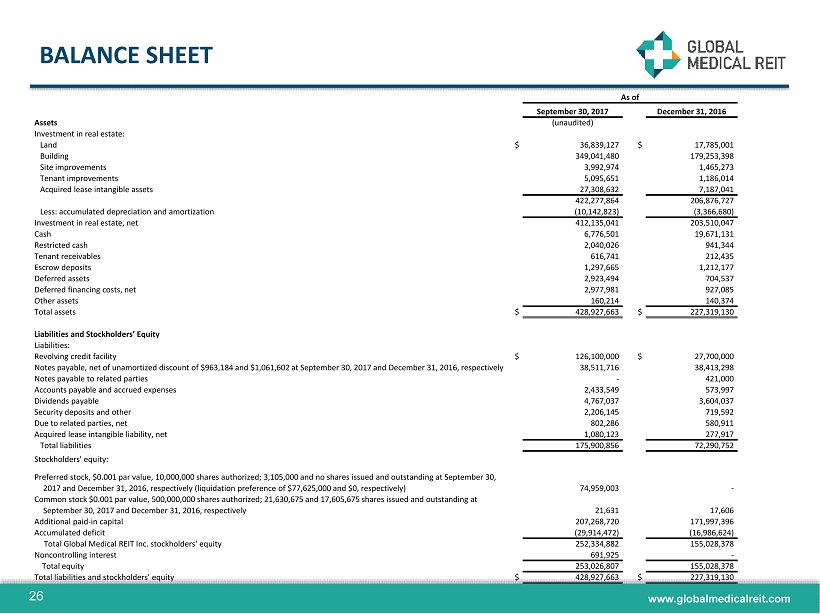
www.globalmedicalreit.com BALANCE SHEET 26 As of September 30, 2017 December 31, 2016 Assets (unaudited) Investment in real estate: Land $ 36,839,127 $ 17,785,001 Building 349,041,480 179,253,398 Site improvements 3,992,974 1,465,273 Tenant improvements 5,095,651 1,186,014 Acquired lease intangible assets 27,308,632 7,187,041 422,277,864 206,876,727 Less: accumulated depreciation and amortization (10,142,823) (3,366,680) Investment in real estate, net 412,135,041 203,510,047 Cash 6,776,501 19,671,131 Restricted cash 2,040,026 941,344 Tenant receivables 616,741 212,435 Escrow deposits 1,297,665 1,212,177 Deferred assets 2,923,494 704,537 Deferred financing costs, net 2,977,981 927,085 Other assets 160,214 140,374 Total assets $ 428,927,663 $ 227,319,130 Liabilities and Stockholders’ Equity Liabilities: Revolving credit facility $ 126,100,000 $ 27,700,000 Notes payable, net of unamortized discount of $963,184 and $1,061,602 at September 30, 2017 and December 31, 2016, respective ly 38,511,716 38,413,298 Notes payable to related parties - 421,000 Accounts payable and accrued expenses 2,433,549 573,997 Dividends payable 4,767,037 3,604,037 Security deposits and other 2,206,145 719,592 Due to related parties, net 802,286 580,911 Acquired lease intangible liability, net 1,080,123 277,917 Total liabilities 175,900,856 72,290,752 Stockholders' equity: Preferred stock, $0.001 par value, 10,000,000 shares authorized; 3,105,000 and no shares issued and outstanding at September 30, 2017 and December 31, 2016, respectively (liquidation preference of $77,625,000 and $0, respectively) 74,959,003 - Common stock $0.001 par value, 500,000,000 shares authorized; 21,630,675 and 17,605,675 shares issued and outstanding at September 30, 2017 and December 31, 2016, respectively 21,631 17,606 Additional paid - in capital 207,268,720 171,997,396 Accumulated deficit (29,914,472) (16,986,624) Total Global Medical REIT Inc. stockholders' equity 252,334,882 155,028,378 Noncontrolling interest 691,925 - Total equity 253,026,807 155,028,378 Total liabilities and stockholders' equity $ 428,927,663 $ 227,319,130
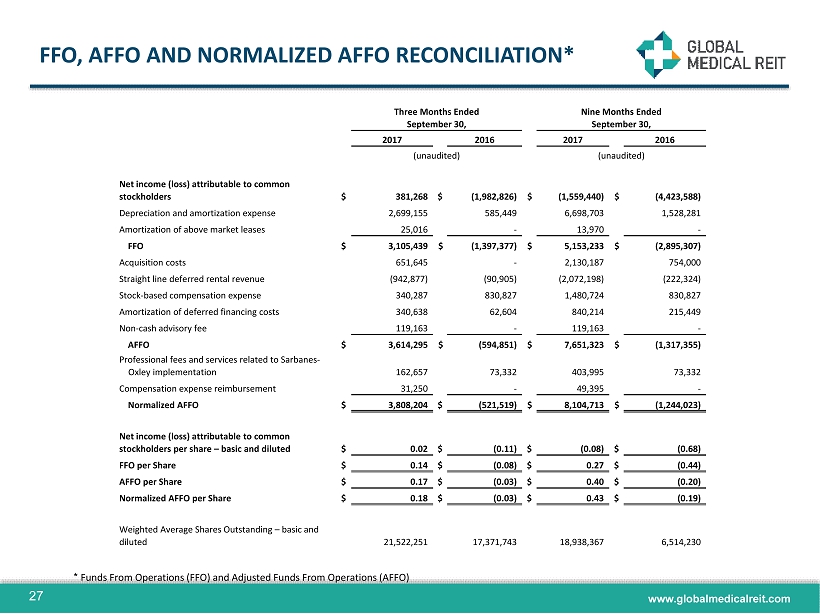
www.globalmedicalreit.com FFO , AFFO AND NORMALIZED AFFO RECONCILIATION* 27 Three Months Ended September 30, Nine Months Ended September 30, 2017 2016 2017 2016 (unaudited) (unaudited) Net income (loss) attributable to common stockholders $ 381,268 $ (1,982,826) $ (1,559,440) $ (4,423,588) Depreciation and amortization expense 2,699,155 585,449 6,698,703 1,528,281 Amortization of above market leases 25,016 - 13,970 - FFO $ 3,105,439 $ (1,397,377) $ 5,153,233 $ (2,895,307) Acquisition costs 651,645 - 2,130,187 754,000 Straight line deferred rental revenue (942,877) (90,905) (2,072,198) (222,324) Stock - based compensation expense 340,287 830,827 1,480,724 830,827 Amortization of deferred financing costs 340,638 62,604 840,214 215,449 Non - cash advisory fee 119,163 - 119,163 - AFFO $ 3,614,295 $ (594,851) $ 7,651,323 $ (1,317,355) Professional fees and services related to Sarbanes - Oxley implementation 162,657 73,332 403,995 73,332 Compensation expense reimbursement 31,250 - 49,395 - Normalized AFFO $ 3,808,204 $ (521,519) $ 8,104,713 $ (1,244,023) Net income (loss) attributable to common stockholders per share – basic and diluted $ 0.02 $ (0.11) $ (0.08) $ (0.68) FFO per Share $ 0.14 $ (0.08) $ 0.27 $ (0.44) AFFO per Share $ 0.17 $ (0.03) $ 0.40 $ (0.20) Normalized AFFO per Share $ 0.18 $ (0.03) $ 0.43 $ (0.19) Weighted Average Shares Outstanding – basic and diluted 21,522,251 17,371,743 18,938,367 6,514,230 * Funds From Operations (FFO and Adjusted Funds From Operations (AFFO)