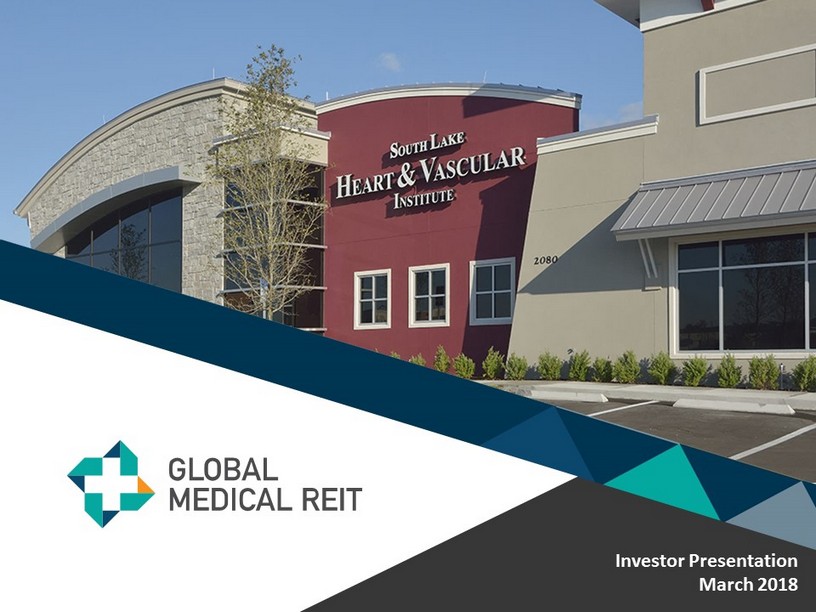
Exhibit 99.5
Investor Presentation March 2018
Disclaimer This presentation is for informational purposes only and does not constitute an offer to sell, or a solicitation of offers to pu rchase, Global Medical REIT Inc.’s (the “Company”, or “GMRE”) securities. The information contained in this presentation does not purport t o b e complete and should not be relied upon as a basis for making an investment decision in the Company’s securities. This presentation also contains statements that, to the extent they are not recitations of historical fact, constitute “forward - looking statements.” Forward - lo oking statements are typically identified by the use of terms such as “may,” “should,” “expect,” “could,” “intend,” “plan,” “antici pat e,” “estimate,” “believe,” “continue,” “predict,” “potential” or the negative of such terms and other comparable terminology. The forward - looki ng statements included herein are based upon the Company’s current expectations, plans, estimates, assumptions and beliefs that inv olve numerous risks and uncertainties. Assumptions relating to the foregoing involve judgments with respect to, among other things , f uture economic, competitive and market conditions and future business decisions, all of which are difficult or impossible to predic t a ccurately and many of which are beyond the Company’s control. Although the Company believes that the expectations reflected in such forward - lo oking statements are based on reasonable assumptions, the Company’s actual results and performance could differ materially from tho se set forth in the forward - looking statements due to the impact of many factors including, but not limited to, those discussed under “Risk F actors” in the Company’s Annual Report on Form 10 - K and Quarterly Reports on Form 10 - Q and any prospectus or prospectus supplement filed with t he Securities and Exchange Commission. The Company undertakes no obligation to update or revise any such information for any rea son after the date of this presentation, unless required by law. 1
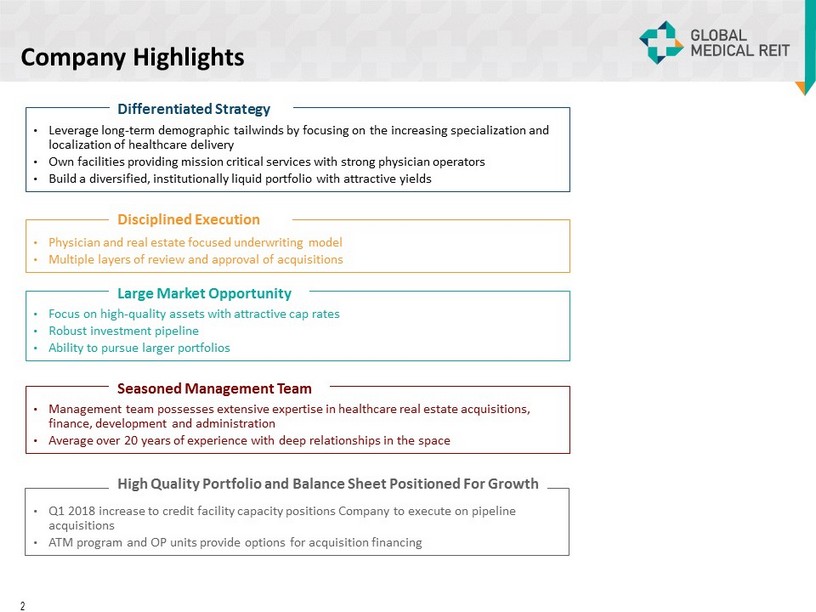
Company Highlights • Leverage long - term demographic tailwinds by focusing on the increasing specialization and localization of healthcare delivery • Own facilities providing mission critical services with strong physician operators • Build a diversified, institutionally liquid portfolio with attractive yields Differentiated Strategy • Physician and real estate focused underwriting model • Multiple layers of review and approval of acquisitions Disciplined Execution • Focus on high - quality assets with attractive cap rates • Robust investment pipeline • Ability to pursue larger portfolios Large Market Opportunity • Management team possesses extensive expertise in healthcare real estate acquisitions, finance, development and administration • Average over 20 years of experience with deep relationships in the space Seasoned Management Team • Q1 2018 increase to credit facility capacity positions Company to execute on pipeline acquisitions • ATM program and OP units provide options for acquisition financing High Quality Portfolio and Balance Sheet Positioned For Growth 2
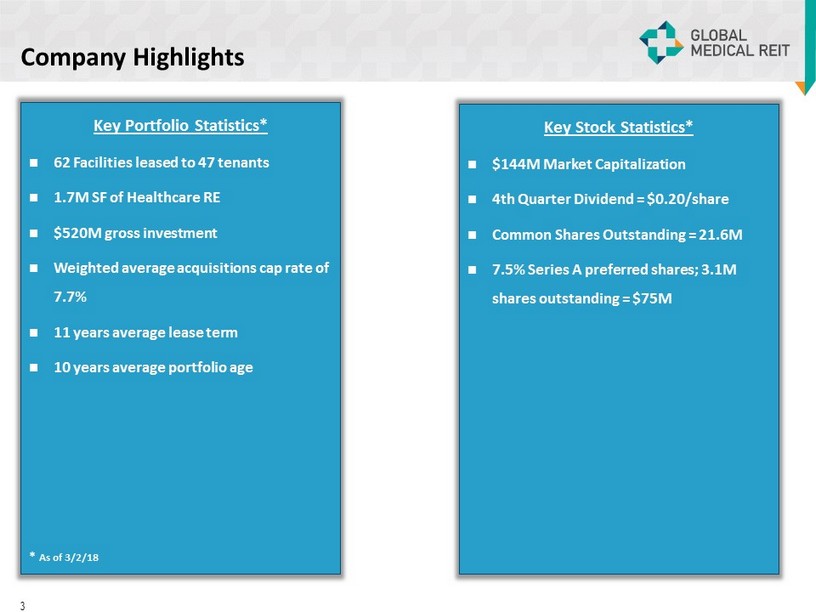
Key Portfolio Statistics* 62 Facilities leased to 47 tenants 1.7M SF of Healthcare RE $520M gross investment Weighted average acquisitions cap rate of 7.7% 11 years average lease term 10 years average portfolio age * As of 3/2/18 Company Highlights 3 Key Stock Statistics* $144M Market Capitalization 4th Quarter Dividend = $0.20/share Common Shares Outstanding = 21.6M 7.5% Series A preferred shares; 3.1M shares outstanding = $75M
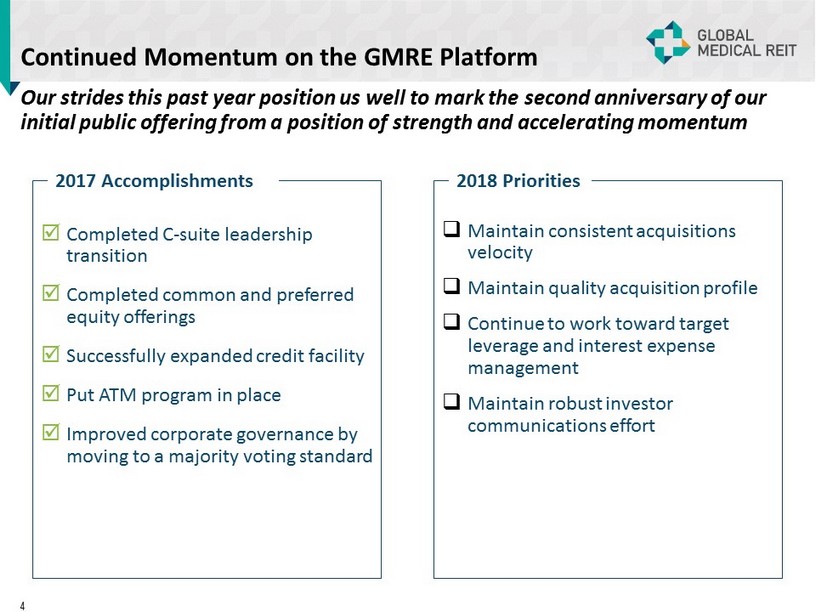
Continued Momentum on the GMRE Platform Our strides this past year position us well to mark the second anniversary of our initial public offering from a position of strength and accelerating momentum Completed C - suite leadership transition Completed common and preferred equity offerings Successfully expanded credit facility Put ATM program in place Improved corporate governance by moving to a majority voting standard 2017 Accomplishments □ Maintain consistent acquisitions velocity □ Maintain quality acquisition profile □ Continue to work toward target leverage and interest expense management □ Maintain robust investor communications effort 2018 Priorities 4
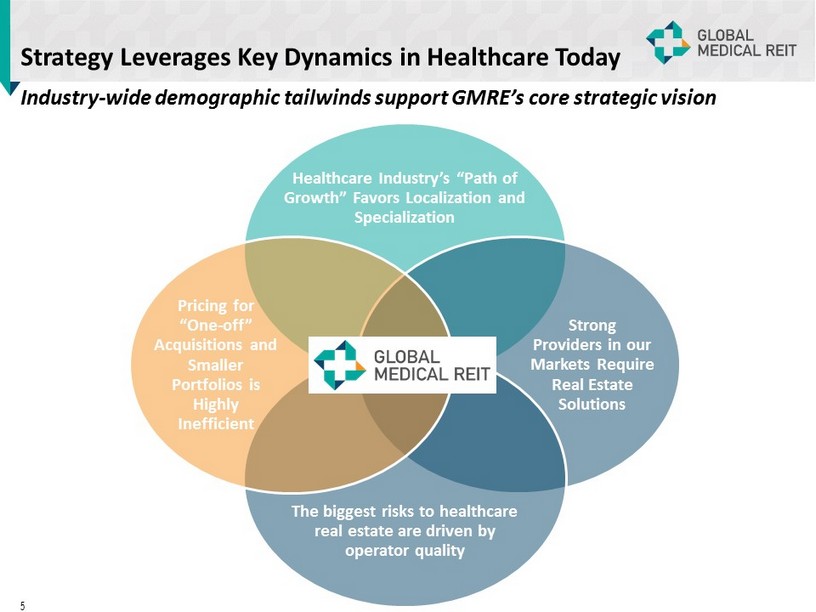
Strategy Leverages Key Dynamics in Healthcare Today Healthcare Industry’s “Path of Growth” Favors Localization and Specialization Strong Providers in our Markets Require Real Estate Solutions The biggest risks to healthcare real estate are driven by operator quality Pricing for “One - off” Acquisitions and Smaller Portfolios is Highly Inefficient Industry - wide demographic tailwinds support GMRE’s core strategic vision 5
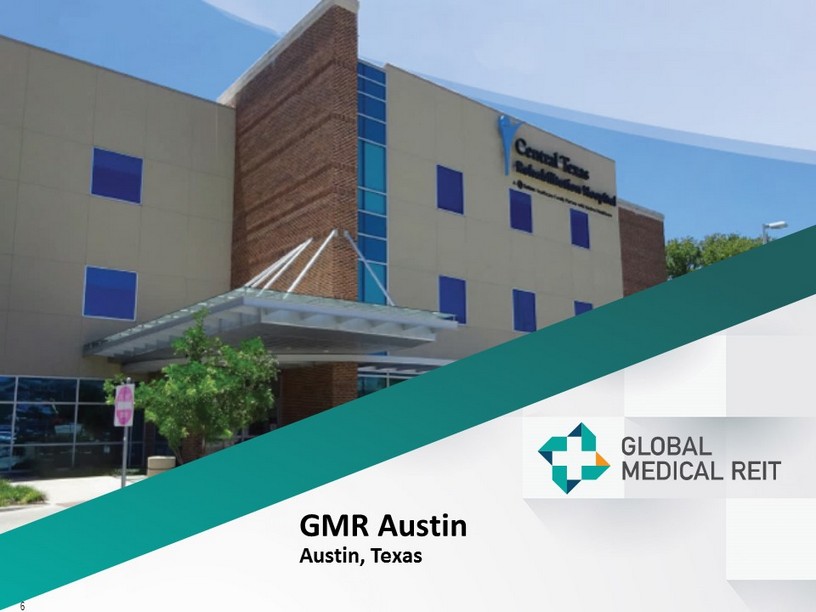
GMR Austin Austin, Texas 6
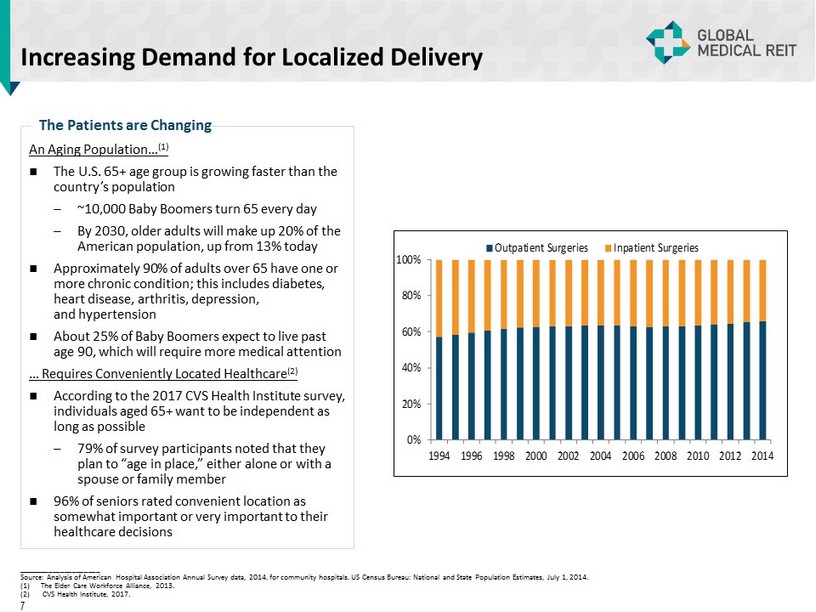
Increasing Demand for Localized Delivery 0% 20% 40% 60% 80% 100% 1994 1996 1998 2000 2002 2004 2006 2008 2010 2012 2014 Outpatient Surgeries Inpatient Surgeries An Aging Population… (1) The U.S. 65+ age group is growing faster than the country’s population – ~10,000 Baby Boomers turn 65 every day – By 2030, older adults will make up 20% of the American population, up from 13% today Approximately 90% of adults over 65 have one or more chronic condition; this includes diabetes, heart disease, arthritis, depression, and hypertension About 25% of Baby Boomers expect to live past age 90, which will require more medical attention … Requires Conveniently Located Healthcare (2) According to the 2017 CVS Health Institute survey, individuals aged 65+ want to be independent as long as possible – 79% of survey participants noted that they plan to “age in place,” either alone or with a spouse or family member 96% of seniors rated convenient location as somewhat important or very important to their healthcare decisions The Patients are Changing _____________________ Source: Analysis of American Hospital Association Annual Survey data, 2014, for community hospitals. US Census Bureau: Nation al and State Population Estimates, July 1, 2014. (1) The Elder Care Workforce Alliance, 2013. (2) CVS Health Institute, 2017. 7
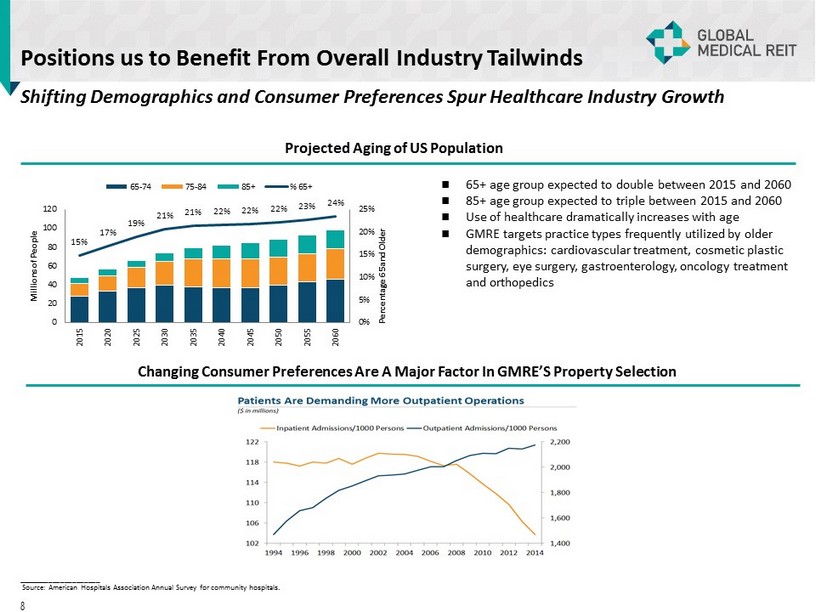
Shifting Demographics and Consumer Preferences Spur Healthcare Industry Growth Positions us to Benefit From Overall Industry Tailwinds Projected Aging of US Population 65+ age group expected to double between 2015 and 2060 85+ age group expected to triple between 2015 and 2060 Use of healthcare dramatically increases with age GMRE targets practice types frequently utilized by older demographics: cardiovascular treatment, cosmetic plastic surgery, eye surgery, gastroenterology, oncology treatment and orthopedics Changing Consumer Preferences Are A Major Factor In GMRE’S Property Selection 15% 17% 19% 21% 21% 22% 22% 22% 23% 24% 0% 5% 10% 15% 20% 25% 0 20 40 60 80 100 120 2015 2020 2025 2030 2035 2040 2045 2050 2055 2060 Percentage 65 and Older Millions of People 65-74 75-84 85+ % 65+ _____________________ Source: American Hospitals Association Annual Survey for community hospitals. 8
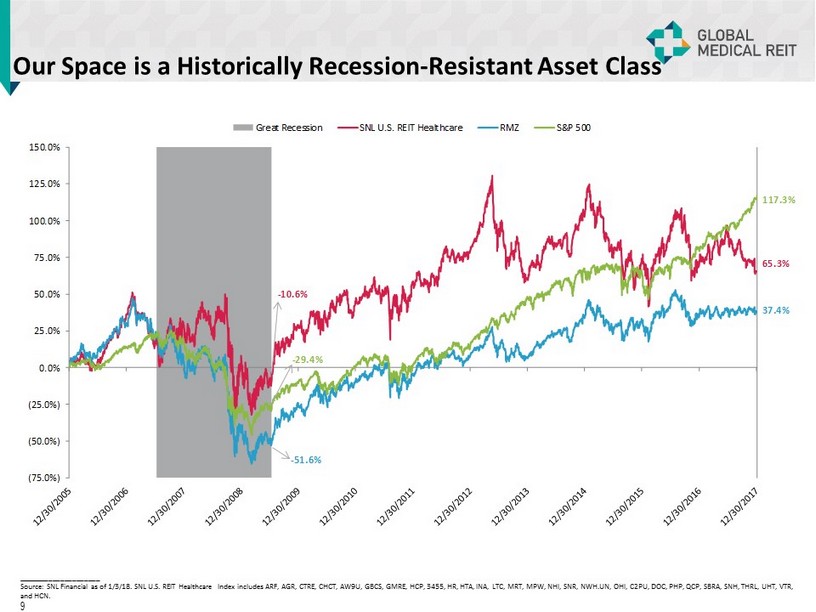
- 10.6% 65.3% - 51.6% 37.4% - 29.4% 117.3% (75.0%) (50.0%) (25.0%) 0.0% 25.0% 50.0% 75.0% 100.0% 125.0% 150.0% Great Recession SNL U.S. REIT Healthcare RMZ S&P 500 Our Space is a Historically Recession - Resistant Asset Class _____________________ Source: SNL Financial as of 1/3/18. SNL U.S. REIT Healthcare Index includes ARF, AGR, CTRE, CHCT, AW9U, GBCS, GMRE, HCP, 3455, HR, HTA, INA, LTC, MRT, MPW, NHI, SNR, NWH.UN, OHI, C2PU, DOC, PHP, QCP, S BRA , SNH, THRL, UHT, VTR, and HCN. 9
GMR Flower Mound Flower Mound, Texas 10
Disciplined Yet Opportunistic Acquisition Criteria x Strong providers with leading market share x Rent guarantees and other credit protection x Specialization in age - related procedures x Operators with regional footprints x Strong and diversified payor mix and history x Institutional quality x Purpose - built real estate x Single tenant focus with selective multi - tenant acquisitions x Class A / Recent construction or renovation x Amenitized patient areas x Convenient access / location x Long - term leases with annual rent escalations x Healthcare market with clear and quantifiable competitive dynamics x Positioned to benefit from ongoing decentralization trends in healthcare x Proximity to related resources x Long - term positive demand drivers (population growth and demographics) x Barriers to competition Tenants Facilities Markets / Locations We seek acquisition opportunities which score favorably across each of our primary assessment areas 11
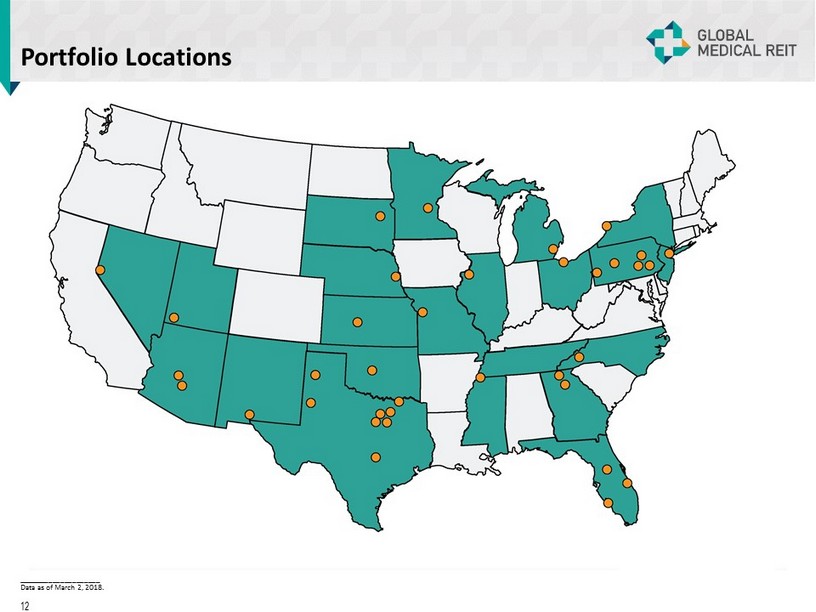
Portfolio Locations _____________________ Data as of March 2, 2018. 12
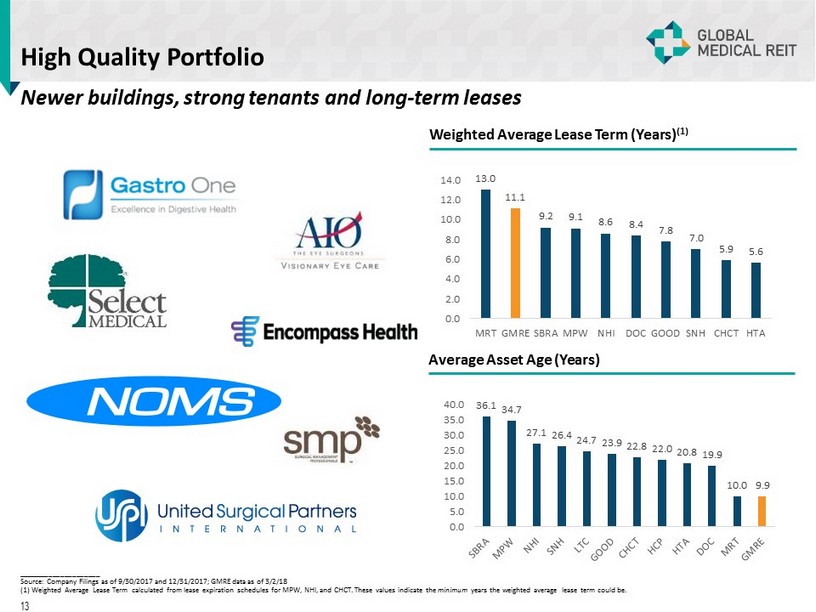
High Quality Portfolio Newer buildings, strong tenants and long - term leases Weighted Average Lease Term (Years) (1) Average Asset Age (Years) _____________________ Source: Company Filings as of 9/30/2017 and 12/31/2017; GMRE data as of 3/2/18 (1) Weighted Average Lease Term calculated from lease expiration schedules for MPW, NHI, and CHCT. These values indicate the minimum years the weighted average lease term could be. 13 13.0 11.1 9.2 9.1 8.6 8.4 7.8 7.0 5.9 5.6 0.0 2.0 4.0 6.0 8.0 10.0 12.0 14.0 MRT GMRE SBRA MPW NHI DOC GOOD SNH CHCT HTA 36.1 34.7 27.1 26.4 24.7 23.9 22.8 22.0 20.8 19.9 10.0 9.9 0.0 5.0 10.0 15.0 20.0 25.0 30.0 35.0 40.0
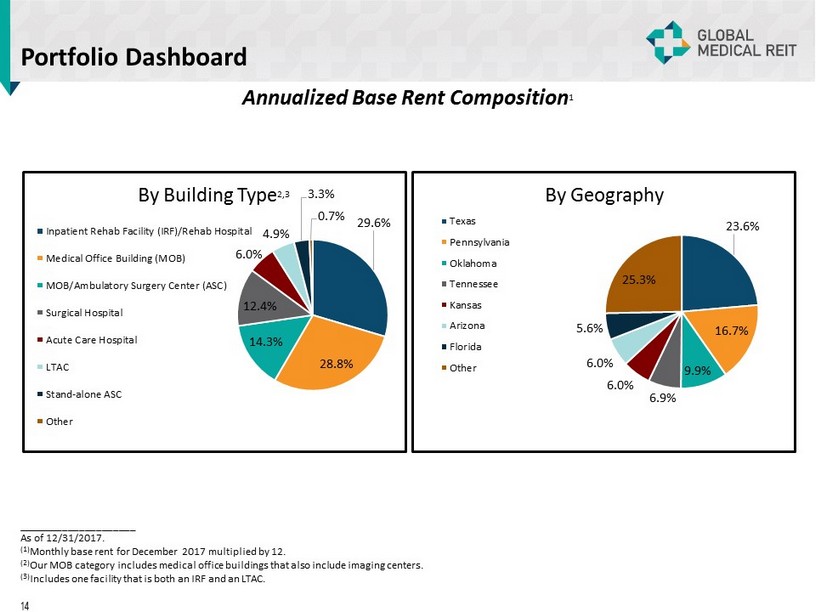
Portfolio Dashboard Annualized Base Rent Composition 1 _____________________ As of 12/31/2017. (1) Monthly base rent for December 2017 multiplied by 12. (2) Our MOB category includes medical office buildings that also include imaging centers. (3) Includes one facility that is both an IRF and an LTAC. 14 29.6% 28.8% 14.3% 12.4% 6.0% 4.9% 3.3% 0.7% By Building Type 2,3 Inpatient Rehab Facility (IRF)/Rehab Hospital Medical Office Building (MOB) MOB/Ambulatory Surgery Center (ASC) Surgical Hospital Acute Care Hospital LTAC Stand-alone ASC Other 23.6% 16.7% 9.9% 6.9% 6.0% 6.0% 5.6% 25.3% By Geography Texas Pennsylvania Oklahoma Tennessee Kansas Arizona Florida Other
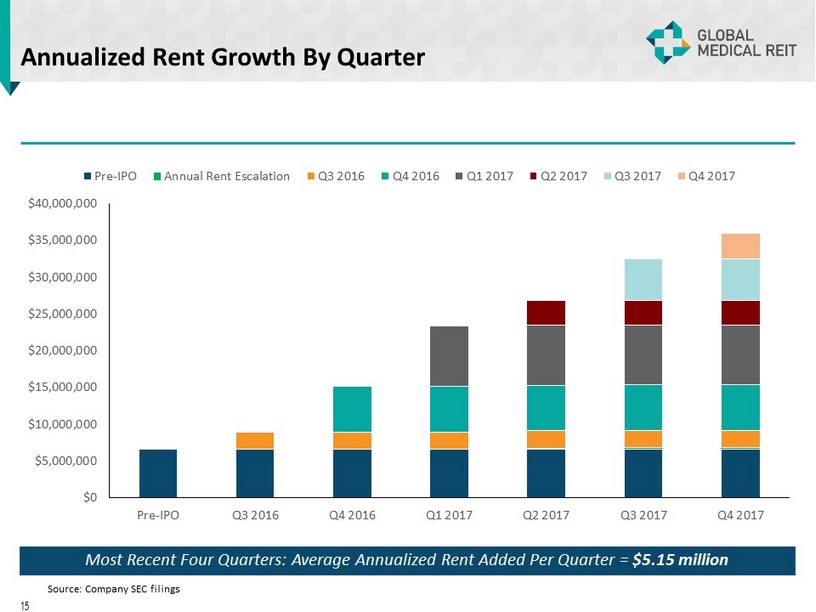
Annualized Rent Growth By Quarter $0 $5,000,000 $10,000,000 $15,000,000 $20,000,000 $25,000,000 $30,000,000 $35,000,000 $40,000,000 Pre-IPO Q3 2016 Q4 2016 Q1 2017 Q2 2017 Q3 2017 Q4 2017 Pre-IPO Annual Rent Escalation Q3 2016 Q4 2016 Q1 2017 Q2 2017 Q3 2017 Q4 2017 Most Recent Four Quarters: Average Annualized Rent Added Per Quarter = $5.15 million 15 Source: Company SEC filings
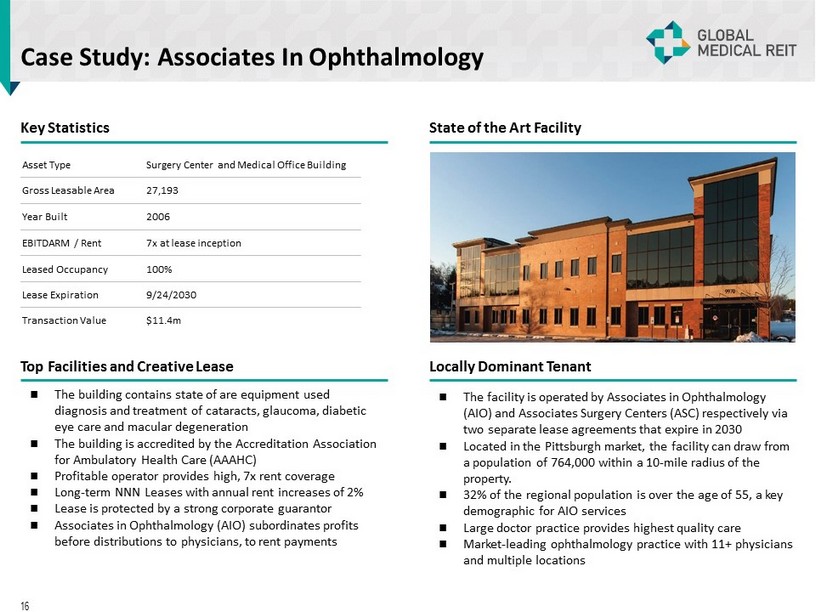
Case Study: Associates In Ophthalmology Key Statistics State of the Art Facility Top Facilities and Creative Lease Locally Dominant Tenant The building contains state of are equipment used diagnosis and treatment of cataracts, glaucoma, diabetic eye care and macular degeneration The building is accredited by the Accreditation Association for Ambulatory Health Care (AAAHC) Profitable operator provides high, 7x rent coverage Long - term NNN Leases with annual rent increases of 2% Lease is protected by a strong corporate guarantor Associates in Ophthalmology (AIO) subordinates profits before distributions to physicians, to rent payments The facility is operated by Associates in Ophthalmology (AIO) and Associates Surgery Centers (ASC) respectively via two separate lease agreements that expire in 2030 Located in the Pittsburgh market, the facility can draw from a population of 764,000 within a 10 - mile radius of the property. 32% of the regional population is over the age of 55, a key demographic for AIO services Large doctor practice provides highest quality care Market - leading ophthalmology practice with 11+ physicians and multiple locations 16 Asset Type Surgery Center and Medical Office Building Gross Leasable Area 27,193 Year Built 2006 EBITDARM / Rent 7x at lease inception Leased Occupancy 100% Lease Expiration 9/24/2030 Transaction Value $11.4m
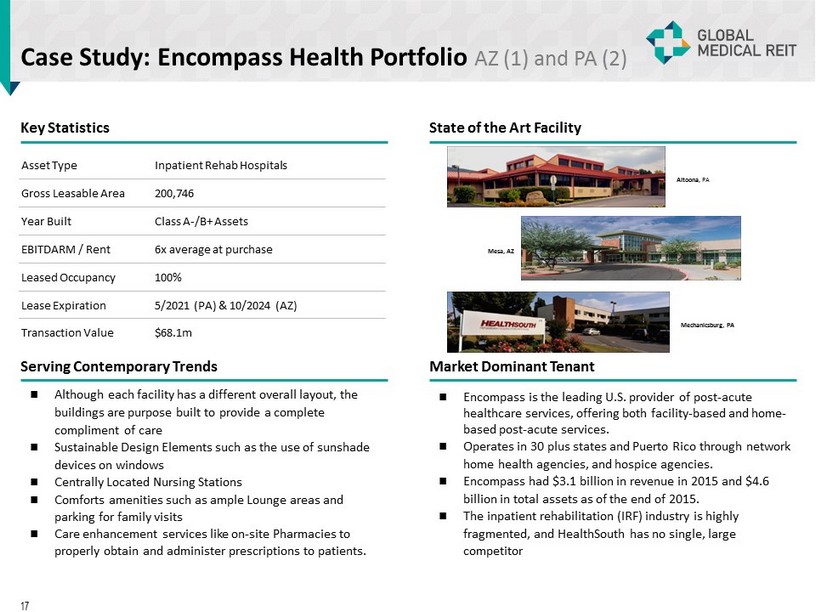
Case Study: Encompass Health Portfolio AZ (1) and PA (2) Key Statistics State of the Art Facility Serving Contemporary Trends Market Dominant Tenant Although each facility has a different overall layout, the buildings are purpose built to provide a complete compliment of care Sustainable Design Elements such as the use of sunshade devices on windows Centrally Located Nursing Stations Comforts amenities such as ample Lounge areas and parking for family visits Care enhancement services like on - site Pharmacies to properly obtain and administer prescriptions to patients. Encompass is the leading U.S. provider of post - acute healthcare services, offering both facility - based and home - based post - acute services. Operates in 30 plus states and Puerto Rico through network home health agencies, and hospice agencies. Encompass had $3.1 billion in revenue in 2015 and $4.6 billion in total assets as of the end of 2015. The inpatient rehabilitation (IRF) industry is highly fragmented, and HealthSouth has no single, large competitor Altoona , PA Mechanicsburg, PA Mesa, AZ 17 Asset Type Inpatient Rehab Hospitals Gross Leasable Area 200,746 Year Built Class A - /B+ Assets EBITDARM / Rent 6x average at purchase Leased Occupancy 100% Lease Expiration 5/2021 (PA) & 10/2024 (AZ) Transaction Value $68.1m
Leadership JEFFREY BUSCH , Chairman, Chief Executive Officer and President ▪ Over 20 years of experience in healthcare, real estate development, management and investment ▪ Former assistant to the U.S. Secretary of Housing & Urban Development ▪ United States Special Representative to United Nations in Geneva ▪ Developed large - scale residential, commercial, hospitality and retail properties ROBERT KIERNAN , Chief Financial Officer and Treasurer ▪ Over 30 years of experience in financial accounting, reporting and management, including extensive experience in SEC reportin g and Sarbanes - Oxley compliance ▪ Served as the Senior Vice President, Controller and Chief Accounting Officer of FBR & Co. (“FBR” NASDAQ: FBRC) beginning in O cto ber 2007 ▪ Prior role as Senior Vice President, Controller and Chief Accounting Officer of Arlington Asset Investment Corp. (NYSE: AI) ▪ Previously Senior Manager in the assurance practice at Ernst & Young ALFONZO LEON , Chief Investment Officer ▪ Over 17 years of experience in real estate finance and has completed $ 3 billion of transactions ▪ Prior experience as principal at investment advisor to pension funds and investment banker representing healthcare systems, dev elopers and REITs ▪ Healthcare real estate investment banker for Cain Brothers ▪ Acquired $ 800 million in multi - family, office, medical office, and industrial property on behalf of institutional investors while at LaSalle Investment DANICA HOLLEY, Chief Operating Officer ▪ Management and business development experience spans more than 18 years ▪ More than a decade of experience managing multinational teams for complex service delivery across disciplines ▪ More than 8 years in healthcare programs and infrastructure as Executive Director of Safe Blood International ▪ More than a decade of experience with SEC compliance and reporting matters, corporate governance, investment banking and REIT - related capital markets ▪ Served as Associate General Counsel of FBR (NASDAQ: FBRC) beginning in July 2012 ▪ Prior role as Senior Associate – REIT Capital Markets at Hunton & Williams LLP, where he represented public REITs in conjunction with their SEC compliance requirements, corporate governance matters, offerings of equity and debt securities and merger and acquisition transactions ▪ Previously with Sullivan & Cromwell LLP and KPMG JAMIE BARBER, General Counsel and Corporate Secretary 18
Independent Directors Majority independent Board with strong backgrounds in healthcare, real estate and capital markets Henry Cole ▪ President of Global Development International, providing development support and oversight for initiatives in medical and hea lth care programs (e.g. Instant Labs Medical Diagnostics, MedPharm & MPRC Group) ▪ Former President and Founder of international programs at The Futures Group International, a healthcare consulting firm ▪ Director of International Health and Population Programs for GE’s Center for Advanced Studies ▪ Yale (B.S.); Johns Hopkins (MA) Matthew Cypher, Ph.D. ▪ Director of the Steers Center for Global Real Estate Director of the Steers Center for Global Real Estate and Atara Kaufman Professor of Real Estate at Georgetown University’s McDonough School of Business ▪ Former director at Invesco Real Estate (NYSE: IVR) where he was responsible for oversight of the Underwriting Group, which ac qui red $10.2 billion worth of institutional real estate ▪ Underwrote $1.5 billion of acquisitions and oversaw the Valuations group, which marked to market Invesco’s more than $13 bil lio n North American portfolio ▪ Penn State University (B.S.); Texas A&M University (M.S. and Ph.D.) Kurt Harrington ▪ Over 40 years experience in managing financial functions for large and small publicly traded companies ▪ Previously CFO of three public companies, Arlington Asset Investment Corp . , FBR Capital Markets and Jupiter National, Inc . ▪ Director of Wheeler Real Estate Investment Trust (NASDAQ : WHLR) and trustee and treasurer of Nichols College ▪ Nichols College (B . S . ) ; CPA (inactive) Ronald Marston ▪ Founder and CEO of Health Care Corporation of America (HCCA) Management Company, originally a subsidiary of Hospital Corporation of America (HCA) ▪ 30 + years in international healthcare focused on healthcare systems with prior experience developing the Twelfth Evacuation Hospital in Vietnam ▪ Tennessee Technological University (B . S . ) ; California Western University (Ph . D . ) ▪ Rear Admiral (Retired) and Chief Veterinary Medical Officer of United States Public Health Service ▪ Former Assistant United States Surgeon General, point person for global development support with a focus on less developed countries ▪ Epidemic Intelligence Service Officer with the U . S . Centers for Disease Control and Prevention (CDC) ▪ Chief epidemiologist with the Centers of Devices and Radiological Health in the US Food and Drug Administration (FDA) ▪ Tuskegee University (B . S . & DVM) ; University in Michigan (M . P . H . ) ; Johns Hopkins University (Ph . D . ) Dr. Roscoe Moore 19
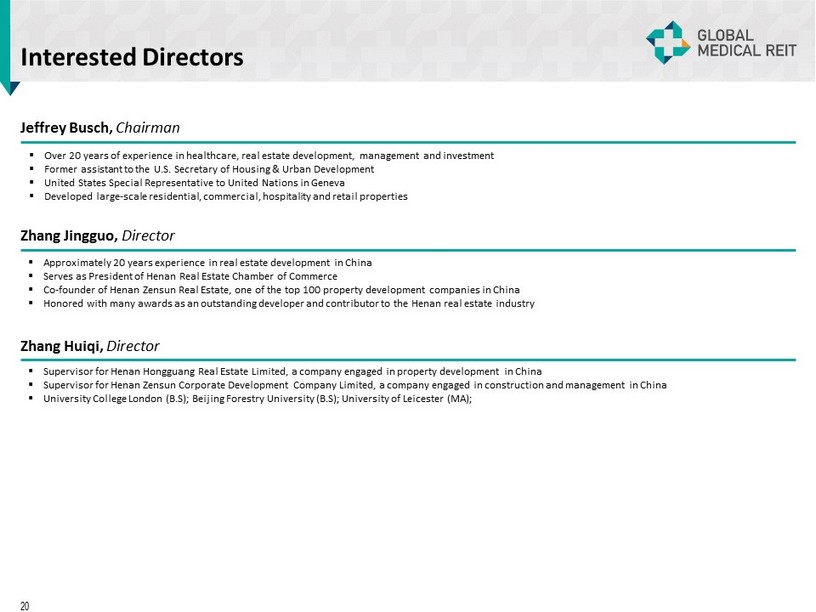
Interested Directors Jeffrey Busch, Chairman ▪ Over 20 years of experience in healthcare, real estate development, management and investment ▪ Former assistant to the U.S. Secretary of Housing & Urban Development ▪ United States Special Representative to United Nations in Geneva ▪ Developed large - scale residential, commercial, hospitality and retail properties Zhang Jingguo , Director ▪ Approximately 20 years experience in real estate development in China ▪ Serves as President of Henan Real Estate Chamber of Commerce ▪ Co - founder of Henan Zensun Real Estate, one of the top 100 property development companies in China ▪ Honored with many awards as an outstanding developer and contributor to the Henan real estate industry ▪ Supervisor for Henan Hongguang Real Estate Limited, a company engaged in property development in China ▪ Supervisor for Henan Zensun Corporate Development Company Limited, a company engaged in construction and management in China ▪ University College London (B . S) ; Beijing Forestry University (B . S) ; University of Leicester (MA) ; Zhang Huiqi , Director 20
APPENDIX 21
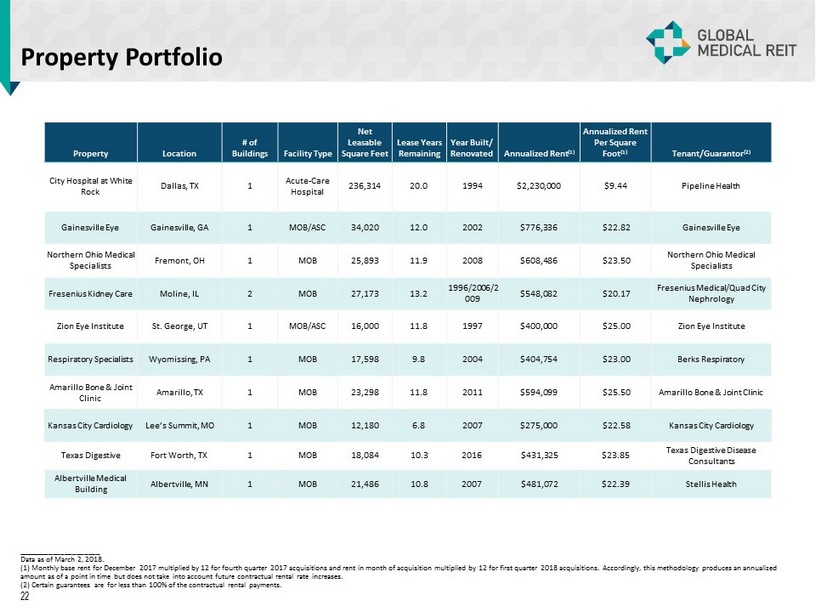
Property Portfolio _____________________ Data as of March 2, 2018. (1) Monthly base rent for December 2017 multiplied by 12 for fourth quarter 2017 acquisitions and rent in month of acquisition mu lti plied by 12 for first quarter 2018 acquisitions . Accordingly, this methodology produces an annualized amount as of a point in time but does not take into account future contractual rental rate increases. (2) Certain guarantees are for less than 100% of the contractual rental payments. 22 Property Location # of Buildings Facility Type Net Leasable Square Feet Lease Years Remaining Year Built/ Renovated Annualized Rent (1) Annualized Rent Per Square Foot (1) Tenant/Guarantor (2) City Hospital at White Rock Dallas, TX 1 Acute - Care Hospital 236,314 20.0 1994 $2,230,000 $9.44 Pipeline Health Gainesville Eye Gainesville, GA 1 MOB/ASC 34,020 12.0 2002 $776,336 $22.82 Gainesville Eye Northern Ohio Medical Specialists Fremont, OH 1 MOB 25,893 11.9 2008 $608,486 $23.50 Northern Ohio Medical Specialists Fresenius Kidney Care Moline, IL 2 MOB 27,173 13.2 1996/2006/2 009 $548,082 $20.17 Fresenius Medical/Quad City Nephrology Zion Eye Institute St. George, UT 1 MOB/ASC 16,000 11.8 1997 $400,000 $25.00 Zion Eye Institute Respiratory Specialists Wyomissing, PA 1 MOB 17,598 9.8 2004 $404,754 $23.00 Berks Respiratory Amarillo Bone & Joint Clinic Amarillo, TX 1 MOB 23,298 11.8 2011 $594,099 $25.50 Amarillo Bone & Joint Clinic Kansas City Cardiology Lee’s Summit, MO 1 MOB 12,180 6.8 2007 $275,000 $22.58 Kansas City Cardiology Texas Digestive Fort Worth, TX 1 MOB 18,084 10.3 2016 $431,325 $23.85 Texas Digestive Disease Consultants Albertville Medical Building Albertville, MN 1 MOB 21,486 10.8 2007 $481,072 $22.39 Stellis Health
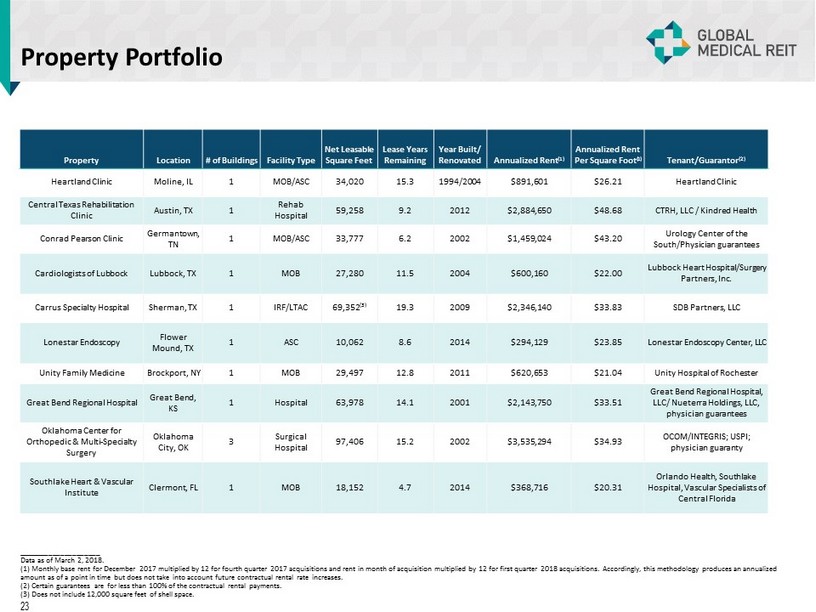
Property Portfolio Property Location # of Buildings Facility Type Net Leasable Square Feet Lease Years Remaining Year Built/ Renovated Annualized Rent (1) Annualized Rent Per Square Foot (1) Tenant/Guarantor (2) Heartland Clinic Moline, IL 1 MOB/ASC 34,020 15.3 1994/2004 $891,601 $26.21 Heartland Clinic Central Texas Rehabilitation Clinic Austin, TX 1 Rehab Hospital 59,258 9.2 2012 $2,884,650 $48.68 CTRH, LLC / Kindred Health Conrad Pearson Clinic Germantown, TN 1 MOB/ASC 33,777 6.2 2002 $1,459,024 $43.20 Urology Center of the South/Physician guarantees Cardiologists of Lubbock Lubbock, TX 1 MOB 27,280 11.5 2004 $600,160 $22.00 Lubbock Heart Hospital/Surgery Partners, Inc. Carrus Specialty Hospital Sherman, TX 1 IRF/LTAC 69,352 (3) 19.3 2009 $2,346,140 $33.83 SDB Partners, LLC Lonestar Endoscopy Flower Mound, TX 1 ASC 10,062 8.6 2014 $294,129 $23.85 Lonestar Endoscopy Center, LLC Unity Family Medicine Brockport, NY 1 MOB 29,497 12.8 2011 $620,653 $21.04 Unity Hospital of Rochester Great Bend Regional Hospital Great Bend, KS 1 Hospital 63,978 14.1 2001 $2,143,750 $33.51 Great Bend Regional Hospital, LLC/ Nueterra Holdings, LLC, physician guarantees Oklahoma Center for Orthopedic & Multi - Specialty Surgery Oklahoma City, OK 3 Surgical Hospital 97,406 15.2 2002 $3,535,294 $34.93 OCOM/INTEGRIS; USPI; physician guaranty Southlake Heart & Vascular Institute Clermont, FL 1 MOB 18,152 4.7 2014 $368,716 $20.31 Orlando Health, Southlake Hospital, Vascular Specialists of Central Florida _____________________ Data as of March 2, 2018. (1) Monthly base rent for December 2017 multiplied by 12 for fourth quarter 2017 acquisitions and rent in month of acquisition mu lti plied by 12 for first quarter 2018 acquisitions . Accordingly, this methodology produces an annualized amount as of a point in time but does not take into account future contractual rental rate increases. (2) Certain guarantees are for less than 100% of the contractual rental payments. (3) Does not include 12,000 square feet of shell space. 23
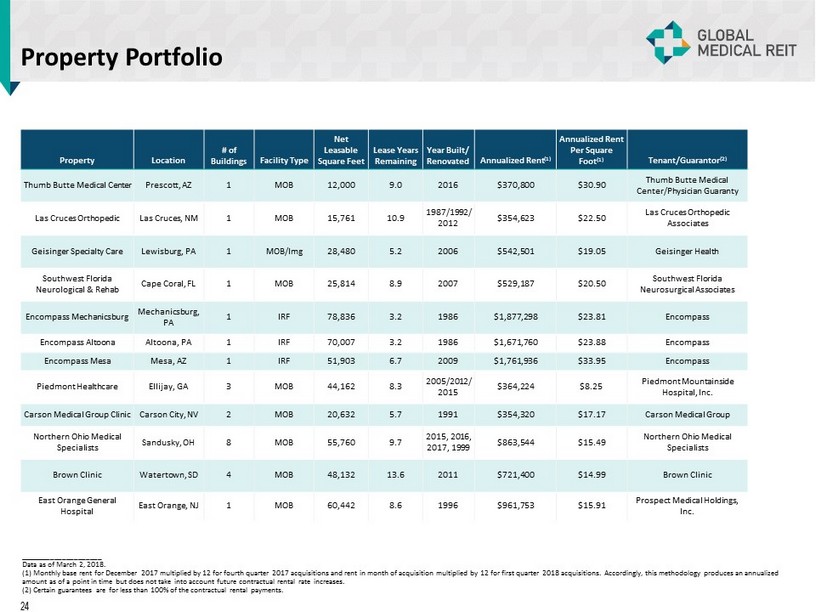
Property Portfolio Property Location # of Buildings Facility Type Net Leasable Square Feet Lease Years Remaining Year Built/ Renovated Annualized Rent (1) Annualized Rent Per Square Foot (1) Tenant/Guarantor (2) Thumb Butte Medical Center Prescott, AZ 1 MOB 12,000 9.0 2016 $370,800 $30.90 Thumb Butte Medical Center /Physician Guaranty Las Cruces Orthopedic Las Cruces, NM 1 MOB 15,761 10.9 1987/1992/ 2012 $354,623 $22.50 Las Cruces Orthopedic Associates Geisinger Specialty Care Lewisburg, PA 1 MOB/ Img 28,480 5.2 2006 $542,501 $19.05 Geisinger Health Southwest Florida Neurological & Rehab Cape Coral, FL 1 MOB 25,814 8.9 2007 $529,187 $20.50 Southwest Florida Neurosurgical Associates Encompass Mechanicsburg Mechanicsburg, PA 1 IRF 78,836 3.2 1986 $1,877,298 $23.81 Encompass Encompass Altoona Altoona, PA 1 IRF 70,007 3.2 1986 $1,671,760 $23.88 Encompass Encompass Mesa Mesa, AZ 1 IRF 51,903 6.7 2009 $1,761,936 $33.95 Encompass Piedmont Healthcare Ellijay, GA 3 MOB 44,162 8.3 2005/2012/ 2015 $364,224 $8.25 Piedmont Mountainside Hospital, Inc. Carson Medical Group Clinic Carson City, NV 2 MOB 20,632 5.7 1991 $354,320 $17.17 Carson Medical Group Northern Ohio Medical Specialists Sandusky, OH 8 MOB 55,760 9.7 2015, 2016, 2017, 1999 $863,544 $15.49 Northern Ohio Medical Specialists Brown Clinic Watertown, SD 4 MOB 48,132 13.6 2011 $721,400 $14.99 Brown Clinic East Orange General Hospital East Orange, NJ 1 MOB 60,442 8.6 1996 $961,753 $15.91 Prospect Medical Holdings, Inc. _____________________ Data as of March 2, 2018. (1) Monthly base rent for December 2017 multiplied by 12 for fourth quarter 2017 acquisitions and rent in month of acquisition mu lti plied by 12 for first quarter 2018 acquisitions . Accordingly, this methodology produces an annualized amount as of a point in time but does not take into account future contractual rental rate increases. (2) Certain guarantees are for less than 100% of the contractual rental payments. 24
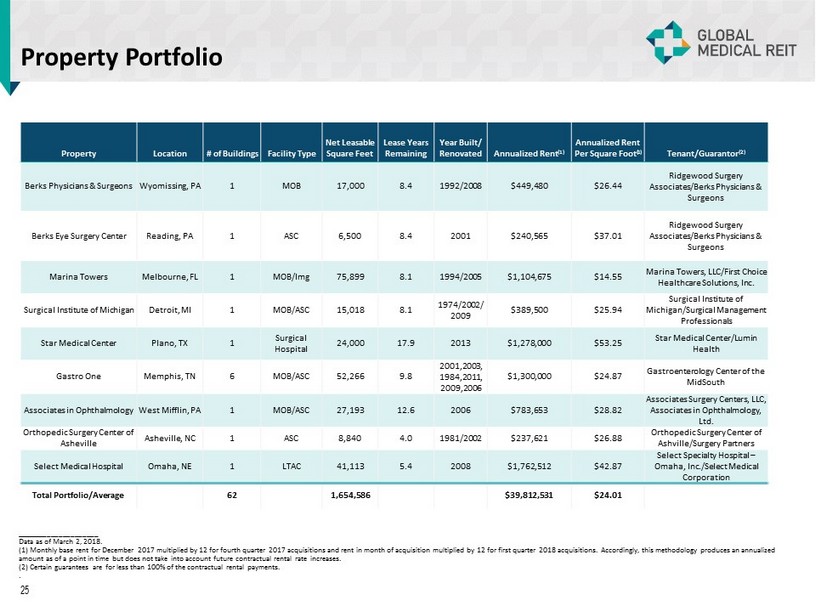
Property Portfolio _____________________ Data as of March 2, 2018. (1) Monthly base rent for December 2017 multiplied by 12 for fourth quarter 2017 acquisitions and rent in month of acquisition mu lti plied by 12 for first quarter 2018 acquisitions . Accordingly, this methodology produces an annualized amount as of a point in time but does not take into account future contractual rental rate increases. (2) Certain guarantees are for less than 100% of the contractual rental payments. . 25 Property Location # of Buildings Facility Type Net Leasable Square Feet Lease Years Remaining Year Built/ Renovated Annualized Rent (1) Annualized Rent Per Square Foot (1) Tenant/Guarantor (2) Berks Physicians & Surgeons Wyomissing, PA 1 MOB 17,000 8.4 1992/2008 $449,480 $26.44 Ridgewood Surgery Associates/Berks Physicians & Surgeons Berks Eye Surgery Center Reading, PA 1 ASC 6,500 8.4 2001 $240,565 $37.01 Ridgewood Surgery Associates/Berks Physicians & Surgeons Marina Towers Melbourne, FL 1 MOB/Img 75,899 8.1 1994/2005 $1,104,675 $14.55 Marina Towers, LLC/First Choice Healthcare Solutions, Inc. Surgical Institute of Michigan Detroit, MI 1 MOB/ASC 15,018 8.1 1974/2002/ 2009 $389,500 $25.94 Surgical Institute of Michigan/Surgical Management Professionals Star Medical Center Plano, TX 1 Surgical Hospital 24,000 17.9 2013 $1,278,000 $53.25 Star Medical Center/Lumin Health Gastro One Memphis, TN 6 MOB/ASC 52,266 9.8 2001,2003, 1984,2011, 2009,2006 $1,300,000 $24.87 Gastroenterology Center of the MidSouth Associates in Ophthalmology West Mifflin, PA 1 MOB/ASC 27,193 12.6 2006 $783,653 $28.82 Associates Surgery Centers, LLC, Associates in Ophthalmology, Ltd. Orthopedic Surgery Center of Asheville Asheville, NC 1 ASC 8,840 4.0 1981/2002 $237,621 $26.88 Orthopedic Surgery Center of Ashville/Surgery Partners Select Medical Hospital Omaha, NE 1 LTAC 41,113 5.4 2008 $1,762,512 $42.87 Select Specialty Hospital – Omaha, Inc./Select Medical Corporation Total Portfolio/Average 62 1,654,586 $39,812,531 $24.01
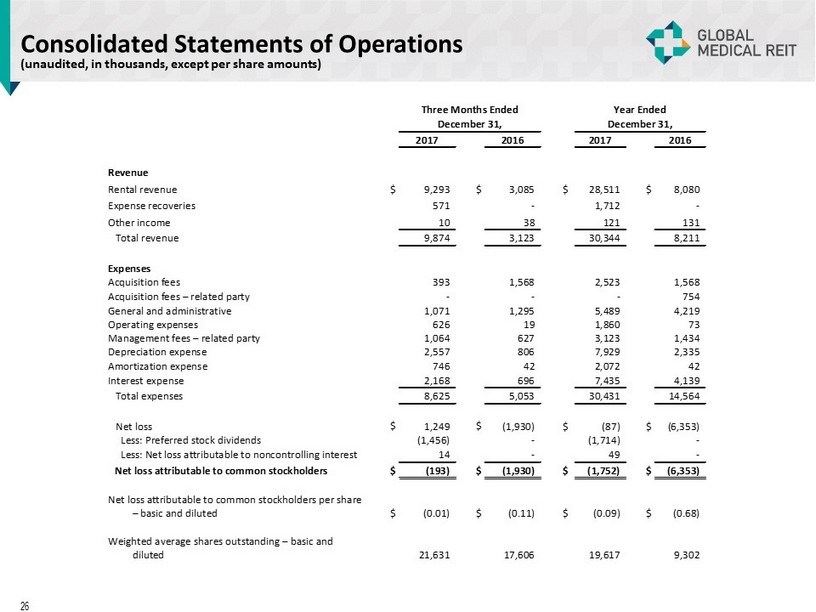
Consolidated Statements of Operations (unaudited, in thousands, except per share amounts) 26 Three Months Ended Year Ended December 31, December 31, 2017 2016 2017 2016 Revenue Rental revenue $ 9,293 $ 3,085 $ 28,511 $ 8,080 Expense recoveries 571 - 1,712 - Other income 10 38 121 131 Total revenue 9,874 3,123 30,344 8,211 Expenses Acquisition fees 393 1,568 2,523 1,568 Acquisition fees – related party - - - 754 General and administrative 1,071 1,295 5,489 4,219 Operating expenses 626 19 1,860 73 Management fees – related party 1,064 627 3,123 1,434 Depreciation expense 2,557 806 7,929 2,335 Amortization expense 746 42 2,072 42 Interest expense 2,168 696 7,435 4,139 Total expenses 8,625 5,053 30,431 14,564 Net loss $ 1,249 $ (1,930) $ (87) $ (6,353) Less: Preferred stock dividends (1,456) - (1,714) - Less: Net loss attributable to noncontrolling interest 14 - 49 - Net loss attributable to common stockholders $ (193) $ (1,930) $ (1,752) $ (6,353) Net loss attributable to common stockholders per share – basic and diluted $ (0.01) $ (0.11) $ (0.09) $ (0.68) Weighted average shares outstanding – basic and diluted 21,631 17,606 19,617 9,302
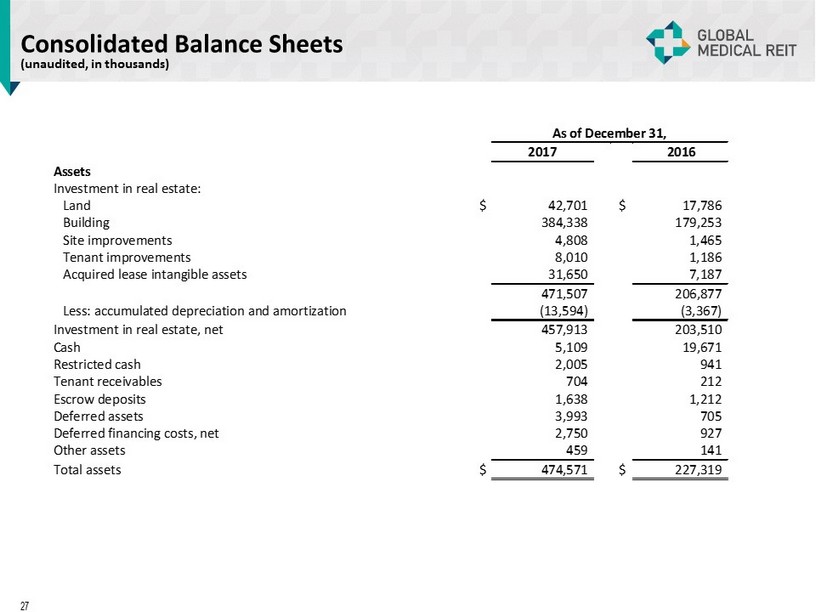
Consolidated Balance Sheets (unaudited, in thousands) 27 As of December 31, 2017 2016 Assets Investment in real estate: Land $ 42,701 $ 17,786 Building 384,338 179,253 Site improvements 4,808 1,465 Tenant improvements 8,010 1,186 Acquired lease intangible assets 31,650 7,187 471,507 206,877 Less: accumulated depreciation and amortization (13,594) (3,367) Investment in real estate, net 457,913 203,510 Cash 5,109 19,671 Restricted cash 2,005 941 Tenant receivables 704 212 Escrow deposits 1,638 1,212 Deferred assets 3,993 705 Deferred financing costs, net 2,750 927 Other assets 459 141 Total assets $ 474,571 $ 227,319
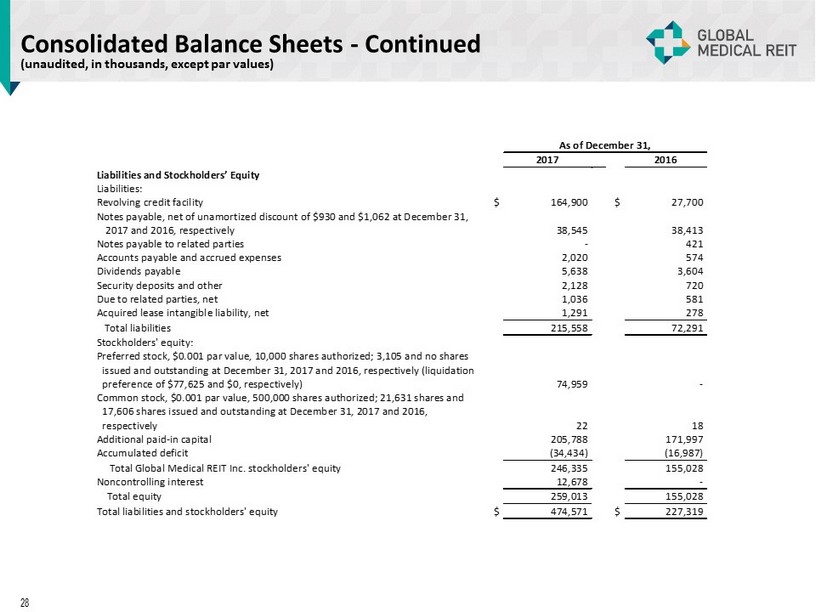
Consolidated Balance Sheets - Continued (unaudited, in thousands, except par values) 28 As of December 31, 2017 2016 Liabilities and Stockholders’ Equity Liabilities: Revolving credit facility $ 164,900 $ 27,700 Notes payable, net of unamortized discount of $930 and $1,062 at December 31, 2017 and 2016, respectively 38,545 38,413 Notes payable to related parties - 421 Accounts payable and accrued expenses 2,020 574 Dividends payable 5,638 3,604 Security deposits and other 2,128 720 Due to related parties, net 1,036 581 Acquired lease intangible liability, net 1,291 278 Total liabilities 215,558 72,291 Stockholders' equity: Preferred stock, $0.001 par value, 10,000 shares authorized; 3,105 and no shares issued and outstanding at December 31, 2017 and 2016, respectively (liquidation preference of $77,625 and $0, respectively) 74,959 - Common stock, $0.001 par value, 500,000 shares authorized; 21,631 shares and 17,606 shares issued and outstanding at December 31, 2017 and 2016, respectively 22 18 Additional paid-in capital 205,788 171,997 Accumulated deficit (34,434) (16,987) Total Global Medical REIT Inc. stockholders' equity 246,335 155,028 Noncontrolling interest 12,678 - Total equity 259,013 155,028 Total liabilities and stockholders' equity $ 474,571 $ 227,319
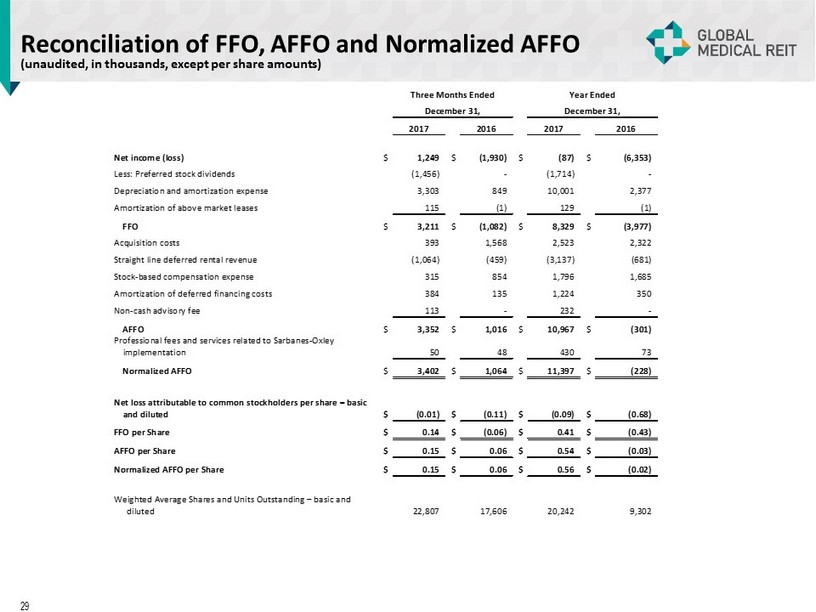
Reconciliation of FFO, AFFO and Normalized AFFO (unaudited, in thousands, except per share amounts) 29 Three Months Ended Year Ended December 31, December 31, 2017 2016 2017 2016 Net income (loss) $ 1,249 $ (1,930) $ (87) $ (6,353) Less: Preferred stock dividends (1,456) - (1,714) - Depreciation and amortization expense 3,303 849 10,001 2,377 Amortization of above market leases 115 (1) 129 (1) FFO $ 3,211 $ (1,082) $ 8,329 $ (3,977) Acquisition costs 393 1,568 2,523 2,322 Straight line deferred rental revenue (1,064) (459) (3,137) (681) Stock-based compensation expense 315 854 1,796 1,685 Amortization of deferred financing costs 384 135 1,224 350 Non-cash advisory fee 113 - 232 - AFFO $ 3,352 $ 1,016 $ 10,967 $ (301) Professional fees and services related to Sarbanes-Oxley implementation 50 48 430 73 Normalized AFFO $ 3,402 $ 1,064 $ 11,397 $ (228) Net loss attributable to common stockholders per share – basic and diluted $ (0.01) $ (0.11) $ (0.09) $ (0.68) FFO per Share $ 0.14 $ (0.06) $ 0.41 $ (0.43) AFFO per Share $ 0.15 $ 0.06 $ 0.54 $ (0.03) Normalized AFFO per Share $ 0.15 $ 0.06 $ 0.56 $ (0.02) Weighted Average Shares and Units Outstanding – basic and diluted 22,807 17,606 20,242 9,302