
Exhibit 99.2
Investor Presentation June 2018
Disclaimer This presentation is for informational purposes only and does not constitute an offer to sell, or a solicitation of offers to purchase, Global Medical REIT Inc . ’s (the “Company”, or “GMRE”) securities . The information contained in this presentation does not purport to be complete and should not be relied upon as a basis for making an investment decision in the Company’s securities . This presentation also contains statements that, to the extent they are not recitations of historical fact, constitute “forward - looking statements . ” Forward - looking statements are typically identified by the use of terms such as “may,” “should,” “expect,” “could,” “intend,” “plan,” “anticipate,” “estimate,” “believe,” “continue,” “predict,” “potential” or the negative of such terms and other comparable terminology . The forward - looking statements included herein are based upon the Company’s current expectations, plans, estimates, assumptions and beliefs that involve numerous risks and uncertainties . Assumptions relating to the foregoing involve judgments with respect to, among other things, future economic, competitive and market conditions and future business decisions, all of which are difficult or impossible to predict accurately and many of which are beyond the Company’s control . Although the Company believes that the expectations reflected in such forward - looking statements are based on reasonable assumptions, the Company’s actual results and performance could differ materially from those set forth in the forward - looking statements due to the impact of many factors including, but not limited to, those discussed under “Risk Factors” in the Company’s Annual Report on Form 10 - K and Quarterly Reports on Form 10 - Q and any prospectus or prospectus supplement filed with the Securities and Exchange Commission . The Company undertakes no obligation to update or revise any such information for any reason after the date of this presentation, unless required by law . This presentation includes information regarding certain of our tenants, which are not subject to SEC reporting requirements . The information related to our tenants contained in this report was provided to us by such tenants or was derived from publicly available information . We have not independently investigated or verified this information . We have no reason to believe that this information is inaccurate in any material respect, but we cannot provide any assurance of its accuracy . We are providing this data for informational purposes only . 1

Company Highlights • Leverage long - term demographic tailwinds by focusing on the increasing specialization and localization of healthcare delivery • Own facilities providing mission critical services with strong physician operators • Build a diversified, institutionally liquid portfolio with attractive yields Differentiated Strategy • Physician and real estate focused underwriting model • Multiple layers of review and approval of acquisitions Disciplined Execution • Focus on high - quality assets with attractive cap rates • Robust investment pipeline Large Market Opportunity • Management team possesses extensive expertise in healthcare real estate acquisitions, finance, development and administration • Average over 20 years of experience with deep relationships in the space Seasoned Management Team 2
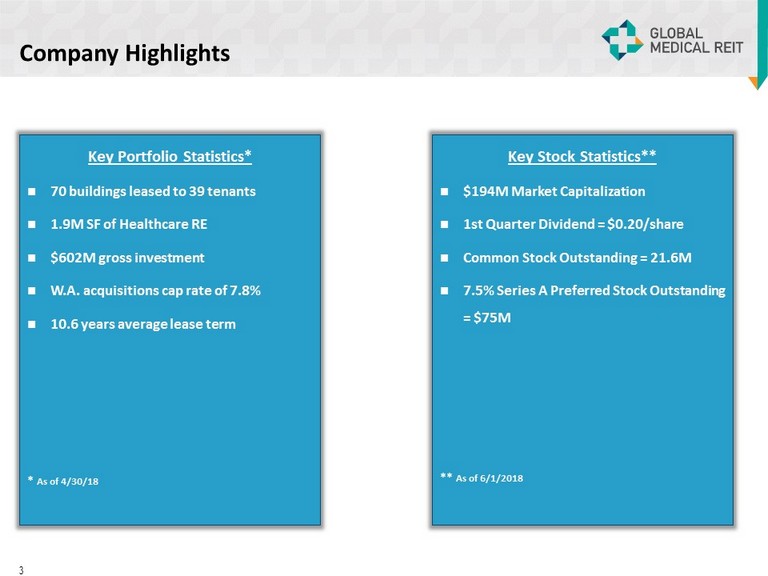
Key Portfolio Statistics* 70 buildings leased to 39 tenants 1.9M SF of Healthcare RE $602M gross investment W.A. acquisitions cap rate of 7.8% 10.6 years average lease term * As of 4/30/18 Company Highlights 3 Key Stock Statistics** $194M Market Capitalization 1st Quarter Dividend = $0.20/share Common Stock Outstanding = 21.6M 7.5% Series A Preferred Stock Outstanding = $75M ** As of 6/1/2018
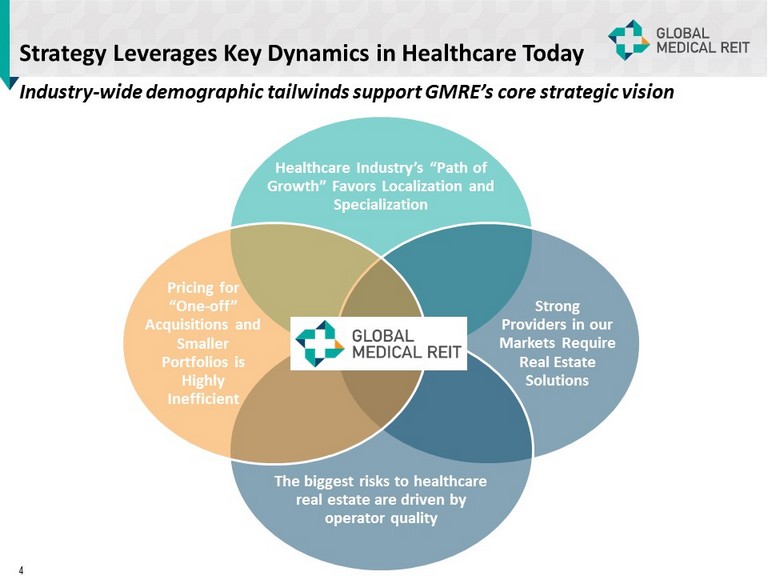
Strategy Leverages Key Dynamics in Healthcare Today Healthcare Industry’s “Path of Growth” Favors Localization and Specialization Strong Providers in our Markets Require Real Estate Solutions The biggest risks to healthcare real estate are driven by operator quality Pricing for “One - off” Acquisitions and Smaller Portfolios is Highly Inefficient Industry - wide demographic tailwinds support GMRE’s core strategic vision 4
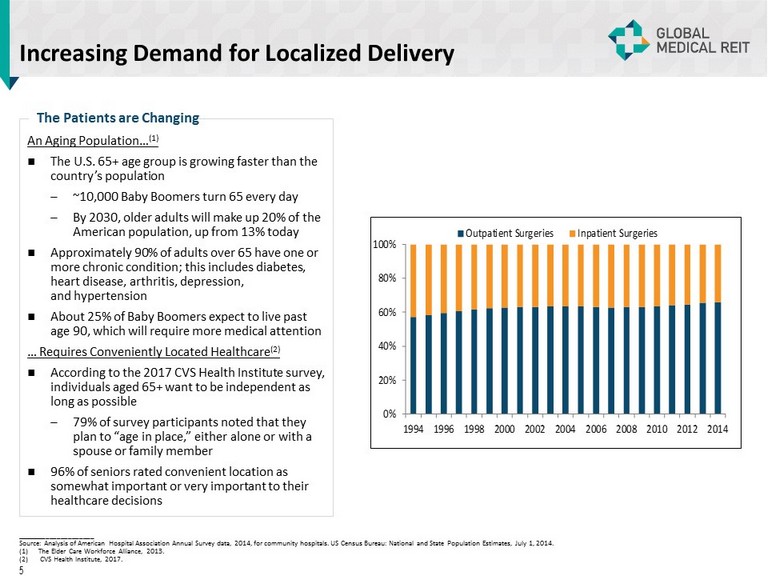
Increasing Demand for Localized Delivery 0% 20% 40% 60% 80% 100% 1994 1996 1998 2000 2002 2004 2006 2008 2010 2012 2014 Outpatient Surgeries Inpatient Surgeries An Aging Population… (1) The U.S. 65+ age group is growing faster than the country’s population – ~10,000 Baby Boomers turn 65 every day – By 2030, older adults will make up 20% of the American population, up from 13% today Approximately 90% of adults over 65 have one or more chronic condition; this includes diabetes, heart disease, arthritis, depression, and hypertension About 25% of Baby Boomers expect to live past age 90, which will require more medical attention … Requires Conveniently Located Healthcare (2) According to the 2017 CVS Health Institute survey, individuals aged 65+ want to be independent as long as possible – 79% of survey participants noted that they plan to “age in place,” either alone or with a spouse or family member 96% of seniors rated convenient location as somewhat important or very important to their healthcare decisions The Patients are Changing _____________________ Source: Analysis of American Hospital Association Annual Survey data, 2014, for community hospitals. US Census Bureau: Nation al and State Population Estimates, July 1, 2014. (1) The Elder Care Workforce Alliance, 2013. (2) CVS Health Institute, 2017. 5
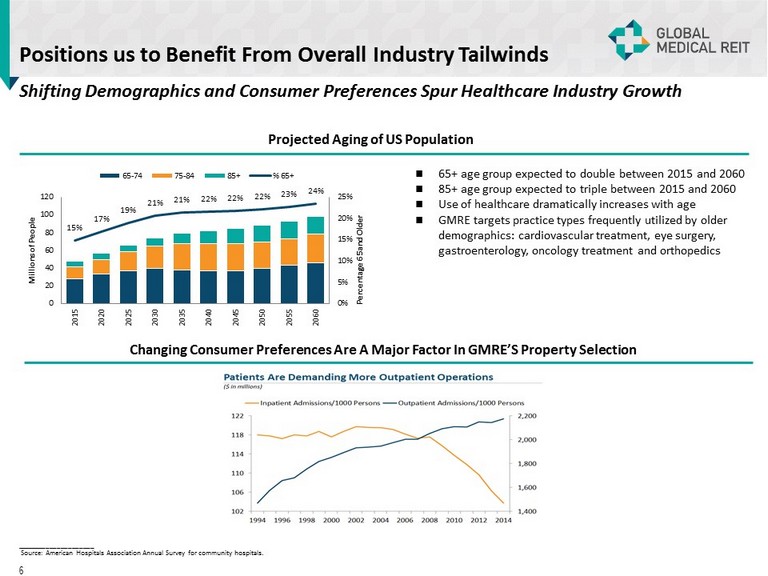
Shifting Demographics and Consumer Preferences Spur Healthcare Industry Growth Positions us to Benefit From Overall Industry Tailwinds Projected Aging of US Population 65+ age group expected to double between 2015 and 2060 85+ age group expected to triple between 2015 and 2060 Use of healthcare dramatically increases with age GMRE targets practice types frequently utilized by older demographics: cardiovascular treatment, eye surgery, gastroenterology, oncology treatment and orthopedics Changing Consumer Preferences Are A Major Factor In GMRE’S Property Selection 15% 17% 19% 21% 21% 22% 22% 22% 23% 24% 0% 5% 10% 15% 20% 25% 0 20 40 60 80 100 120 2015 2020 2025 2030 2035 2040 2045 2050 2055 2060 Percentage 65 and Older Millions of People 65-74 75-84 85+ % 65+ _____________________ Source: American Hospitals Association Annual Survey for community hospitals. 6

Disciplined Yet Opportunistic Acquisition Criteria x Strong providers with leading market share x Rent guarantees and other credit protection x Specialization in age - related procedures x Operators with regional footprints x Strong and diversified payor mix and history x Institutional quality x Purpose - built real estate x Single tenant focus with selective multi - tenant acquisitions x Class A / Recent construction or renovation x Amenitized patient areas x Convenient access / location x Long - term leases with annual rent escalations x Healthcare market with clear and quantifiable competitive dynamics x Positioned to benefit from ongoing decentralization trends in healthcare x Proximity to related resources x Long - term positive demand drivers (population growth and demographics) x Barriers to competition Tenants Facilities Markets / Locations We seek acquisition opportunities which score favorably across each of our primary assessment areas 7
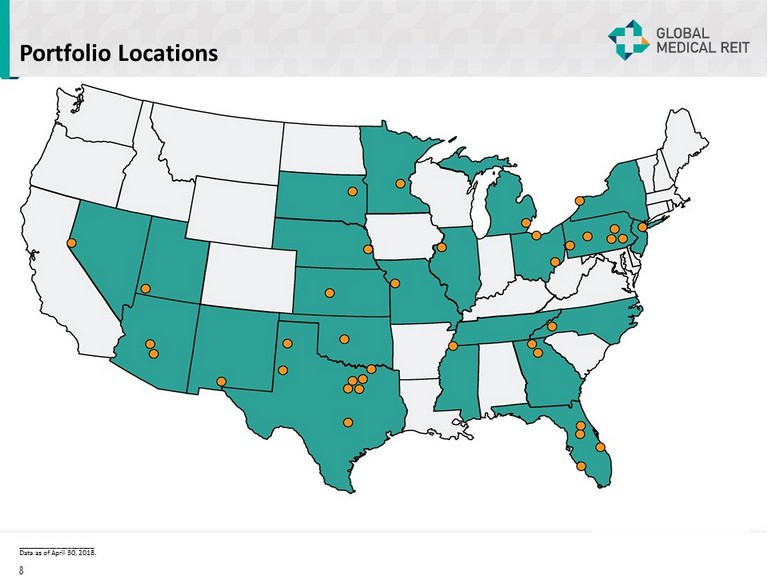
Portfolio Locations _____________________ Data as of April 30, 2018. 8
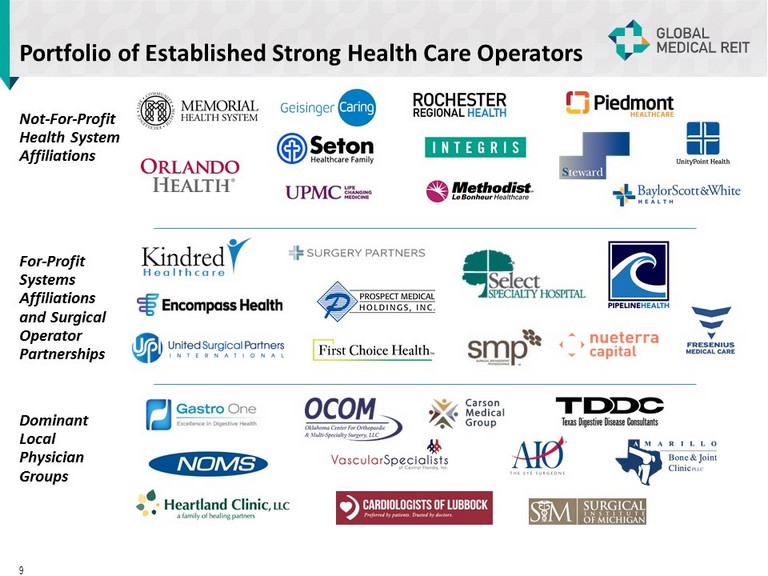
Portfolio of Established Strong Health Care Operators Not - For - Profit Health System Affiliations 9 For - Profit Systems Affiliations and Surgical Operator Partnerships Dominant Local Physician Groups
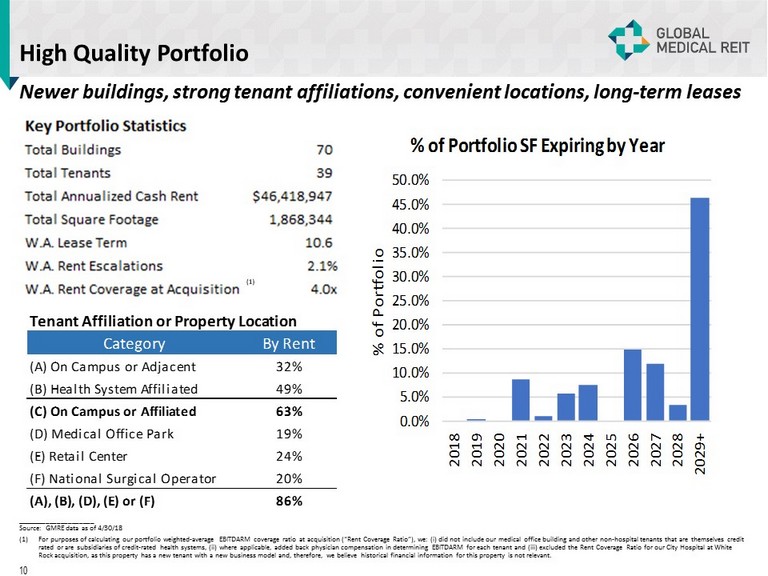
High Quality Portfolio Newer buildings, strong tenant affiliations, convenient locations, long - term leases _____________________ Source: GMRE data as of 4/30/18 (1) For purposes of calculating our portfolio weighted - average EBITDARM coverage ratio at acquisition (“Rent Coverage Ratio”), we: ( i ) did not include our medical office building and other non - hospital tenants that are themselves credit rated or are subsidiaries of credit - rated health systems, (ii) where applicable, added back physician compensation in determinin g EBITDARM for each tenant and (iii) excluded the Rent Coverage Ratio for our City Hospital at White Rock acquisition, as this property has a new tenant with a new business model and, therefore, we believe historical financial in formation for this property is not relevant. 0.0% 5.0% 10.0% 15.0% 20.0% 25.0% 30.0% 35.0% 40.0% 45.0% 50.0% 2018 2019 2020 2021 2022 2023 2024 2025 2026 2027 2028 2029+ % of Portfolio % of Portfolio SF Expiring by Year Tenant Affiliation or Property Location Category By Rent (A) On Campus or Adjacent 32% (B) Health System Affiliated 49% (C) On Campus or Affiliated 63% (D) Medical Office Park 19% (E) Retail Center 24% (F) National Surgical Operator 20% (A), (B), (D), (E) or (F) 86% 10

Portfolio Dashboard _____________________ As of 4/30/2018 (1) Monthly base rent for April 2018 multiplied by 12. 11 Encompass 11% Memorial Health 11% OCOM 8% Kindred Health 6% Carrus Hospital 5% Pipeline Health 5% Great Bend Hospital 5% Select Medical 4% Orlando Health 3% Conrad Pearson 3% All Others 39% % of Annualized Base Rent by Tenant MOB 26% MOB/ASC 14% MOB/Imaging/ER 13% IRF 23% Acute Hospital 9% Surgical Hospital 8% LTACH 4% Physical Therapy 2% All Others 1% % of Annualized Base Rent by Asset Type
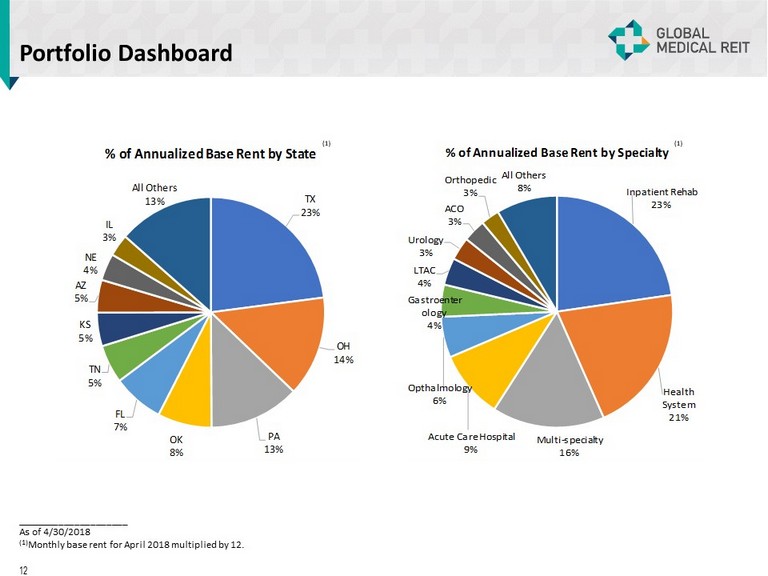
Portfolio Dashboard _____________________ As of 4/30/2018 (1) Monthly base rent for April 2018 multiplied by 12. 12 TX 23% OH 14% PA 13% OK 8% FL 7% TN 5% KS 5% AZ 5% NE 4% IL 3% All Others 13% % of Annualized Base Rent by State Inpatient Rehab 23% Health System 21% Multi - specialty 16% Acute Care Hospital 9% Opthalmology 6% Gastroenter ology 4% LTAC 4% Urology 3% ACO 3% Orthopedic 3% All Others 8% % of Annualized Base Rent by Specialty
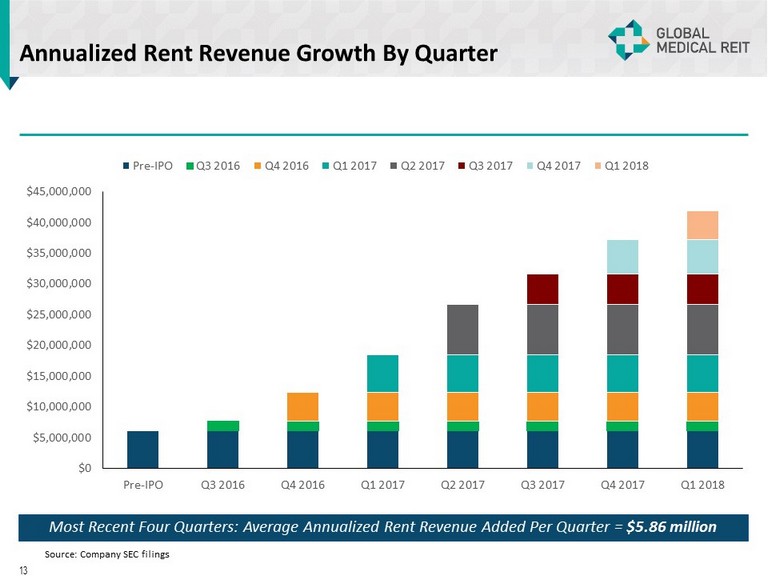
Annualized Rent Revenue Growth By Quarter $0 $5,000,000 $10,000,000 $15,000,000 $20,000,000 $25,000,000 $30,000,000 $35,000,000 $40,000,000 $45,000,000 Pre-IPO Q3 2016 Q4 2016 Q1 2017 Q2 2017 Q3 2017 Q4 2017 Q1 2018 Pre-IPO Q3 2016 Q4 2016 Q1 2017 Q2 2017 Q3 2017 Q4 2017 Q1 2018 Most Recent Four Quarters: Average Annualized Rent Revenue Added Per Quarter = $5.86 million 13 Source: Company SEC filings
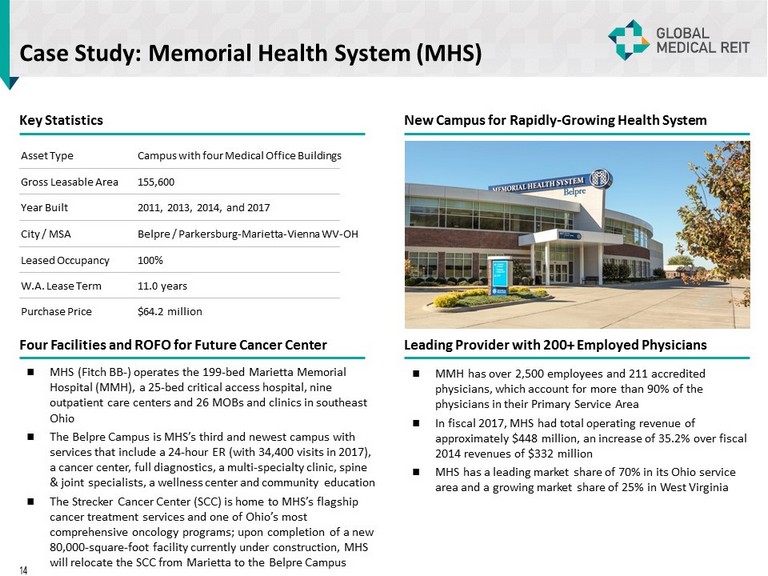
Case Study: Memorial Health System (MHS) Key Statistics New Campus for Rapidly - Growing Health System Four Facilities and ROFO for Future Cancer Center Leading Provider with 200+ Employed Physicians MHS (Fitch BB - ) operates the 199 - bed Marietta Memorial Hospital (MMH), a 25 - bed critical access hospital, nine outpatient care centers and 26 MOBs and clinics in southeast Ohio The Belpre Campus is MHS’s third and newest campus with services that include a 24 - hour ER (with 34,400 visits in 2017), a cancer center, full diagnostics, a multi - specialty clinic, spine & joint specialists, a wellness center and community education The Strecker Cancer Center (SCC) is home to MHS’s flagship cancer treatment services and one of Ohio’s most comprehensive oncology programs; upon completion of a new 80,000 - square - foot facility currently under construction, MHS will relocate the SCC from Marietta to the Belpre Campus MMH has over 2,500 employees and 211 accredited physicians, which account for more than 90% of the physicians in their Primary Service Area In fiscal 2017, MHS had total operating revenue of approximately $448 million, an increase of 35.2% over fiscal 2014 revenues of $332 million MHS has a leading market share of 70% in its Ohio service area and a growing market share of 25% in West Virginia 14 Asset Type Campus with four Medical Office Buildings Gross Leasable Area 155 ,600 Year Built 2011, 2013, 2014, and 2017 City / MSA Belpre / Parkersburg - Marietta - Vienna WV - OH Leased Occupancy 100% W.A. Lease Term 11.0 years Purchase Price $ 64 .2 million

Case Study: NOMS Sale - Leaseback Key Statistics State of the Art Facility New Facility with Existing Tenant Locally Dominant Tenant 15 Asset Type Medical Office and Imaging Center Gross Leasable Area 25,893 2018 EBITDARM / Rent 2.9 x average at purchase Leased Occupancy 100% Lease Expiration February 2030 Purchase Price $8.3 million Year Built Newly - constructed primary care clinic and imaging center located on a major thruway in Fremont, OH Build - to - suit healthcare facility tenanted by Northern Ohio Medical Specialists (NOMS) At close, NOMS entered into a 12 - year NNN lease with annual rent of $23.50 per square foot, with annual rent escalations of 2.5% GMRE acquired its first building from NOMS in October 2016 and has grown the landlord - tenant relationship to include 82,000 square feet and $19.5 million in transactions NOMS is a multi - specialty physician group with over 200 providers, 31 specialties, 24 cities in Northern Ohio Formed in 2001, NOMS has grown rapidly, experiencing double - digit annual revenue growth as it adds physicians and specialists to their group In 2013, NOMS became 1 of 35 advanced ACOs in the country and was a pioneer in the implementation of the Medicare Access and CHIP Reauthorization Act (MACRA) Since mid - 2015, NOMS grew from 60 providers to more than 200, with most of that growth in the Toledo and Cleveland areas
Leadership JEFFREY BUSCH , Chairman, Chief Executive Officer and President ▪ Over 20 years of experience in healthcare, real estate development, management and investment ▪ Former assistant to the U.S. Secretary of Housing & Urban Development ▪ United States Special Representative to United Nations in Geneva ▪ Developed large - scale residential, commercial, hospitality and retail properties ROBERT KIERNAN , Chief Financial Officer and Treasurer ▪ Over 30 years of experience in financial accounting, reporting and management, including extensive experience in SEC reportin g and Sarbanes - Oxley compliance ▪ Served as the Senior Vice President, Controller and Chief Accounting Officer of FBR & Co. (“FBR”)(NASDAQ: FBRC) beginning in Oct ober 2007 ▪ Prior role as Senior Vice President, Controller and Chief Accounting Officer of Arlington Asset Investment Corp. (NYSE: AI) ▪ Previously Senior Manager in the assurance practice at Ernst & Young ALFONZO LEON , Chief Investment Officer ▪ Over 17 years of experience in real estate finance and has completed $ 3 billion of transactions ▪ Prior experience as principal at investment advisor to pension funds and investment banker representing healthcare systems, dev elopers and REITs ▪ Healthcare real estate investment banker for Cain Brothers ▪ Acquired $ 800 million in multi - family, office, medical office, and industrial property on behalf of institutional investors while at LaSalle Investment DANICA HOLLEY, Chief Operating Officer ▪ Management and business development experience spans more than 18 years ▪ More than a decade of experience managing multinational teams for complex service delivery across disciplines ▪ More than 8 years in healthcare programs and infrastructure as Executive Director of Safe Blood International ▪ More than a decade of experience with SEC compliance and reporting matters, corporate governance, investment banking and REIT - related capital markets ▪ Served as Associate General Counsel of FBR ▪ Prior role as Senior Associate – REIT Capital Markets at Hunton & Williams LLP, where he represented public REITs in conjunction with their SEC compliance requirements, corporate governance matters, offerings of equity and debt securities and merger and acquisition transactions ▪ Previously with Sullivan & Cromwell LLP and KPMG JAMIE BARBER, General Counsel and Corporate Secretary 16

Independent Directors Majority independent Board with strong backgrounds in healthcare, real estate and capital markets Henry Cole ▪ President of Global Development International, providing development support and oversight for initiatives in medical and hea lth care programs (e.g. Instant Labs Medical Diagnostics, MedPharm & MPRC Group) ▪ Former President and Founder of international programs at The Futures Group International, a healthcare consulting firm ▪ Director of International Health and Population Programs for GE’s Center for Advanced Studies ▪ Yale (B.S.); Johns Hopkins (MA) Matthew Cypher, Ph.D. ▪ Director of the Steers Center for Global Real Estate and Atara Kaufman Professor of Real Estate at Georgetown University’s McDonough School of Business ▪ Former director at Invesco Real Estate (NYSE: IVR) where he was responsible for oversight of the Underwriting Group, which ac qui red $10.2 billion worth of institutional real estate ▪ Underwrote $1.5 billion of acquisitions and oversaw the Valuations group, which marked to market Invesco’s more than $13 bil lio n North American portfolio ▪ Penn State University (B.S.); Texas A&M University (M.S. and Ph.D.) Lori Wittman ▪ Served as the Chief Financial Officer for Care Capital Properties, Inc . (NYSE : CCP) (“Care Capital”), a publicly - traded REIT which was originally formed as a spin - off from Ventas, Inc . (NYSE : VTR) (“Ventas”) and owned over 340 healthcare properties nationwide and had an enterprise value of approximately $ 3 . 5 billion prior to its acquisition by Sabra Healthcare in August 2017 . ▪ University of Chicago (M . B . A . , Finance & Accounting) ; University of Pennsylvania (M . C . P . , Housing & Real Estate Finance) Clark University (B . A . ) Ronald Marston ▪ Founder and CEO of Health Care Corporation of America (HCCA) Management Company, originally a subsidiary of Hospital Corporation of America (HCA) ▪ 30 + years in international healthcare focused on healthcare systems with prior experience developing the Twelfth Evacuation Hospital in Vietnam ▪ Tennessee Technological University (B . S . ) ; California Western University (Ph . D . ) ▪ Rear Admiral (Retired) and Chief Veterinary Medical Officer of United States Public Health Service ▪ Former Assistant United States Surgeon General, point person for global development support with a focus on less developed countries ▪ Epidemic Intelligence Service Officer with the U . S . Centers for Disease Control and Prevention (CDC) ▪ Chief epidemiologist with the Centers of Devices and Radiological Health in the US Food and Drug Administration (FDA) ▪ Tuskegee University (B . S . & DVM) ; University in Michigan (M . P . H . ) ; Johns Hopkins University (Ph . D . ) Dr. Roscoe Moore 17

Interested Directors Jeffrey Busch, Chairman ▪ Over 20 years of experience in healthcare, real estate development, management and investment ▪ Former assistant to the U.S. Secretary of Housing & Urban Development ▪ United States Special Representative to United Nations in Geneva ▪ Developed large - scale residential, commercial, hospitality and retail properties Zhang Jingguo , Director ▪ Approximately 20 years experience in real estate development in China ▪ Serves as President of Henan Real Estate Chamber of Commerce ▪ Co - founder of Henan Zensun Real Estate, one of the top 100 property development companies in China ▪ Honored with many awards as an outstanding developer and contributor to the Henan real estate industry ▪ Supervisor for Henan Hongguang Real Estate Limited, a company engaged in property development in China ▪ Supervisor for Henan Zensun Corporate Development Company Limited, a company engaged in construction and management in China ▪ University College London (B . S) ; Beijing Forestry University (B . S) ; University of Leicester (MA) ; Zhang Huiqi , Director 18
APPENDIX 19
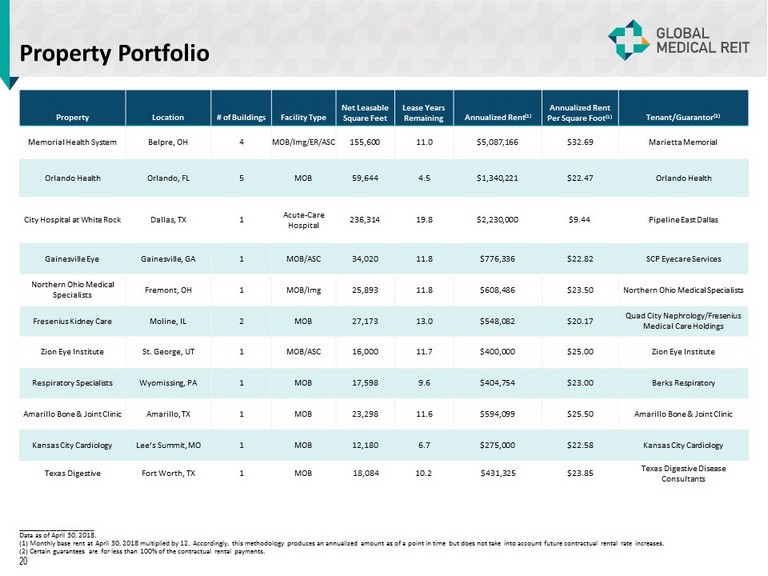
Property Portfolio _____________________ Data as of April 30, 2018. (1) Monthly base rent at April 30, 2018 multiplied by 12 . Accordingly, this methodology produces an annualized amount as of a point in time but does not take into account future co ntr actual rental rate increases. (2) Certain guarantees are for less than 100% of the contractual rental payments. 20 Property Location # of Buildings Facility Type Net Leasable Square Feet Lease Years Remaining Annualized Rent (1) Annualized Rent Per Square Foot (1) Tenant/Guarantor (2) Memorial Health System Belpre, OH 4 MOB/ Img /ER/ASC 155,600 11.0 $5,087,166 $32.69 Marietta Memorial Orlando Health Orlando, FL 5 MOB 59,644 4.5 $1,340,221 $22.47 Orlando Health City Hospital at White Rock Dallas, TX 1 Acute - Care Hospital 236,314 19.8 $2,230,000 $9.44 Pipeline East Dallas Gainesville Eye Gainesville, GA 1 MOB/ASC 34,020 11.8 $776,336 $22.82 SCP Eyecare Services Northern Ohio Medical Specialists Fremont, OH 1 MOB/ Img 25,893 11.8 $608,486 $23.50 Northern Ohio Medical Specialists Fresenius Kidney Care Moline, IL 2 MOB 27,173 13.0 $548,082 $20.17 Quad City Nephrology/Fresenius Medical Care Holdings Zion Eye Institute St. George, UT 1 MOB/ASC 16,000 11.7 $400,000 $25.00 Zion Eye Institute Respiratory Specialists Wyomissing, PA 1 MOB 17,598 9.6 $404,754 $23.00 Berks Respiratory Amarillo Bone & Joint Clinic Amarillo, TX 1 MOB 23,298 11.6 $594,099 $25.50 Amarillo Bone & Joint Clinic Kansas City Cardiology Lee’s Summit, MO 1 MOB 12,180 6.7 $275,000 $22.58 Kansas City Cardiology Texas Digestive Fort Worth, TX 1 MOB 18,084 10.2 $431,325 $23.85 Texas Digestive Disease Consultants

Property Portfolio Property Location # of Buildings Facility Type Net Leasable Square Feet Lease Years Remaining Annualized Rent (1) Annualized Rent Per Square Foot (1) Tenant/Guarantor (2) Albertville Medical Building Albertville, MN 1 MOB 21,486 10.7 $481,072 $22.39 Stellis Health Heartland Clinic Moline, IL 1 MOB/ASC 34,020 15.2 $891,601 $26.21 Heartland Clinic Central Texas Rehabilitation Clinic Austin, TX 1 IRF 59,258 9.0 $2,884,650 $48.68 CTRH, LLC / Kindred Health Conrad Pearson Clinic Germantown, TN 1 MOB/ASC 33,777 6.0 $1,488,205 $44.06 Urology Center of the South/Physician guarantees Cardiologists of Lubbock Lubbock, TX 1 MOB 27,280 11.3 $600,160 $22.00 Lubbock Heart Hospital/Surgery Partners, Inc. Carrus Specialty Hospital Sherman, TX 1 IRF/LTACH 69,352 (3) 19.2 $2,346,140 $33.83 SDB Partners, LLC Lonestar Endoscopy Flower Mound, TX 1 ASC 10,062 8.4 $294,129 $29.23 Lonestar Endoscopy Center, LLC Unity Family Medicine Brockport, NY 1 MOB 29,497 12.6 $620,653 $21.04 Unity Hospital of Rochester Great Bend Regional Hospital Great Bend, KS 1 Acute Hospital 63,978 13.9 $2,186,625 $34.18 Great Bend Regional Hospital, LLC/ Nueterra Holdings, LLC, physician guarantees Oklahoma Center for Orthopedic & Multi - Specialty Surgery Oklahoma City, OK 3 Surgical Hospital/ Physical Therapy/ASC 97,406 15.0 $3,561,153 $36.56 OCOM/INTEGRIS; USPI; physician guaranty Southlake Heart & Vascular Institute Clermont, FL 1 MOB 18,152 4.5 $368,716 $20.31 Orlando Health, Southlake Hospital, Vascular Specialists of Central Florida _____________________ Data as of April 30, 2018. (1) Monthly base rent at April 30, 2018 multiplied by 12 . Accordingly, this methodology produces an annualized amount as of a point in time but does not take into account future co ntr actual rental rate increases. (2) Certain guarantees are for less than 100% of the contractual rental payments. (3) Does not include 12,000 square feet of shell space. 21

Property Portfolio Property Location # of Buildings Facility Type Net Leasable Square Feet Lease Years Remaining Annualized Rent (1) Annualized Rent Per Square Foot (1) Tenant/Guarantor (2) Thumb Butte Medical Center Prescott, AZ 1 MOB 12,000 8.8 $370,800 $30.90 Thumb Butte Medical Center /Physician Guaranty Las Cruces Orthopedic Las Cruces, NM 1 MOB 15,761 10.8 $361,715 $22.95 Las Cruces Orthopedic Associates Geisinger Specialty Care Lewisburg, PA 1 MOB/ Img 28,480 5.0 $544,230 $19.11 Geisinger Health Southwest Florida Neurological & Rehab Cape Coral, FL 1 MOB 25,814 8.8 $539,771 $20.91 Southwest Florida Neurosurgical Associates Encompass Mechanicsburg Mechanicsburg, PA 1 IRF 78,836 3.0 $1,877,298 $23.81 Encompass Encompass Altoona Altoona, PA 1 IRF 70,007 3.0 $1,671,760 $23.88 Encompass Encompass Mesa Mesa, AZ 1 IRF 51,903 6.5 $1,761,936 $33.95 Encompass Piedmont Healthcare Ellijay, GA 3 MOB 44,162 8.2 $364,224 $8.25 Piedmont Mountainside Hospital, Inc. Carson Medical Group Clinic Carson City, NV 2 MOB 20,632 5.5 $354,320 $17.17 Carson Medical Group Northern Ohio Medical Specialists Sandusky, OH 8 MOB 55,760 9.5 $863,544 $15.49 Northern Ohio Medical Specialists Brown Clinic Watertown, SD 3 MOB/ Img 46,646 13.4 $721,310 $15.46 Brown Clinic East Orange General Hospital East Orange, NJ 1 MOB 60,442 8.4 $961,753 $15.91 Prospect Medical Holdings, Inc. _____________________ Data as of April 30, 2018. (1) Monthly base rent at April 30, 2018 multiplied by 12 . Accordingly, this methodology produces an annualized amount as of a point in time but does not take into account future co ntr actual rental rate increases. (2) Certain guarantees are for less than 100% of the contractual rental payments. 22
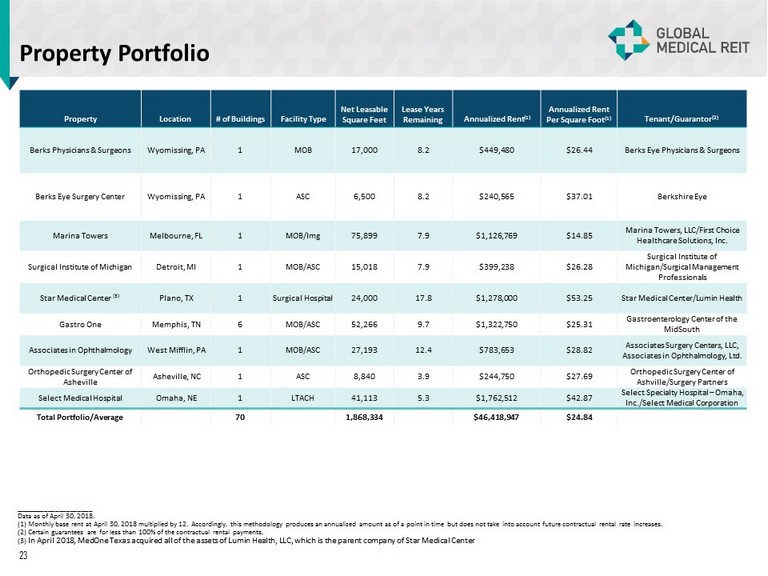
Property Portfolio _____________________ Data as of April 30, 2018. (1) Monthly base rent at April 30, 2018 multiplied by 12 . Accordingly, this methodology produces an annualized amount as of a point in time but does not take into account future co ntr actual rental rate increases. (2) Certain guarantees are for less than 100% of the contractual rental payments. (3) In April 2018, MedOne Texas acquired all of the assets of Lumin Health, LLC, which is the parent company of Star Medical Center 23 Property Location # of Buildings Facility Type Net Leasable Square Feet Lease Years Remaining Annualized Rent (1) Annualized Rent Per Square Foot (1) Tenant/Guarantor (2) Berks Physicians & Surgeons Wyomissing, PA 1 MOB 17,000 8.2 $449,480 $26.44 Berks Eye Physicians & Surgeons Berks Eye Surgery Center Wyomissing, PA 1 ASC 6,500 8.2 $240,565 $37.01 Berkshire Eye Marina Towers Melbourne, FL 1 MOB/Img 75,899 7.9 $1,126,769 $14.85 Marina Towers, LLC/First Choice Healthcare Solutions, Inc. Surgical Institute of Michigan Detroit, MI 1 MOB/ASC 15,018 7.9 $399,238 $26.28 Surgical Institute of Michigan/Surgical Management Professionals Star Medical Center (3) Plano, TX 1 Surgical Hospital 24,000 17.8 $1,278,000 $53.25 Star Medical Center/Lumin Health Gastro One Memphis, TN 6 MOB/ASC 52,266 9.7 $1,322,750 $25.31 Gastroenterology Center of the MidSouth Associates in Ophthalmology West Mifflin, PA 1 MOB/ASC 27,193 12.4 $783,653 $28.82 Associates Surgery Centers, LLC, Associates in Ophthalmology, Ltd. Orthopedic Surgery Center of Asheville Asheville, NC 1 ASC 8,840 3.9 $244,750 $27.69 Orthopedic Surgery Center of Ashville/Surgery Partners Select Medical Hospital Omaha, NE 1 LTACH 41,113 5.3 $1,762,512 $42.87 Select Specialty Hospital – Omaha, Inc./Select Medical Corporation Total Portfolio/Average 70 1,868,334 $46,418,947 $24.84

Consolidated Statements of Operations (unaudited, in thousands, except per share amounts) 24 Three Months Ended March 31, 2018 2017 Revenue Rental revenue $ 10,488 $ 4,629 Expense recoveries 1,068 - Other income 8 30 Total revenue 11,564 4,659 Expenses Acquisition fees 117 942 General and administrative 1,005 1,595 Operating expenses 1,105 23 Management fees – related party 1,081 627 Depreciation expense 2,906 1,346 Amortization expense 765 344 Interest expense 2,684 1,100 Total expenses 9,663 5,977 Net income (loss) $ 1,901 $ (1,318) Less: Preferred stock dividends (1,455) - Less: Net income attributable to noncontrolling interest (35) - Net income (loss) attributable to common stockholders $ 411 $ (1,318) Net income (loss) attributable to common stockholders per share – basic and diluted $ 0.02 $ (0.07) Weighted average shares outstanding – Basic and Diluted 21,631 17,606
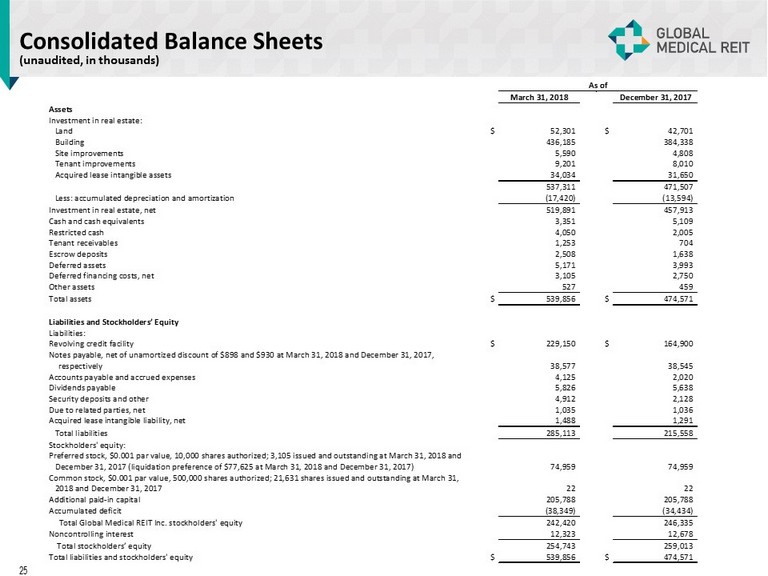
Consolidated Balance Sheets (unaudited, in thousands) 25 As of March 31, 2018 December 31, 2017 Assets Investment in real estate: Land $ 52,301 $ 42,701 Building 436,185 384,338 Site improvements 5,590 4,808 Tenant improvements 9,201 8,010 Acquired lease intangible assets 34,034 31,650 537,311 471,507 Less: accumulated depreciation and amortization (17,420) (13,594) Investment in real estate, net 519,891 457,913 Cash and cash equivalents 3,351 5,109 Restricted cash 4,050 2,005 Tenant receivables 1,253 704 Escrow deposits 2,508 1,638 Deferred assets 5,171 3,993 Deferred financing costs, net 3,105 2,750 Other assets 527 459 Total assets $ 539,856 $ 474,571 Liabilities and Stockholders’ Equity Liabilities: Revolving credit facility $ 229,150 $ 164,900 Notes payable, net of unamortized discount of $898 and $930 at March 31, 2018 and December 31, 2017, respectively 38,577 38,545 Accounts payable and accrued expenses 4,125 2,020 Dividends payable 5,826 5,638 Security deposits and other 4,912 2,128 Due to related parties, net 1,035 1,036 Acquired lease intangible liability, net 1,488 1,291 Total liabilities 285,113 215,558 Stockholders' equity: Preferred stock, $0.001 par value, 10,000 shares authorized; 3,105 issued and outstanding at March 31, 2018 and December 31, 2017 (liquidation preference of $77,625 at March 31, 2018 and December 31, 2017) 74,959 74,959 Common stock, $0.001 par value, 500,000 shares authorized; 21,631 shares issued and outstanding at March 31, 2018 and December 31, 2017 22 22 Additional paid-in capital 205,788 205,788 Accumulated deficit (38,349) (34,434) Total Global Medical REIT Inc. stockholders' equity 242,420 246,335 Noncontrolling interest 12,323 12,678 Total stockholders’ equity 254,743 259,013 Total liabilities and stockholders' equity $ 539,856 $ 474,571

Reconciliation of FFO and AFFO (unaudited, in thousands, except per share amounts) 26 Three Months Ended March 31, 2018 2017 Net income (loss) $ 1,901 $ (1,318) (1) (1 ) Less: Preferred stock dividends (1,455) - Depreciation and amortization expense 3,671 1,690 Amortization of above (below) market leases 113 (8) FFO $ 4,230 $ 364 Acquisition fees 117 942 Straight line deferred rental revenue (1,173) (383) Stock-based compensation expense 182 420 Amortization of deferred financing costs 430 159 AFFO $ 3,786 $ 1,502 Net income (loss) attributable to common stockholders per share – basic and diluted $ 0.02 $ (0.07) FFO per Share $ 0.18 $ 0.02 AFFO per Share $ 0.16 $ 0.09 Weighted Average Shares and Units Outstanding – basic and diluted 23,384 17,606 Reconciliation of Weighted Average Shares and Units Outstanding: Weighted Average Common Shares 21,631 17,606 Weighted Average OP Units 1,246 - Weighted Average LTIP Units 507 - Weighted Average Shares and Units Outstanding – basic and diluted 23,384 17,606 (1) This amount reflects the correction of $1,223 of costs incurred in connection with the Company’s amended revolving credit fac ili ty that were erroneously expensed and included in the General and Administrative line item within the Company’s Consolidated Statemen t o f Operations for the three months ended March 31, 2017.