Exhibit 99.1
Fourth Quarter 2018 Earnings Results and Operating Information Three Months and Year Ended December 31, 2018 www.globalmedicalreit.com NYSE: GMRE
2 Table of Contents Financial Highlights 3 Financial Review 5 Consolidated Balance Sheets 6 Consolidated Statements of Operations 7 Consolidated Statements of Cash Flows 8 Reconciliation of Non - GAAP Measures for Funds from Operations (FFO) and Adjusted Funds From Operations (AFFO) 9 Acquisitions 10 Operating Metrics 11 Top 10 Tenant Profiles 12 Real Estate Portfolio 13 About Global Medical REIT Inc. (NYSE: GMRE) 15 Disclosures 16 Forward - Looking Statements Certain statements contained herein may be considered “forward - looking statements” within the meaning of the Private Securities Litigation Reform Act of 1995 , and it is the Company’s intent that any such statements be protected by the safe harbor created thereby . These forward - looking statements are identified by their use of terms and phrases such as "anticipate," "believe," "could," "estimate," "expect," "intend," "may," "should," "plan," "predict," "project," "will," "continue" and other similar terms and phrases, including references to assumptions and forecasts of future results . Except for historical information, the statements set forth herein including, but not limited to, any statements regarding our earnings, expected financial performance (including future cash flows associated with new tenants), future dividends or other financial items ; any other statements concerning our plans, strategies, objectives and expectations for future operations, our pipeline of acquisition opportunities and expected acquisition activity, including the timing and/or successful completion of any acquisitions and expected rent receipts on these properties ; facility sale or expected sale activity, including the timing and/or successful completion of any sales and expected proceeds and tax impact of the sales, and any statements regarding future economic conditions or performance are forward - looking statements . These forward - looking statements are based on our current expectations, estimates and assumptions and are subject to certain risks and uncertainties . Although the Company believes that the expectations, estimates and assumptions reflected in its forward - looking statements are reasonable, actual results could differ materially from those projected or assumed in any of the Company’s forward - looking statements . Additional information concerning us and our business, including additional factors that could materially and adversely affect our financial results, include, without limitation, the risks described under Part I, Item 1 A - Risk Factors, in our Annual Report on Form 10 - K, our Quarterly Reports on Form 10 - Q, and in our other filings with the United States Securities and Exchange Commission (“SEC”) . You are cautioned not to place undue reliance on forward - looking statements . The Company does not intend, and undertakes no obligation, to update any forward - looking statement . Fourth Quarter 2018 Earnings Call and Webcast Date Thursday, March 7, 2019 Time 9:00 a.m. Eastern Time Dial - In 1 - 877 - 407 - 3948: Domestic / 201 - 389 - 0865: International / Reference: Global Medical REIT Inc. Webcast Located on the “Investor Relations” section of the Company’s website at www.globalmedicalreit.com or by clicking on the conference call link: https://78449.themediaframe.com/dataconf/productusers/gmre/mediaframe/28752/indexl.html Replay An audio replay of the conference call will be posted on the Company’s website. 4Q & YE 2018 | Earnings Results and Operating Information
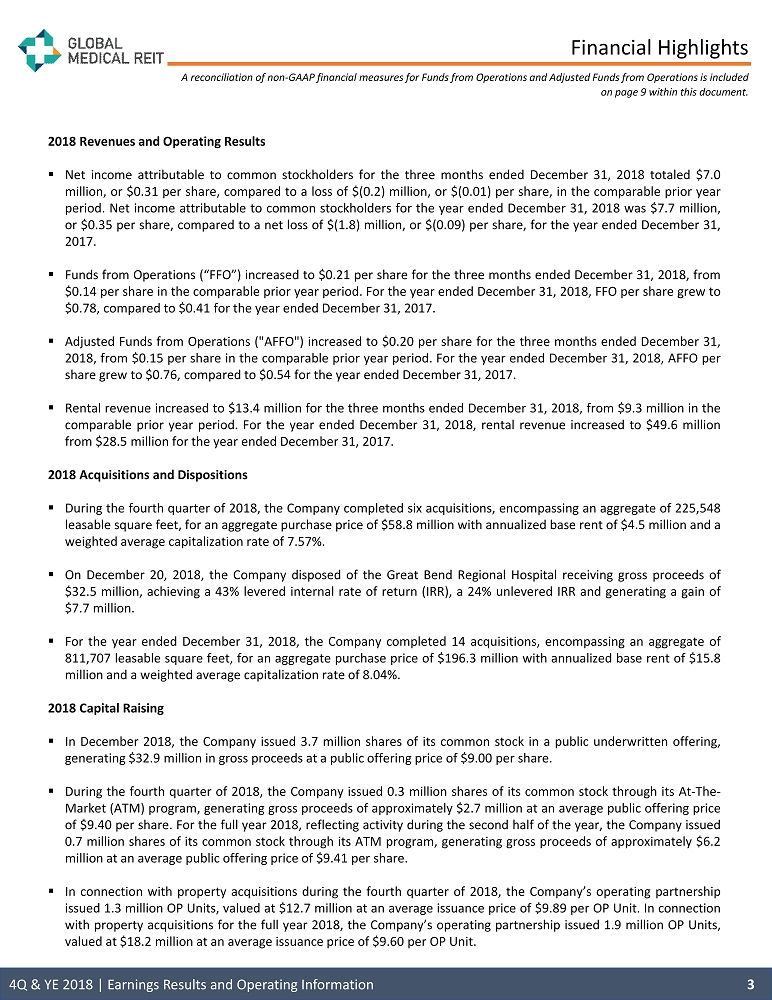
Financial Highlights A reconciliation of non - GAAP financial measures for Funds from Operations and Adjusted Funds from Operations is included on page 9 within this document. 3 4Q & YE 2018 | Earnings Results and Operating Information 2018 Revenues and Operating Results ▪ Net income attributable to common stockholders for the three months ended December 31 , 2018 totaled $ 7 . 0 million, or $ 0 . 31 per share, compared to a loss of $ ( 0 . 2 ) million, or $ ( 0 . 01 ) per share, in the comparable prior year period . Net income attributable to common stockholders for the year ended December 31 , 2018 was $ 7 . 7 million, or $ 0 . 35 per share, compared to a net loss of $ ( 1 . 8 ) million, or $ ( 0 . 09 ) per share, for the year ended December 31 , 2017 . ▪ Funds from Operations (“FFO”) increased to $ 0 . 21 per share for the three months ended December 31 , 2018 , from $ 0 . 14 per share in the comparable prior year period . For the year ended December 31 , 2018 , FFO per share grew to $ 0 . 78 , compared to $ 0 . 41 for the year ended December 31 , 2017 . ▪ Adjusted Funds from Operations ("AFFO") increased to $ 0 . 20 per share for the three months ended December 31 , 2018 , from $ 0 . 15 per share in the comparable prior year period . For the year ended December 31 , 2018 , AFFO per share grew to $ 0 . 76 , compared to $ 0 . 54 for the year ended December 31 , 2017 . ▪ Rental revenue increased to $ 13 . 4 million for the three months ended December 31 , 2018 , from $ 9 . 3 million in the comparable prior year period . For the year ended December 31 , 2018 , rental revenue increased to $ 49 . 6 million from $ 28 . 5 million for the year ended December 31 , 2017 . 2018 Acquisitions and Dispositions ▪ During the fourth quarter of 2018 , the Company completed six acquisitions, encompassing an aggregate of 225 , 548 leasable square feet, for an aggregate purchase price of $ 58 . 8 million with annualized base rent of $ 4 . 5 million and a weighted average capitalization rate of 7 . 57 % . ▪ On December 20 , 2018 , the Company disposed of the Great Bend Regional Hospital receiving gross proceeds of $ 32 . 5 million, achieving a 43 % levered internal rate of return (IRR), a 24 % unlevered IRR and generating a gain of $ 7 . 7 million . ▪ For the year ended December 31 , 2018 , the Company completed 14 acquisitions, encompassing an aggregate of 811 , 707 leasable square feet, for an aggregate purchase price of $ 196 . 3 million with annualized base rent of $ 15 . 8 million and a weighted average capitalization rate of 8 . 04 % . 2018 Capital Raising ▪ In December 2018 , the Company issued 3 . 7 million shares of its common stock in a public underwritten offering, generating $ 32 . 9 million in gross proceeds at a public offering price of $ 9 . 00 per share . ▪ During the fourth quarter of 2018 , the Company issued 0 . 3 million shares of its common stock through its At - The - Market (ATM) program, generating gross proceeds of approximately $ 2 . 7 million at an average public offering price of $ 9 . 40 per share . For the full year 2018 , reflecting activity during the second half of the year, the Company issued 0 . 7 million shares of its common stock through its ATM program, generating gross proceeds of approximately $ 6 . 2 million at an average public offering price of $ 9 . 41 per share . ▪ In connection with property acquisitions during the fourth quarter of 2018 , the Company’s operating partnership issued 1 . 3 million OP Units, valued at $ 12 . 7 million at an average issuance price of $ 9 . 89 per OP Unit . In connection with property acquisitions for the full year 2018 , the Company’s operating partnership issued 1 . 9 million OP Units, valued at $ 18 . 2 million at an average issuance price of $ 9 . 60 per OP Unit .
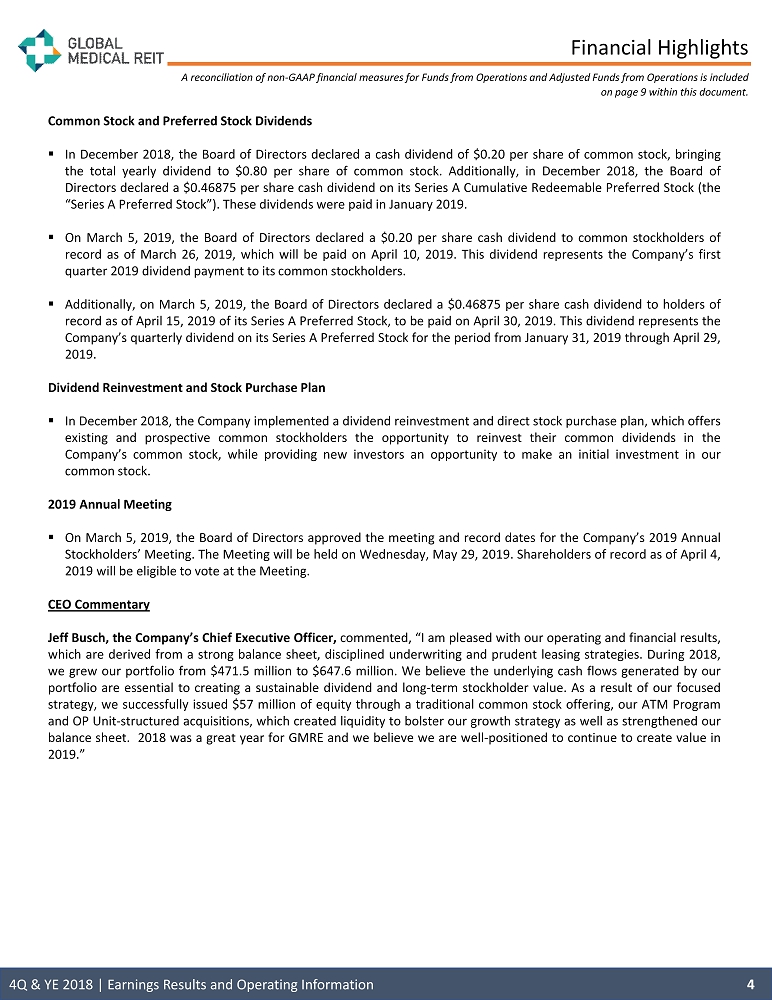
Financial Highlights 4 4Q & YE 2018 | Earnings Results and Operating Information Common Stock and Preferred Stock Dividends ▪ In December 2018 , the Board of Directors declared a cash dividend of $ 0 . 20 per share of common stock, bringing the total yearly dividend to $ 0 . 80 per share of common stock . Additionally, in December 2018 , the Board of Directors declared a $ 0 . 46875 per share cash dividend on its Series A Cumulative Redeemable Preferred Stock (the “Series A Preferred Stock”) . These dividends were paid in January 2019 . ▪ On March 5 , 2019 , the Board of Directors declared a $ 0 . 20 per share cash dividend to common stockholders of record as of March 26 , 2019 , which will be paid on April 10 , 2019 . This dividend represents the Company’s first quarter 2019 dividend payment to its common stockholders . ▪ Additionally, on March 5 , 2019 , the Board of Directors declared a $ 0 . 46875 per share cash dividend to holders of record as of April 15 , 2019 of its Series A Preferred Stock, to be paid on April 30 , 2019 . This dividend represents the Company’s quarterly dividend on its Series A Preferred Stock for the period from January 31 , 2019 through April 29 , 2019 . Dividend Reinvestment and Stock Purchase Plan ▪ In December 2018 , the Company implemented a dividend reinvestment and direct stock purchase plan, which offers existing and prospective common stockholders the opportunity to reinvest their common dividends in the Company’s common stock, while providing new investors an opportunity to make an initial investment in our common stock . 2019 Annual Meeting ▪ On March 5 , 2019 , the Board of Directors approved the meeting and record dates for the Company’s 2019 Annual Stockholders’ Meeting . The Meeting will be held on Wednesday, May 29 , 2019 . Shareholders of record as of April 4 , 2019 will be eligible to vote at the Meeting . CEO Commentary Jeff Busch, the Company’s Chief Executive Officer, commented, “I am pleased with our operating and financial results, which are derived from a strong balance sheet, disciplined underwriting and prudent leasing strategies . During 2018 , we grew our portfolio from $ 471 . 5 million to $ 647 . 6 million . We believe the underlying cash flows generated by our portfolio are essential to creating a sustainable dividend and long - term stockholder value . As a result of our focused strategy, we successfully issued $ 57 million of equity through a traditional common stock offering, our ATM Program and OP Unit - structured acquisitions, which created liquidity to bolster our growth strategy as well as strengthened our balance sheet . 2018 was a great year for GMRE and we believe we are well - positioned to continue to create value in 2019 . ” A reconciliation of non - GAAP financial measures for Funds from Operations and Adjusted Funds from Operations is included on page 9 within this document.
Financial Review Fourth Quarter ▪ Rental revenue for the three months ended December 31 , 2018 increased to $ 13 . 4 million, compared to $ 9 . 3 million for the comparable prior year period . This increase was primarily the result of the Company’s larger property portfolio compared to the prior year period . ▪ Total expenses for the three months ended December 31 , 2018 were $ 12 . 5 million, compared to $ 8 . 6 million for the comparable prior year period . This increase was primarily the result of the Company’s larger portfolio compared to the prior year period . ▪ General and administrative expenses increased to $ 1 . 4 million in the fourth quarter, compared to $ 1 . 1 million in the comparable prior year period . The increase results from an increase in non - cash LTIP compensation expense . LTIP compensation expense was $ 0 . 7 million for the three months ended December 31 , 2018 , compared to $ 0 . 3 million for the same period in 2017 . ▪ Interest expense for the three months ended December 31 , 2018 was $ 4 . 3 million, compared to $ 2 . 2 million for the comparable prior year period . This increase is primarily due to higher average borrowings during the quarter compared to the same quarter last year, the proceeds of which were used to finance our property acquisitions, and also reflects higher interest rates . ▪ On December 20 , 2018 , the Company disposed of the Great Bend Regional Hospital receiving gross proceeds of $ 32 . 5 million, resulting in a gain of approximately $ 7 . 7 million . Full Year ▪ Rental revenue for the year ended December 31 , 2018 increased to $ 49 . 6 million, compared to $ 28 . 5 million for the prior year . The year - over - year growth in rental revenue was largely driven by the significantly increased size of the Company’s property portfolio . ▪ Total expenses for the year ended December 31 , 2018 were $ 46 . 3 million, compared with $ 30 . 4 million in the prior year . The year - over - year growth in total expenses was largely driven by the significantly increased size of the Company’s property portfolio . ▪ General and administrative expenses were $ 5 . 5 million for the year ended December 31 , 2018 , which was unchanged from the prior year . An increase in non - cash LTIP compensation expense was offset by a decrease in public company costs and other professional fees . LTIP compensation expense was $ 2 . 7 million for the year ended December 31 , 2018 , compared to $ 1 . 8 million for the same period in 2017 . ▪ Interest expense for the year ended December 31 , 2018 was $ 15 . 0 million, compared to $ 7 . 4 million for the prior year . This increase is primarily due to higher average borrowings during the 2018 period compared to the prior year, the proceeds of which were used to finance our property acquisitions, and also reflects higher interest rates . Balance Sheet Summary ▪ Cash and cash equivalents were $ 3 . 6 million as of December 31 , 2018 , compared to $ 5 . 1 million as of December 31 , 2017 . ▪ Gross investment in real estate as of December 31 , 2018 was $ 647 . 6 million, compared to $ 471 . 5 million as of December 31 , 2017 . ▪ Total debt, which includes outstanding borrowings on the credit facility and notes payable (both net of unamortized deferred financing costs), was $ 315 . 0 million as of December 31 , 2018 , compared to $ 200 . 7 million as of December 31 , 2017 . ▪ The weighted average interest rate and term of our debt was 4 . 64 % and 4 . 24 years, respectively, at December 31 , 2018 . 4Q & YE 2018 | Earnings Results and Operating Information 5 A reconciliation of non - GAAP financial measures for Funds from Operations and Adjusted Funds from Operations is included on page 9 within this document.
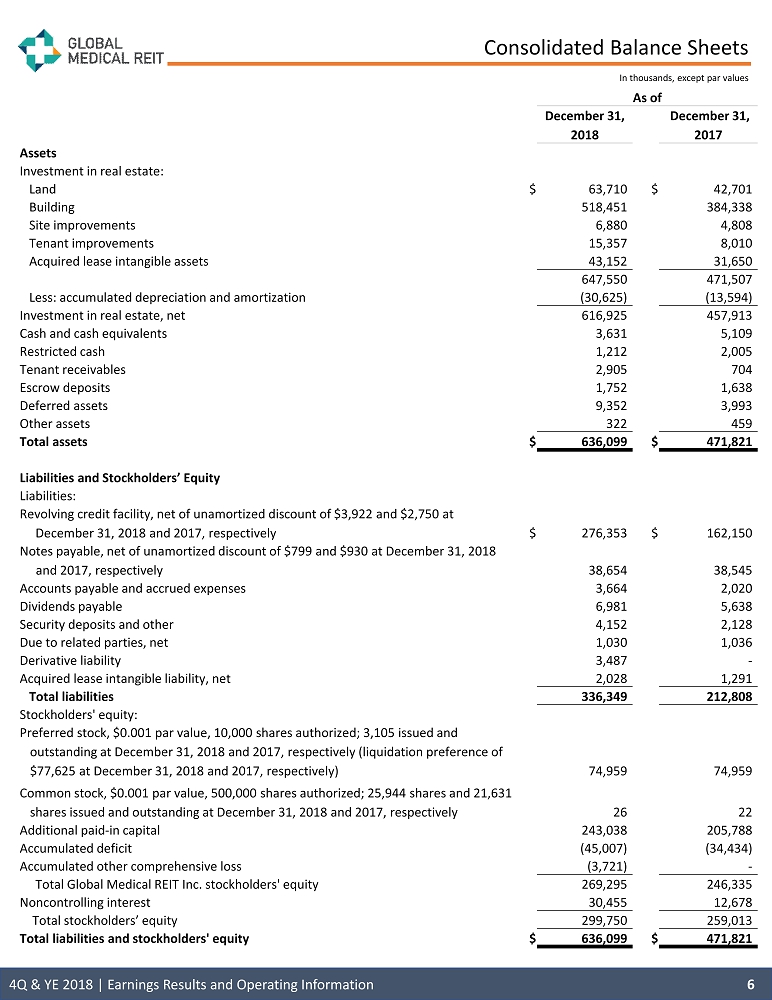
Consolidated Balance Sheets In thousands, except par values 6 As of December 31, 2018 December 31, 2017 Assets Investment in real estate: Land $ 63,710 $ 42,701 Building 518,451 384,338 Site improvements 6,880 4,808 Tenant improvements 15,357 8,010 Acquired lease intangible assets 43,152 31,650 647,550 471,507 Less: accumulated depreciation and amortization (30,625) (13,594) Investment in real estate, net 616,925 457,913 Cash and cash equivalents 3,631 5,109 Restricted cash 1,212 2,005 Tenant receivables 2,905 704 Escrow deposits 1,752 1,638 Deferred assets 9,352 3,993 Other assets 322 459 Total assets $ 636,099 $ 471,821 Liabilities and Stockholders’ Equity Liabilities: Revolving credit facility, net of unamortized discount of $3,922 and $2,750 at December 31, 2018 and 2017, respectively $ 276,353 $ 162,150 Notes payable, net of unamortized discount of $799 and $930 at December 31, 2018 and 2017, respectively 38,654 38,545 Accounts payable and accrued expenses 3,664 2,020 Dividends payable 6,981 5,638 Security deposits and other 4,152 2,128 Due to related parties, net 1,030 1,036 Derivative liability 3,487 - Acquired lease intangible liability, net 2,028 1,291 Total liabilities 336,349 212,808 Stockholders' equity: Preferred stock, $0.001 par value, 10,000 shares authorized; 3,105 issued and outstanding at December 31, 2018 and 2017, respectively (liquidation preference of $77,625 at December 31, 2018 and 2017, respectively) 74,959 74,959 Common stock, $0.001 par value, 500,000 shares authorized; 25,944 shares and 21,631 shares issued and outstanding at December 31, 2018 and 2017, respectively 26 22 Additional paid - in capital 243,038 205,788 Accumulated deficit (45,007) (34,434) Accumulated other comprehensive loss (3,721) - Total Global Medical REIT Inc. stockholders' equity 269,295 246,335 Noncontrolling interest 30,455 12,678 Total stockholders’ equity 299,750 259,013 Total liabilities and stockholders' equity $ 636,099 $ 471,821 4Q & YE 2018 | Earnings Results and Operating Information
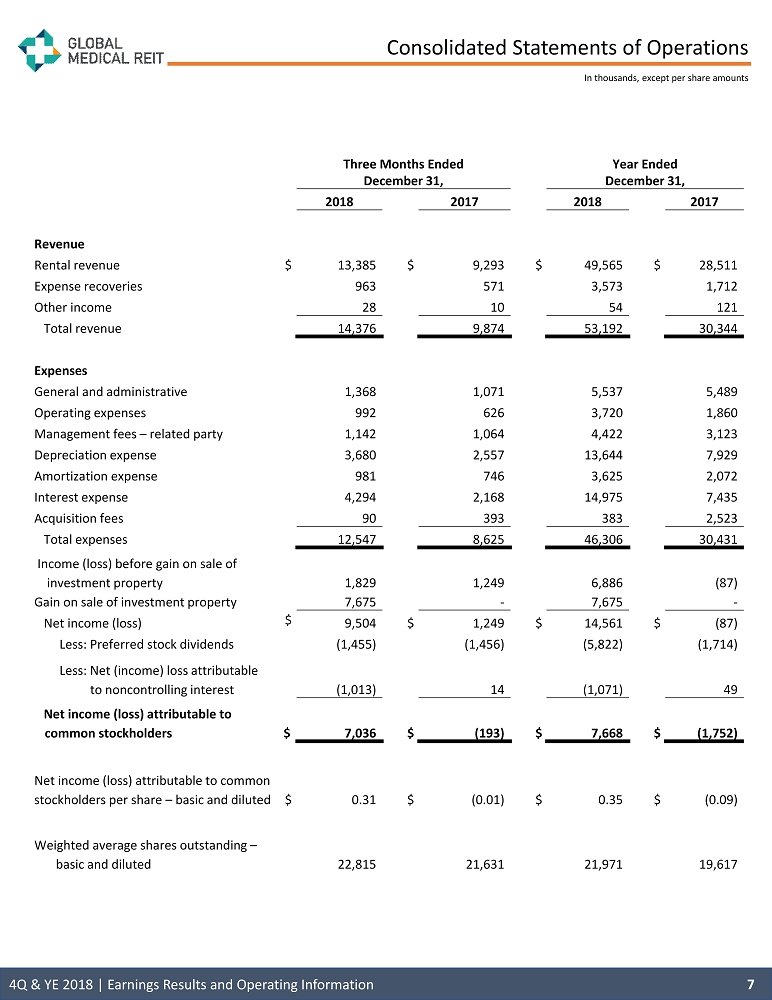
Consolidated Statements of Operations In thousands, except per share amounts 7 Three Months Ended December 31, Year Ended December 31, 2018 2017 2018 2017 Revenue Rental revenue $ 13,385 $ 9,293 $ 49,565 $ 28,511 Expense recoveries 963 571 3,573 1,712 Other income 28 10 54 121 Total revenue 14,376 9,874 53,192 30,344 Expenses General and administrative 1,368 1,071 5,537 5,489 Operating expenses 992 626 3,720 1,860 Management fees – related party 1,142 1,064 4,422 3,123 Depreciation expense 3,680 2,557 13,644 7,929 Amortization expense 981 746 3,625 2,072 Interest expense 4,294 2,168 14,975 7,435 Acquisition fees 90 393 383 2,523 Total expenses 12,547 8,625 46,306 30,431 Income (loss) before gain on sale of investment property 1,829 1,249 6,886 (87) Gain on sale of investment property 7,675 - 7,675 - Net income (loss) $ 9,504 $ 1,249 $ 14,561 $ (87) Less: Preferred stock dividends (1,455) (1,456) (5,822) (1,714) Less: Net (income) loss attributable to noncontrolling interest (1,013) 14 (1,071) 49 Net income (loss) attributable to common stockholders $ 7,036 $ (193) $ 7,668 $ (1,752) Net income (loss) attributable to common stockholders per share – basic and diluted $ 0.31 $ (0.01) $ 0.35 $ (0.09) Weighted average shares outstanding – basic and diluted 22,815 21,631 21,971 19,617 4Q & YE 2018 | Earnings Results and Operating Information
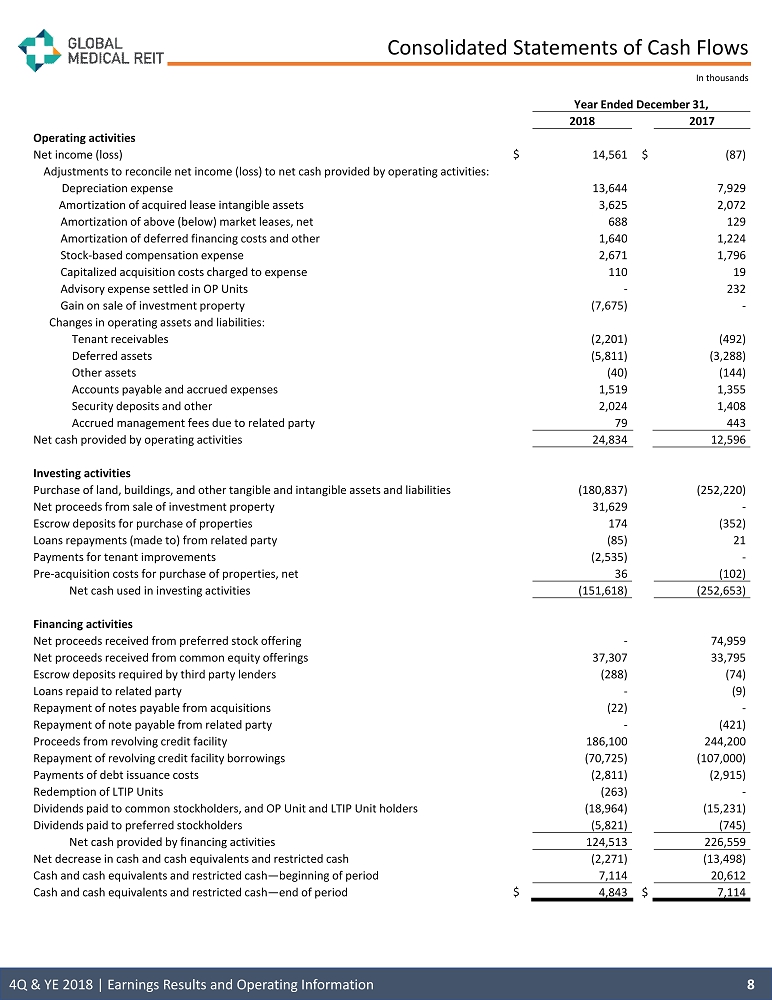
Consolidated Statements of Cash Flows In thousands 8 Year Ended December 31, 2018 2017 Operating activities Net income (loss) $ 14,561 $ (87) Adjustments to reconcile net income (loss) to net cash provided by operating activities: Depreciation expense 13,644 7,929 Amortization of acquired lease intangible assets 3,625 2,072 Amortization of above (below) market leases, net 688 129 Amortization of deferred financing costs and other 1,640 1,224 Stock - based compensation expense 2,671 1,796 Capitalized acquisition costs charged to expense 110 19 Advisory expense settled in OP Units - 232 Gain on sale of investment property (7,675) - Changes in operating assets and liabilities: Tenant receivables (2,201) (492) Deferred assets (5,811) (3,288) Other assets (40) (144) Accounts payable and accrued expenses 1,519 1,355 Security deposits and other 2,024 1,408 Accrued management fees due to related party 79 443 Net cash provided by operating activities 24,834 12,596 Investing activities Purchase of land, buildings, and other tangible and intangible assets and liabilities (180,837) (252,220) Net proceeds from sale of investment property 31,629 - Escrow deposits for purchase of properties 174 (352) Loans repayments (made to) from related party (85) 21 Payments for tenant improvements (2,535) - Pre - acquisition costs for purchase of properties, net 36 (102) Net cash used in investing activities (151,618) (252,653) Financing activities Net proceeds received from preferred stock offering - 74,959 Net proceeds received from common equity offerings 37,307 33,795 Escrow deposits required by third party lenders (288) (74) Loans repaid to related party - (9) Repayment of notes payable from acquisitions (22) - Repayment of note payable from related party - (421) Proceeds from revolving credit facility 186,100 244,200 Repayment of revolving credit facility borrowings (70,725) (107,000) Payments of debt issuance costs (2,811) (2,915) Redemption of LTIP Units (263) - Dividends paid to common stockholders, and OP Unit and LTIP Unit holders (18,964) (15,231) Dividends paid to preferred stockholders (5,821) (745) Net cash provided by financing activities 124,513 226,559 Net decrease in cash and cash equivalents and restricted cash (2,271) (13,498) Cash and cash equivalents and restricted cash — beginning of period 7,114 20,612 Cash and cash equivalents and restricted cash — end of period $ 4,843 $ 7,114 4Q & YE 2018 | Earnings Results and Operating Information
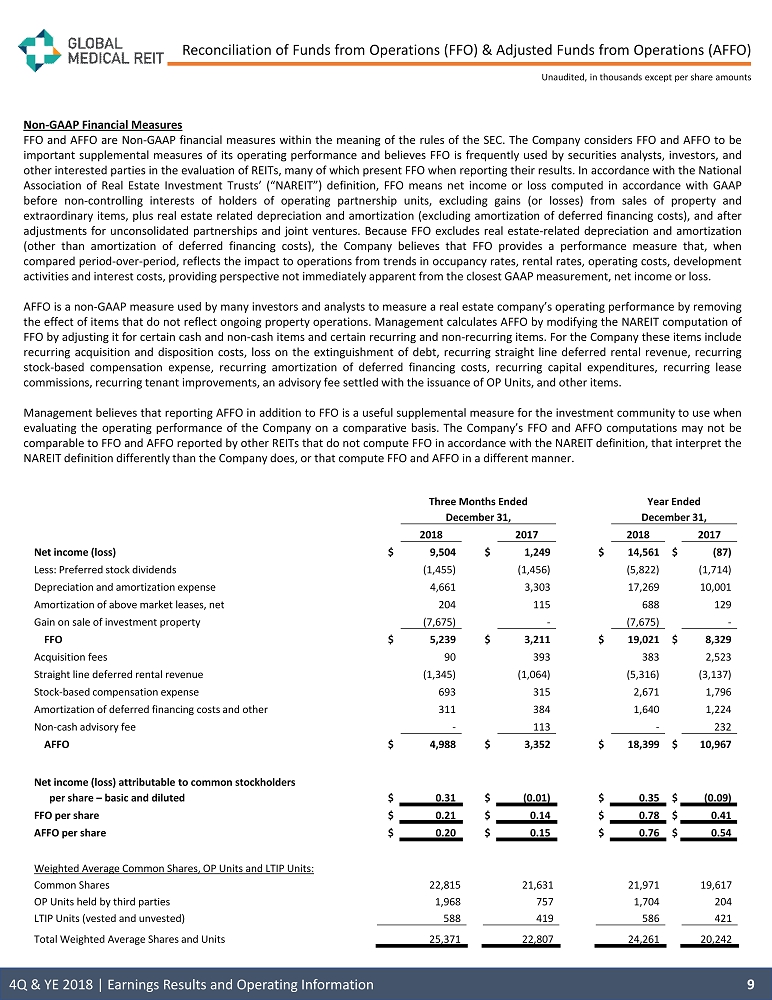
Reconciliation of Funds from Operations (FFO) & Adjusted Funds from Operations (AFFO) Unaudited, in thousands except per share amounts Non - GAAP Financial Measures FFO and AFFO are Non - GAAP financial measures within the meaning of the rules of the SEC . The Company considers FFO and AFFO to be important supplemental measures of its operating performance and believes FFO is frequently used by securities analysts, investors, and other interested parties in the evaluation of REITs, many of which present FFO when reporting their results . In accordance with the National Association of Real Estate Investment Trusts’ (“NAREIT”) definition, FFO means net income or loss computed in accordance with GAAP before non - controlling interests of holders of operating partnership units, excluding gains (or losses) from sales of property and extraordinary items, plus real estate related depreciation and amortization (excluding amortization of deferred financing costs), and after adjustments for unconsolidated partnerships and joint ventures . Because FFO excludes real estate - related depreciation and amortization (other than amortization of deferred financing costs), the Company believes that FFO provides a performance measure that, when compared period - over - period, reflects the impact to operations from trends in occupancy rates, rental rates, operating costs, development activities and interest costs, providing perspective not immediately apparent from the closest GAAP measurement, net income or loss . AFFO is a non - GAAP measure used by many investors and analysts to measure a real estate company’s operating performance by removing the effect of items that do not reflect ongoing property operations . Management calculates AFFO by modifying the NAREIT computation of FFO by adjusting it for certain cash and non - cash items and certain recurring and non - recurring items . For the Company these items include recurring acquisition and disposition costs, loss on the extinguishment of debt, recurring straight line deferred rental revenue, recurring stock - based compensation expense, recurring amortization of deferred financing costs, recurring capital expenditures, recurring lease commissions, recurring tenant improvements, an advisory fee settled with the issuance of OP Units, and other items . Management believes that reporting AFFO in addition to FFO is a useful supplemental measure for the investment community to use when evaluating the operating performance of the Company on a comparative basis . The Company’s FFO and AFFO computations may not be comparable to FFO and AFFO reported by other REITs that do not compute FFO in accordance with the NAREIT definition, that interpret the NAREIT definition differently than the Company does, or that compute FFO and AFFO in a different manner . 9 Three Months Ended December 31, Year Ended December 31, 2018 2017 2018 2017 Net income (loss) $ 9,504 $ 1,249 $ 14,561 $ (87) Less: Preferred stock dividends (1,455) (1,456) (5,822) (1,714) Depreciation and amortization expense 4,661 3,303 17,269 10,001 Amortization of above market leases, net 204 115 688 129 Gain on sale of investment property (7,675) - (7,675) - FFO $ 5,239 $ 3,211 $ 19,021 $ 8,329 Acquisition fees 90 393 383 2,523 Straight line deferred rental revenue (1,345) (1,064) (5,316) (3,137) Stock - based compensation expense 693 315 2,671 1,796 Amortization of deferred financing costs and other 311 384 1,640 1,224 Non - cash advisory fee - 113 - 232 AFFO $ 4,988 $ 3,352 $ 18,399 $ 10,967 Net income (loss) attributable to common stockholders per share – basic and diluted $ 0.31 $ (0.01) $ 0.35 $ (0.09) FFO per share $ 0.21 $ 0.14 $ 0.78 $ 0.41 AFFO per share $ 0.20 $ 0.15 $ 0.76 $ 0.54 Weighted Average Common Shares, OP Units and LTIP Units: Common Shares 22,815 21,631 21,971 19,617 OP Units held by third parties 1,968 757 1,704 204 LTIP Units (vested and unvested) 588 419 586 421 Total Weighted Average Shares and Units 25,371 22,807 24,261 20,242 4Q & YE 2018 | Earnings Results and Operating Information
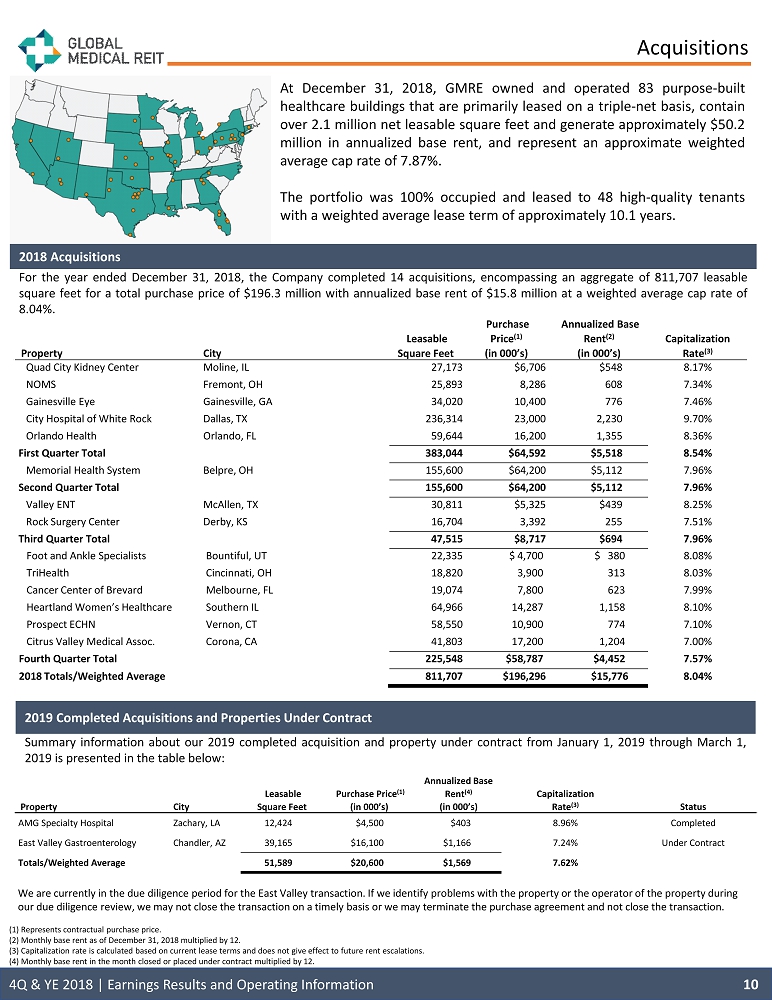
(1) Represents contractual purchase price. (2) Monthly base rent as of December 31, 2018 multiplied by 12. (3) Capitalization rate is calculated based on current lease terms and does not give effect to future rent escalations. (4) Monthly base rent in the month closed or placed under contract multiplied by 12. Acquisitions At December 31 , 2018 , GMRE owned and operated 83 purpose - built healthcare buildings that are primarily leased on a triple - net basis, contain over 2 . 1 million net leasable square feet and generate approximately $ 50 . 2 million in annualized base rent, and represent an approximate weighted average cap rate of 7 . 87 % . The portfolio was 100 % occupied and leased to 48 high - quality tenants with a weighted average lease term of approximately 10 . 1 years . 10 2019 Completed Acquisitions and Properties Under Contract Summary information about our 2019 completed acquisition and property under contract from January 1 , 2019 through March 1 , 2019 is presented in the table below : 4Q & YE 2018 | Earnings Results and Operating Information We are currently in the due diligence period for the East Valley transaction. If we identify problems with the property or th e o perator of the property during our due diligence review, we may not close the transaction on a timely basis or we may terminate the purchase agreement and n ot close the transaction. Property City Leasable Square Feet Purchase Price (1) (in 000’s) Annualized Base Rent (4) (in 000’s) Capitalization Rate (3) Status AMG Specialty Hospital Zachary, LA 12,424 $4,500 $403 8.96% Completed East Valley Gastroenterology Chandler, AZ 39,165 $16,100 $1,166 7.24% Under Contract Totals/Weighted Average 51,589 $20,600 $1,569 7.62% Property City Leasable Square Feet Purchase Price (1) (in 000’s) Annualized Base Rent (2) (in 000’s) Capitalization Rate (3) Quad City Kidney Center Moline, IL 27,173 $6,706 $548 8.17% NOMS Fremont, OH 25,893 8,286 608 7.34% Gainesville Eye Gainesville, GA 34,020 10,400 776 7.46% City Hospital of White Rock Dallas, TX 236,314 23,000 2,230 9.70% Orlando Health Orlando, FL 59,644 16,200 1,355 8.36% First Quarter Total 383,044 $64,592 $5,518 8.54% Memorial Health System Belpre, OH 155,600 $64,200 $5,112 7.96% Second Quarter Total 155,600 $64,200 $5,112 7.96% Valley ENT McAllen, TX 30,811 $5,325 $439 8.25% Rock Surgery Center Derby, KS 16,704 3,392 255 7.51% Third Quarter Total 47,515 $8,717 $694 7.96% Foot and Ankle Specialists Bountiful, UT 22,335 $ 4,700 $ 380 8.08% TriHealth Cincinnati, OH 18,820 3,900 313 8.03% Cancer Center of Brevard Melbourne, FL 19,074 7,800 623 7.99% Heartland Women’s Healthcare Southern IL 64,966 14,287 1,158 8.10% Prospect ECHN Vernon, CT 58,550 10,900 774 7.10% Citrus Valley Medical Assoc. Corona, CA 41,803 17,200 1,204 7.00% Fourth Quarter Total 225,548 $58,787 $4,452 7.57% 2018 Totals/Weighted Average 811,707 $196,296 $15,776 8.04% 2018 Acquisitions For the year ended December 31 , 2018 , the Company completed 14 acquisitions, encompassing an aggregate of 811 , 707 leasable square feet for a total purchase price of $ 196 . 3 million with annualized base rent of $ 15 . 8 million at a weighted average cap rate of 8 . 04 % .
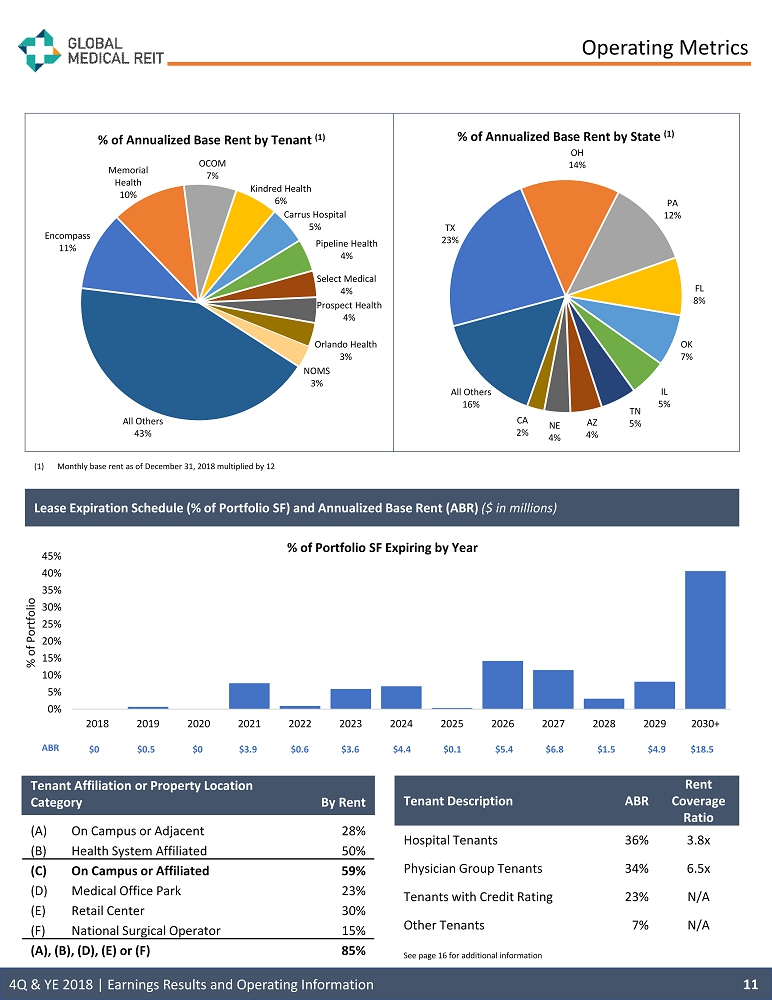
Operating Metrics (1) Monthly base rent as of December 31, 2018 multiplied by 12 Lease Expiration Schedule (% of Portfolio SF) and Annualized Base Rent (ABR) ($ in millions) Tenant Affiliation or Property Location Category By Rent (A) On Campus or Adjacent 28% (B) Health System Affiliated 50% (C) On Campus or Affiliated 59% (D) Medical Office Park 23% (E) Retail Center 30% (F) National Surgical Operator 15% (A), (B), (D), (E) or (F) 85% Tenant Description ABR Rent Coverage Ratio Hospital Tenants 36% 3.8x Physician Group Tenants 34% 6.5x Tenants with Credit Rating 23% N/A Other Tenants 7% N/A See page 16 for additional information 11 $0 $0.5 $0 $3.9 $0.6 $3.6 $4.4 $0.1 $5.4 $6.8 $1.5 $4.9 $18.5 ABR 4Q & YE 2018 | Earnings Results and Operating Information 0% 5% 10% 15% 20% 25% 30% 35% 40% 45% 2018 2019 2020 2021 2022 2023 2024 2025 2026 2027 2028 2029 2030+ % of Portfolio % of Portfolio SF Expiring by Year Encompass 11% Memorial Health 10% OCOM 7% Kindred Health 6% Carrus Hospital 5% Pipeline Health 4% Select Medical 4% Prospect Health 4% Orlando Health 3% NOMS 3% All Others 43% % of Annualized Base Rent by Tenant (1) TX 23% OH 14% PA 12% FL 8% OK 7% IL 5% TN 5% AZ 4% NE 4% CA 2% All Others 16% % of Annualized Base Rent by State (1)
Top 10 Tenant Profiles Encompass Health (Ba 3 ) (NYSE : EHC), headquartered in Birmingham, AL is a national leader in post - acute care, offering both facility - based and homebased patient care through its network of inpatient rehabilitation hospitals, home health agencies and hospice agencies . With a national footprint that spans 130 hospitals and 278 home health & hospice locations in 36 states and Puerto Rico, Encompass Health is committed to delivering high - quality, cost - effective care across the post - acute continuum . Encompass Health is the result of the union between HealthSouth Corporation and Encompass Home Health & Hospice, and is ranked as one of Fortune's 100 Best Companies to Work For, as well as Modern Healthcare's Best Places to Work . Marietta Memorial Health System (MMH), (BB - ) is headquartered in Marietta, OH, and is the largest health system in the Parkersburg - Marietta - Vienna MSA . The largest employer in Washington County, MMH comprises (i) two hospitals, Marietta Memorial Hospital ( 154 - bed) and Selby General Hospital ( 25 - bed) critical access hospital ; (ii) the Belpre Campus ; (iii) ten clinic outpatient service sites ; and (iv) five imaging locations, and has over 2 , 500 employees and 211 accredited physicians . Oklahoma Center for Orthopedic & Multi - Specialty Surgery, LLC (OCOM) is based Oklahoma City, OK and affiliated with USPI and INTEGRIS, and is a leading hospital for orthopedic specialists . OCOM operates a surgical hospital with nine operating rooms and a physical therapy department, an ancillary surgery center, and multiple imaging centers in throughout Oklahoma City . Kindred Healthcare, LLC (B 2 ) is a healthcare services company based in Louisville, KY with annual revenues of approximately $ 3 . 4 billion . At March 31 , 2018 , Kindred through its subsidiaries had approximately 38 , 300 employees providing healthcare services in 1 , 831 locations in 45 states, including 75 LTAC hospitals, 19 inpatient rehabilitation hospitals ( 22 as of July 12 , 2018 ), 13 sub - acute units, 98 inpatient rehabilitation units (hospital - based) and contract rehabilitation service businesses which served 1 , 626 non - affiliated sites of service . Ranked as one of Fortune magazine’s Most Admired Healthcare Companies for nine years . Carrus Hospital is located in Sherman, TX and provides acute rehabilitative care and long term acute care . Accredited with The Joint Commission’s Gold Seal of Approval, Carrus Hospital serves Sherman, Durant, Denison, Gainesville, Denton, McKinney, Plano, Bonham, Lewisville, Carrollton, Fort Worth, Dallas, Oklahoma City and beyond . Pipeline Health is based in Manhattan Beach, CA and has a portfolio of affiliated health care companies that have evolved over the past couple of decades from the challenging California market . Pipeline includes : Emergent Medical Associates, a leading provider of ER serving 20 + hospital sites and 900 , 000 patients annually ; Integrated Anesthesia Medical Group, with 100 providers performing 15 , 000 procedures annually ; Avanti Hospitals, a Los Angeles health system with four hospitals, 400 + beds and 55 , 000 ER visits annually ; Cloudbreak , a telemedicine company with 75 , 000 monthly encounters in 700 hospitals ; Pacific Healthworks, a physician practice management company ; and Benchmark Hospitalists . Select Medical (B 1 ) is headquartered in Mechanicsburg, PA and one of the largest operators of critical illness recovery hospitals (previously referred to as long term acute care hospitals), rehabilitation hospitals (previously referred to as inpatient rehabilitation facilities), outpatient rehabilitation clinics, and occupational health centers in the U . S . based on the number of facilities . As of December 31 , 2018 , Select Medical operated 96 critical illness recovery hospitals in 27 states, 26 rehabilitation hospitals in 11 states, and 1 , 662 outpatient rehabilitation clinics in 41 states . Select Medical’s joint venture subsidiary Concentra operated 524 occupational health centers in 41 states . Prospect Medical Holdings (B 2 ) was Established in 1996 , and has grown into a significant provider of coordinated regional healthcare services in Southern California, Connecticut, New Jersey, Pennsylvania, Rhode Island and South Central Texas . In addition to their medical groups, they also own 20 acute and behavioral hospitals that are located in diverse areas within Southern California, Connecticut, New Jersey, Pennsylvania, Rhode Island and South Central Texas and maintain competitive market positions in the areas they serve . All of their facilities aim to provide a comprehensive range of services tailored to their specific communities, including partnerships with other area hospitals, physicians and health plans . Orlando Health (A 2 ) is based in Central Florida, Orlando and is a $ 3 . 8 billion not - for - profit healthcare organization and a community - based network of hospitals, physician practices and outpatient care centers across Central Florida . The organization is home to the area’s only Level One Trauma Centers for adults and pediatrics and is a statutory teaching hospital system that offers both specialty and community hospitals . More than 3 , 000 physicians have privileges across the system, which is also one of the area’s largest employers with more than 23 , 000 employees who serve nearly 155 , 000 inpatients, more than 3 million outpatients, and more than 10 , 000 international patients each year . Additionally, Orlando Health provides more than $ 345 million in support of community health needs . Northern Ohio Medical Specialists (NOMS) Healthcare is a multi - specialty physician group with over 220 providers, 31 specialties, 43 cities and growing . NOMS Healthcare is committed to superior patient satisfaction . NOMS is committed to taking an active role in the betterment of its community, particularly related to healthcare matters affecting its fellow citizens . NOMS develops and supports health care practices recognized for exceeding patient expectations, thereby setting the standard for excellence in Northern Ohio . 12 4Q & YE 2018 | Earnings Results and Operating Information
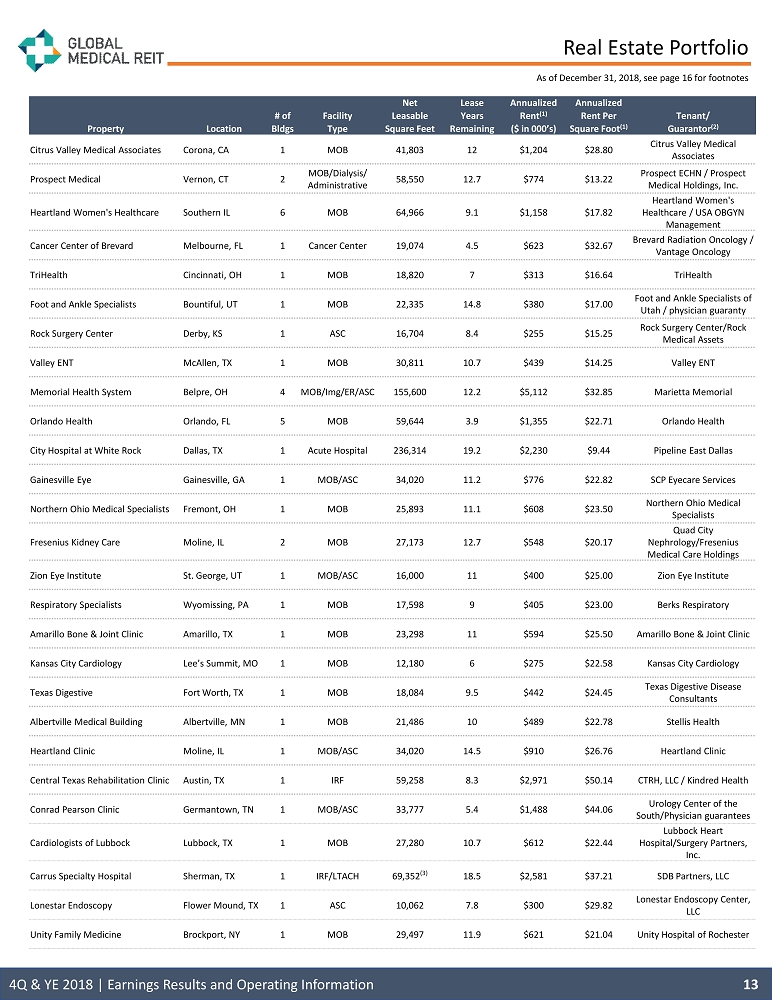
Real Estate Portfolio As of December 31, 2018, see page 16 for footnotes 13 Property Location # of Bldgs Facility Type Net Leasable Square Feet Lease Years Remaining Annualized Rent (1) ($ in 000’s) Annualized Rent Per Square Foot (1) Tenant/ Guarantor (2) Citrus Valley Medical Associates Corona, CA 1 MOB 41,803 12 $1,204 $28.80 Citrus Valley Medical Associates Prospect Medical Vernon, CT 2 MOB/Dialysis/ Administrative 58,550 12.7 $774 $13.22 Prospect ECHN / Prospect Medical Holdings, Inc. Heartland Women's Healthcare Southern IL 6 MOB 64,966 9.1 $1,158 $17.82 Heartland Women's Healthcare / USA OBGYN Management Cancer Center of Brevard Melbourne, FL 1 Cancer Center 19,074 4.5 $623 $32.67 Brevard Radiation Oncology / Vantage Oncology TriHealth Cincinnati, OH 1 MOB 18,820 7 $313 $16.64 TriHealth Foot and Ankle Specialists Bountiful, UT 1 MOB 22,335 14.8 $380 $17.00 Foot and Ankle Specialists of Utah / physician guaranty Rock Surgery Center Derby, KS 1 ASC 16,704 8.4 $255 $15.25 Rock Surgery Center/Rock Medical Assets Valley ENT McAllen, TX 1 MOB 30,811 10.7 $439 $14.25 Valley ENT Memorial Health System Belpre, OH 4 MOB/Img/ER/ASC 155,600 12.2 $5,112 $32.85 Marietta Memorial Orlando Health Orlando, FL 5 MOB 59,644 3.9 $1,355 $22.71 Orlando Health City Hospital at White Rock Dallas, TX 1 Acute Hospital 236,314 19.2 $2,230 $9.44 Pipeline East Dallas Gainesville Eye Gainesville, GA 1 MOB/ASC 34,020 11.2 $776 $22.82 SCP Eyecare Services Northern Ohio Medical Specialists Fremont, OH 1 MOB 25,893 11.1 $608 $23.50 Northern Ohio Medical Specialists Fresenius Kidney Care Moline, IL 2 MOB 27,173 12.7 $548 $20.17 Quad City Nephrology/Fresenius Medical Care Holdings Zion Eye Institute St. George, UT 1 MOB/ASC 16,000 11 $400 $25.00 Zion Eye Institute Respiratory Specialists Wyomissing, PA 1 MOB 17,598 9 $405 $23.00 Berks Respiratory Amarillo Bone & Joint Clinic Amarillo, TX 1 MOB 23,298 11 $594 $25.50 Amarillo Bone & Joint Clinic Kansas City Cardiology Lee’s Summit, MO 1 MOB 12,180 6 $275 $22.58 Kansas City Cardiology Texas Digestive Fort Worth, TX 1 MOB 18,084 9.5 $442 $24.45 Texas Digestive Disease Consultants Albertville Medical Building Albertville, MN 1 MOB 21,486 10 $489 $22.78 Stellis Health Heartland Clinic Moline, IL 1 MOB/ASC 34,020 14.5 $910 $26.76 Heartland Clinic Central Texas Rehabilitation Clinic Austin, TX 1 IRF 59,258 8.3 $2,971 $50.14 CTRH, LLC / Kindred Health Conrad Pearson Clinic Germantown, TN 1 MOB/ASC 33,777 5.4 $1,488 $44.06 Urology Center of the South/Physician guarantees Cardiologists of Lubbock Lubbock, TX 1 MOB 27,280 10.7 $612 $22.44 Lubbock Heart Hospital/Surgery Partners, Inc. Carrus Specialty Hospital Sherman, TX 1 IRF/LTACH 69,352 (3) 18.5 $2,581 $37.21 SDB Partners, LLC Lonestar Endoscopy Flower Mound, TX 1 ASC 10,062 7.8 $300 $29.82 Lonestar Endoscopy Center, LLC Unity Family Medicine Brockport, NY 1 MOB 29,497 11.9 $621 $21.04 Unity Hospital of Rochester 4Q & YE 2018 | Earnings Results and Operating Information
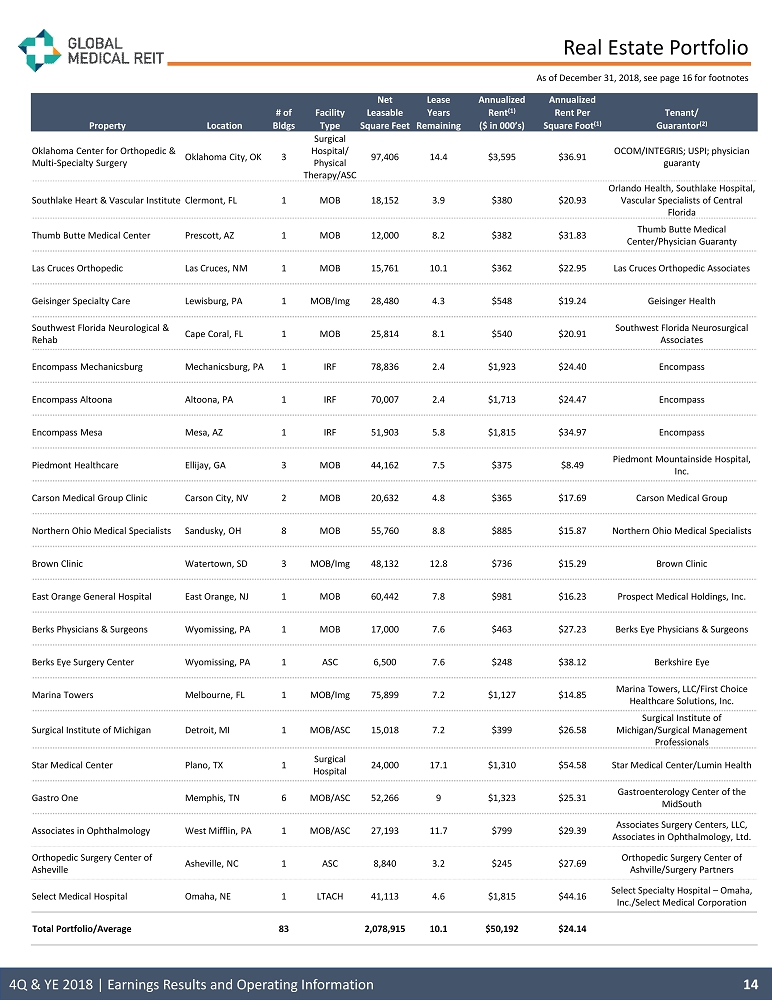
Real Estate Portfolio 14 Property Location # of Bldgs Facility Type Net Leasable Square Feet Lease Years Remaining Annualized Rent (1) ($ in 000’s) Annualized Rent Per Square Foot (1) Tenant/ Guarantor (2) Oklahoma Center for Orthopedic & Multi - Specialty Surgery Oklahoma City, OK 3 Surgical Hospital/ Physical Therapy/ASC 97,406 14.4 $3,595 $36.91 OCOM/INTEGRIS; USPI; physician guaranty Southlake Heart & Vascular Institute Clermont, FL 1 MOB 18,152 3.9 $380 $20.93 Orlando Health, Southlake Hospital, Vascular Specialists of Central Florida Thumb Butte Medical Center Prescott, AZ 1 MOB 12,000 8.2 $382 $31.83 Thumb Butte Medical Center/Physician Guaranty Las Cruces Orthopedic Las Cruces, NM 1 MOB 15,761 10.1 $362 $22.95 Las Cruces Orthopedic Associates Geisinger Specialty Care Lewisburg, PA 1 MOB/ Img 28,480 4.3 $548 $19.24 Geisinger Health Southwest Florida Neurological & Rehab Cape Coral, FL 1 MOB 25,814 8.1 $540 $20.91 Southwest Florida Neurosurgical Associates Encompass Mechanicsburg Mechanicsburg, PA 1 IRF 78,836 2.4 $1,923 $24.40 Encompass Encompass Altoona Altoona, PA 1 IRF 70,007 2.4 $1,713 $24.47 Encompass Encompass Mesa Mesa, AZ 1 IRF 51,903 5.8 $1,815 $34.97 Encompass Piedmont Healthcare Ellijay, GA 3 MOB 44,162 7.5 $375 $8.49 Piedmont Mountainside Hospital, Inc. Carson Medical Group Clinic Carson City, NV 2 MOB 20,632 4.8 $365 $17.69 Carson Medical Group Northern Ohio Medical Specialists Sandusky, OH 8 MOB 55,760 8.8 $885 $15.87 Northern Ohio Medical Specialists Brown Clinic Watertown, SD 3 MOB/Img 48,132 12.8 $736 $15.29 Brown Clinic East Orange General Hospital East Orange, NJ 1 MOB 60,442 7.8 $981 $16.23 Prospect Medical Holdings, Inc. Berks Physicians & Surgeons Wyomissing, PA 1 MOB 17,000 7.6 $463 $27.23 Berks Eye Physicians & Surgeons Berks Eye Surgery Center Wyomissing, PA 1 ASC 6,500 7.6 $248 $38.12 Berkshire Eye Marina Towers Melbourne, FL 1 MOB/ Img 75,899 7.2 $1,127 $14.85 Marina Towers, LLC/First Choice Healthcare Solutions, Inc. Surgical Institute of Michigan Detroit, MI 1 MOB/ASC 15,018 7.2 $399 $26.58 Surgical Institute of Michigan/Surgical Management Professionals Star Medical Center Plano, TX 1 Surgical Hospital 24,000 17.1 $1,310 $54.58 Star Medical Center/ Lumin Health Gastro One Memphis, TN 6 MOB/ASC 52,266 9 $1,323 $25.31 Gastroenterology Center of the MidSouth Associates in Ophthalmology West Mifflin, PA 1 MOB/ASC 27,193 11.7 $799 $29.39 Associates Surgery Centers, LLC, Associates in Ophthalmology, Ltd. Orthopedic Surgery Center of Asheville Asheville, NC 1 ASC 8,840 3.2 $245 $27.69 Orthopedic Surgery Center of Ashville/Surgery Partners Select Medical Hospital Omaha, NE 1 LTACH 41,113 4.6 $1,815 $44.16 Select Specialty Hospital – Omaha, Inc./Select Medical Corporation Total Portfolio/Average 83 2,078,915 10.1 $50,192 $24.14 4Q & YE 2018 | Earnings Results and Operating Information As of December 31, 2018, see page 16 for footnotes
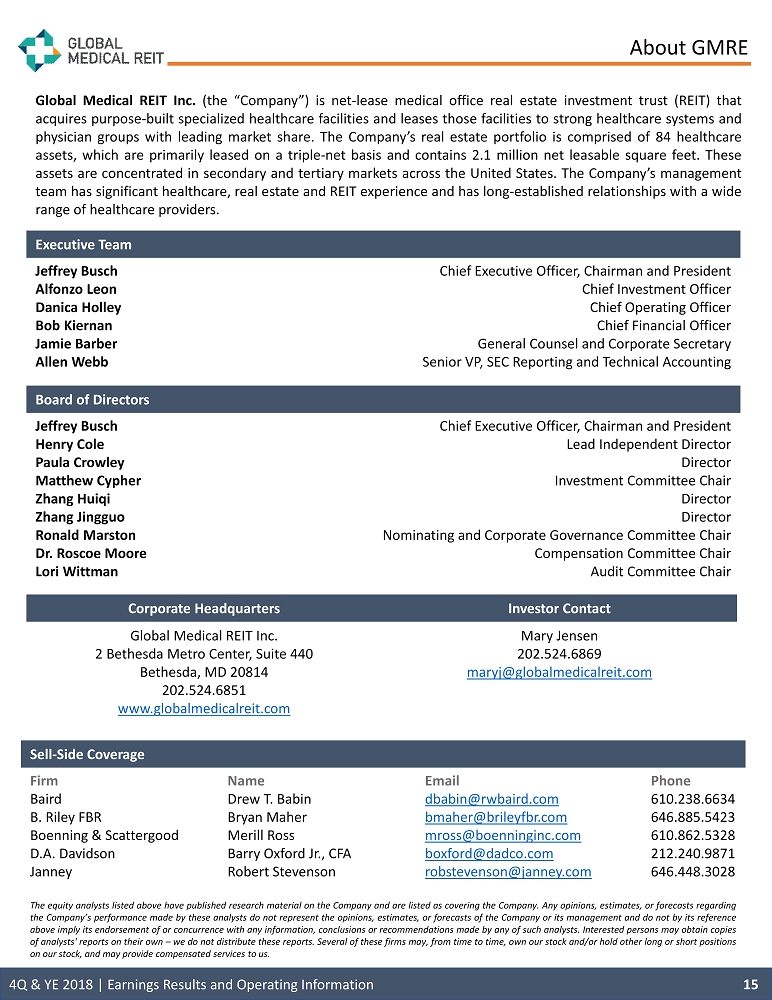
About GMRE Executive Team Jeffrey Busch Chief Executive Officer, Chairman and President Alfonzo Leon Chief Investment Officer Danica Holley Chief Operating Officer Bob Kiernan Chief Financial Officer Jamie Barber General Counsel and Corporate Secretary Allen Webb Senior VP, SEC Reporting and Technical Accounting Board of Directors Jeffrey Busch Chief Executive Officer, Chairman and President Henry Cole Lead Independent Director Paula Crowley Director Matthew Cypher Investment Committee Chair Zhang Huiqi Director Zhang Jingguo Director Ronald Marston Nominating and Corporate Governance Committee Chair Dr. Roscoe Moore Compensation Committee Chair Lori Wittman Audit Committee Chair Sell - Side Coverage Firm Name Email Phone Baird Drew T. Babin dbabin@rwbaird.com 610.238.6634 B. Riley FBR Bryan Maher bmaher@brileyfbr.com 646.885.5423 Boenning & Scattergood Merill Ross mross@boenninginc.com 610.862.5328 D.A. Davidson Barry Oxford Jr., CFA boxford@dadco.com 212.240.9871 Janney Robert Stevenson robstevenson@janney.com 646.448.3028 The equity analysts listed above have published research material on the Company and are listed as covering the Company . Any opinions, estimates, or forecasts regarding the Company’s performance made by these analysts do not represent the opinions, estimates, or forecasts of the Company or its management and do not by its reference above imply its endorsement of or concurrence with any information, conclusions or recommendations made by any of such analysts . Interested persons may obtain copies of analysts' reports on their own – we do not distribute these reports . Several of these firms may, from time to time, own our stock and/or hold other long or short positions on our stock, and may provide compensated services to us . 15 Corporate Headquarters Investor Contact Global Medical REIT Inc. 2 Bethesda Metro Center, Suite 440 Bethesda, MD 20814 202.524.6851 www.globalmedicalreit.com Mary Jensen 202.524.6869 maryj@globalmedicalreit.com 4Q & YE 2018 | Earnings Results and Operating Information Global Medical REIT Inc . (the “Company”) is net - lease medical office real estate investment trust (REIT) that acquires purpose - built specialized healthcare facilities and leases those facilities to strong healthcare systems and physician groups with leading market share . The Company’s real estate portfolio is comprised of 84 healthcare assets, which are primarily leased on a triple - net basis and contains 2 . 1 million net leasable square feet . These assets are concentrated in secondary and tertiary markets across the United States . The Company’s management team has significant healthcare, real estate and REIT experience and has long - established relationships with a wide range of healthcare providers .
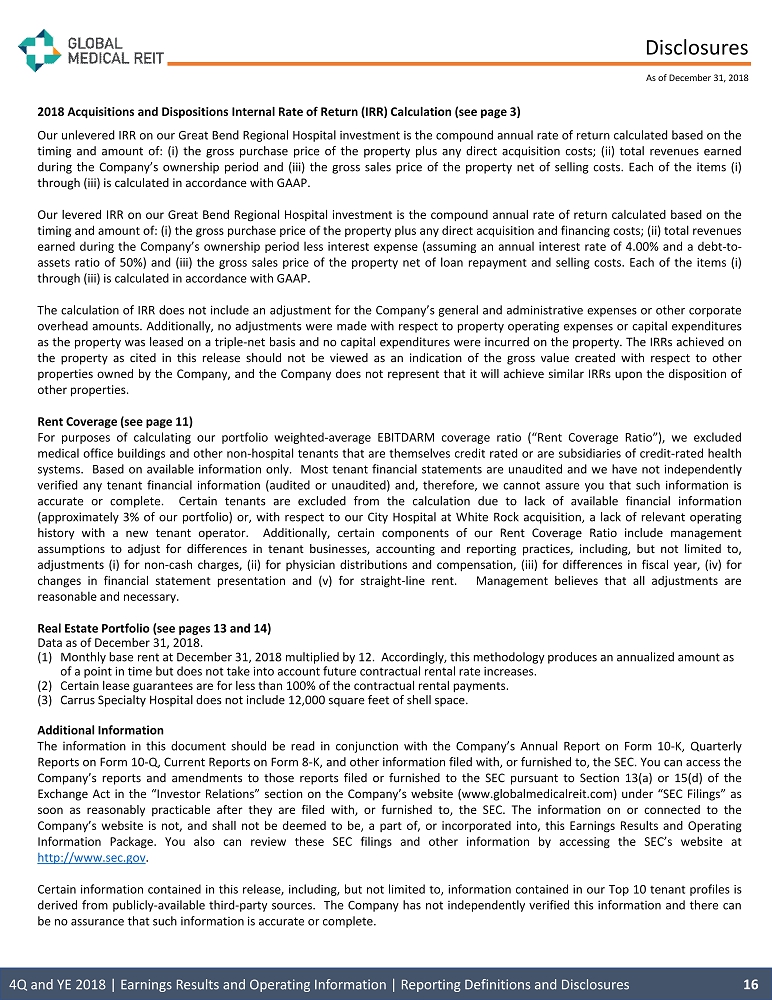
Disclosures 2018 Acquisitions and Dispositions Internal Rate of Return (IRR) Calculation (see page 3 ) Our unlevered IRR on our Great Bend Regional Hospital investment is the compound annual rate of return calculated based on the timing and amount of : (i) the gross purchase price of the property plus any direct acquisition costs ; (ii) total revenues earned during the Company’s ownership period and (iii) the gross sales price of the property net of selling costs . Each of the items (i) through (iii) is calculated in accordance with GAAP . Our levered IRR on our Great Bend Regional Hospital investment is the compound annual rate of return calculated based on the timing and amount of : (i) the gross purchase price of the property plus any direct acquisition and financing costs ; (ii) total revenues earned during the Company’s ownership period less interest expense (assuming an annual interest rate of 4 . 00 % and a debt - to - assets ratio of 50 % ) and (iii) the gross sales price of the property net of loan repayment and selling costs . Each of the items (i) through (iii) is calculated in accordance with GAAP . The calculation of IRR does not include an adjustment for the Company’s general and administrative expenses or other corporate overhead amounts . Additionally, no adjustments were made with respect to property operating expenses or capital expenditures as the property was leased on a triple - net basis and no capital expenditures were incurred on the property . The IRRs achieved on the property as cited in this release should not be viewed as an indication of the gross value created with respect to other properties owned by the Company, and the Company does not represent that it will achieve similar IRRs upon the disposition of other properties . Rent Coverage (see page 11 ) For purposes of calculating our portfolio weighted - average EBITDARM coverage ratio (“Rent Coverage Ratio”), we excluded medical office buildings and other non - hospital tenants that are themselves credit rated or are subsidiaries of credit - rated health systems . Based on available information only . Most tenant financial statements are unaudited and we have not independently verified any tenant financial information (audited or unaudited) and, therefore, we cannot assure you that such information is accurate or complete . Certain tenants are excluded from the calculation due to lack of available financial information (approximately 3 % of our portfolio) or, with respect to our City Hospital at White Rock acquisition, a lack of relevant operating history with a new tenant operator . Additionally, certain components of our Rent Coverage Ratio include management assumptions to adjust for differences in tenant businesses, accounting and reporting practices, including, but not limited to, adjustments ( i ) for non - cash charges, (ii) for physician distributions and compensation, (iii) for differences in fiscal year, (iv) for changes in financial statement presentation and (v) for straight - line rent . Management believes that all adjustments are reasonable and necessary . Real Estate Portfolio (see pages 13 and 14 ) Data as of December 31, 2018. (1) Monthly base rent at December 31, 2018 multiplied by 12 . Accordingly, this methodology produces an annualized amount as of a point in time but does not take into account future contractual rental rate increases. (2) Certain lease guarantees are for less than 100% of the contractual rental payments. (3) Carrus Specialty Hospital does not include 12,000 square feet of shell space. Additional Information The information in this document should be read in conjunction with the Company’s Annual Report on Form 10 - K, Quarterly Reports on Form 10 - Q, Current Reports on Form 8 - K, and other information filed with, or furnished to, the SEC . You can access the Company’s reports and amendments to those reports filed or furnished to the SEC pursuant to Section 13 (a) or 15 (d) of the Exchange Act in the “Investor Relations” section on the Company’s website (www . globalmedicalreit . com) under “SEC Filings” as soon as reasonably practicable after they are filed with, or furnished to, the SEC . The information on or connected to the Company’s website is not, and shall not be deemed to be, a part of, or incorporated into, this Earnings Results and Operating Information Package . You also can review these SEC filings and other information by accessing the SEC’s website at http : //www . sec . gov . Certain information contained in this release, including, but not limited to, information contained in our Top 10 tenant profiles is derived from publicly - available third - party sources . The Company has not independently verified this information and there can be no assurance that such information is accurate or complete . 4Q and YE 2018 | Earnings Results and Operating Information | Reporting Definitions and Disclosures 16 As of December 31, 2018
www.globalmedicalreit.com NYSE: GMRE 2 Bethesda Metro Center, Suite 440 Bethesda, MD 20814 (202) 524 - 6851