Exhibit 99.1
First Quarter 2019 Earnings Results and Operating Information Three Months Ended March 31, 2019 www.globalmedicalreit.com NYSE: GMRE
2 Table of Contents Financial Highlights 3 Financial Review 4 Consolidated Balance Sheets 5 Consolidated Statements of Operations 6 Consolidated Statements of Cash Flows 7 Reconciliation of Non - GAAP Measures for Funds from Operations (FFO) and Adjusted Funds From Operations (AFFO) 8 Acquisitions 9 Operating Metrics 10 Top 10 Tenant Profiles 12 Real Estate Portfolio 13 About Global Medical REIT Inc. (NYSE: GMRE) 15 Disclosures 16 Forward - Looking Statements Certain statements contained herein may be considered “forward - looking statements” within the meaning of the Private Securities Litigation Reform Act of 1995 , and it is the Company’s intent that any such statements be protected by the safe harbor created thereby . These forward - looking statements are identified by their use of terms and phrases such as "anticipate," "believe," "could," "estimate," "expect," "intend," "may," "should," "plan," "predict," "project," "will," "continue" and other similar terms and phrases, including references to assumptions and forecasts of future results . Except for historical information, the statements set forth herein including, but not limited to, any statements regarding our earnings, expected financial performance (including future cash flows associated with new tenants), future dividends or other financial items ; any other statements concerning our plans, strategies, objectives and expectations for future operations, our pipeline of acquisition opportunities and expected acquisition activity, including the timing and/or successful completion of any acquisitions and expected rent receipts on these properties ; facility sale or expected sale activity, including the timing and/or successful completion of any sales and expected proceeds and tax impact of the sales, and any statements regarding future economic conditions or performance are forward - looking statements . These forward - looking statements are based on our current expectations, estimates and assumptions and are subject to certain risks and uncertainties . Although the Company believes that the expectations, estimates and assumptions reflected in its forward - looking statements are reasonable, actual results could differ materially from those projected or assumed in any of the Company’s forward - looking statements . Additional information concerning us and our business, including additional factors that could materially and adversely affect our financial results, include, without limitation, the risks described under Part I, Item 1 A - Risk Factors, in our Annual Report on Form 10 - K, our Quarterly Reports on Form 10 - Q, and in our other filings with the United States Securities and Exchange Commission (“SEC”) . You are cautioned not to place undue reliance on forward - looking statements . The Company does not intend, and undertakes no obligation, to update any forward - looking statement . First Quarter Earnings Call and Webcast Date Thursday, May 9, 2019 Time 9:00 a.m. Eastern Time Dial - In 1 - 877 - 407 - 3948: Domestic / 201 - 389 - 0865: International / Reference: Global Medical REIT Inc. Webcast Located on the “Investor Relations” section of the Company’s website at http://investors.globalmedicalreit.com/ or by clicking on the conference call link: https://hd.choruscall.com/InComm/?callme=true&passcode=13666319&h=true&info=company&r=true&B=6 Replay An audio replay of the conference call will be posted on the Company’s website. 1Q - 2019| Earnings Results and Operating Information
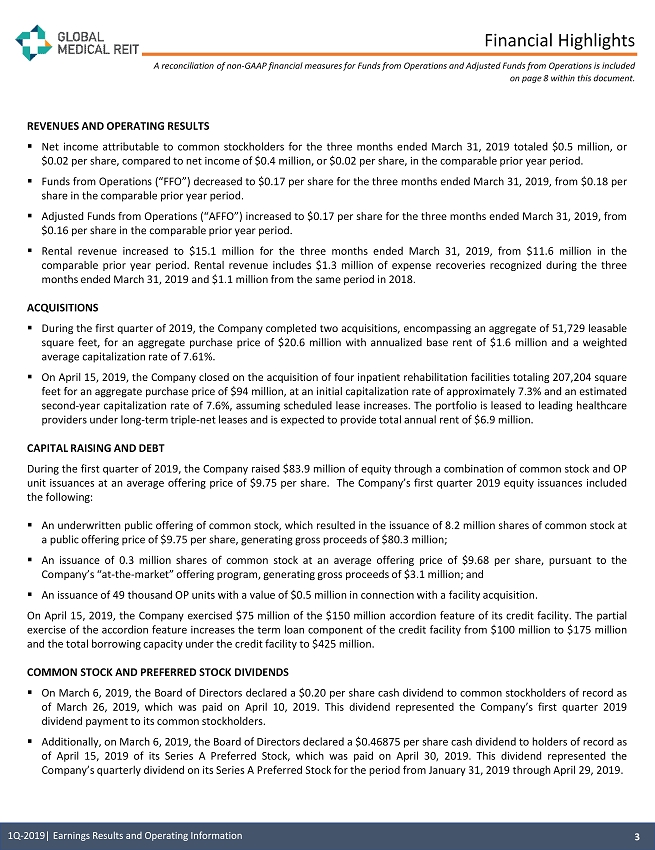
Financial Highlights A reconciliation of non - GAAP financial measures for Funds from Operations and Adjusted Funds from Operations is included on page 8 within this document. 3 1Q - 2019| Earnings Results and Operating Information REVENUES AND OPERATING RESULTS ▪ Net income attributable to common stockholders for the three months ended March 31 , 2019 totaled $ 0 . 5 million, or $ 0 . 02 per share, compared to net income of $ 0 . 4 million, or $ 0 . 02 per share, in the comparable prior year period . ▪ Funds from Operations (“FFO”) decreased to $ 0 . 17 per share for the three months ended March 31 , 2019 , from $ 0 . 18 per share in the comparable prior year period . ▪ Adjusted Funds from Operations (“AFFO”) increased to $ 0 . 17 per share for the three months ended March 31 , 2019 , from $ 0 . 16 per share in the comparable prior year period . ▪ Rental revenue increased to $ 15 . 1 million for the three months ended March 31 , 2019 , from $ 11 . 6 million in the comparable prior year period . Rental revenue includes $ 1 . 3 million of expense recoveries recognized during the three months ended March 31 , 2019 and $ 1 . 1 million from the same period in 2018 . ACQUISITIONS ▪ During the first quarter of 2019 , the Company completed two acquisitions, encompassing an aggregate of 51 , 729 leasable square feet, for an aggregate purchase price of $ 20 . 6 million with annualized base rent of $ 1 . 6 million and a weighted average capitalization rate of 7 . 61 % . ▪ On April 15 , 2019 , the Company closed on the acquisition of four inpatient rehabilitation facilities totaling 207 , 204 square feet for an aggregate purchase price of $ 94 million, at an initial capitalization rate of approximately 7 . 3 % and an estimated second - year capitalization rate of 7 . 6 % , assuming scheduled lease increases . The portfolio is leased to leading healthcare providers under long - term triple - net leases and is expected to provide total annual rent of $ 6 . 9 million . CAPITAL RAISING AND DEBT During the first quarter of 2019 , the Company raised $ 83 . 9 million of equity through a combination of common stock and OP unit issuances at an average offering price of $ 9 . 75 per share . The Company’s first quarter 2019 equity issuances included the following : ▪ An underwritten public offering of common stock, which resulted in the issuance of 8 . 2 million shares of common stock at a public offering price of $ 9 . 75 per share, generating gross proceeds of $ 80 . 3 million ; ▪ An issuance of 0 . 3 million shares of common stock at an average offering price of $ 9 . 68 per share, pursuant to the Company’s “at - the - market” offering program, generating gross proceeds of $ 3 . 1 million ; and ▪ An issuance of 49 thousand OP units with a value of $ 0 . 5 million in connection with a facility acquisition . On April 15 , 2019 , the Company exercised $ 75 million of the $ 150 million accordion feature of its credit facility . The partial exercise of the accordion feature increases the term loan component of the credit facility from $ 100 million to $ 175 million and the total borrowing capacity under the credit facility to $ 425 million . COMMON STOCK AND PREFERRED STOCK DIVIDENDS ▪ On March 6 , 2019 , the Board of Directors declared a $ 0 . 20 per share cash dividend to common stockholders of record as of March 26 , 2019 , which was paid on April 10 , 2019 . This dividend represented the Company’s first quarter 2019 dividend payment to its common stockholders . ▪ Additionally, on March 6 , 2019 , the Board of Directors declared a $ 0 . 46875 per share cash dividend to holders of record as of April 15 , 2019 of its Series A Preferred Stock, which was paid on April 30 , 2019 . This dividend represented the Company’s quarterly dividend on its Series A Preferred Stock for the period from January 31 , 2019 through April 29 , 2019 .
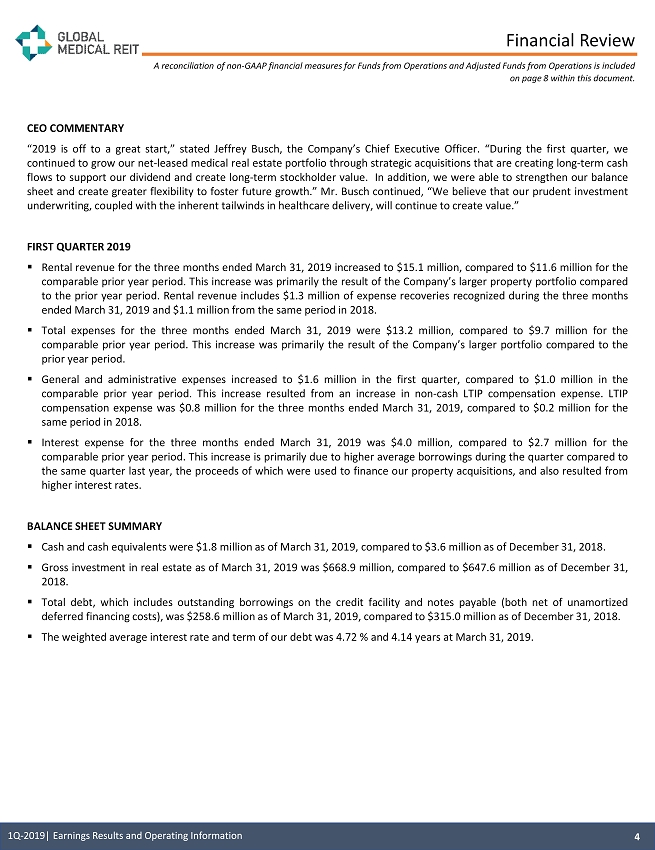
Financial Review CEO COMMENTARY “ 2019 is off to a great start,” stated Jeffrey Busch, the Company’s Chief Executive Officer . “During the first quarter, we continued to grow our net - leased medical real estate portfolio through strategic acquisitions that are creating long - term cash flows to support our dividend and create long - term stockholder value . In addition, we were able to strengthen our balance sheet and create greater flexibility to foster future growth . ” Mr . Busch continued, “We believe that our prudent investment underwriting, coupled with the inherent tailwinds in healthcare delivery, will continue to create value . ” FIRST QUARTER 2019 ▪ Rental revenue for the three months ended March 31 , 2019 increased to $ 15 . 1 million, compared to $ 11 . 6 million for the comparable prior year period . This increase was primarily the result of the Company’s larger property portfolio compared to the prior year period . Rental revenue includes $ 1 . 3 million of expense recoveries recognized during the three months ended March 31 , 2019 and $ 1 . 1 million from the same period in 2018 . ▪ Total expenses for the three months ended March 31 , 2019 were $ 13 . 2 million, compared to $ 9 . 7 million for the comparable prior year period . This increase was primarily the result of the Company’s larger portfolio compared to the prior year period . ▪ General and administrative expenses increased to $ 1 . 6 million in the first quarter, compared to $ 1 . 0 million in the comparable prior year period . This increase resulted from an increase in non - cash LTIP compensation expense . LTIP compensation expense was $ 0 . 8 million for the three months ended March 31 , 2019 , compared to $ 0 . 2 million for the same period in 2018 . ▪ Interest expense for the three months ended March 31 , 2019 was $ 4 . 0 million, compared to $ 2 . 7 million for the comparable prior year period . This increase is primarily due to higher average borrowings during the quarter compared to the same quarter last year, the proceeds of which were used to finance our property acquisitions, and also resulted from higher interest rates . BALANCE SHEET SUMMARY ▪ Cash and cash equivalents were $ 1 . 8 million as of March 31 , 2019 , compared to $ 3 . 6 million as of December 31 , 2018 . ▪ Gross investment in real estate as of March 31 , 2019 was $ 668 . 9 million, compared to $ 647 . 6 million as of December 31 , 2018 . ▪ Total debt, which includes outstanding borrowings on the credit facility and notes payable (both net of unamortized deferred financing costs), was $ 258 . 6 million as of March 31 , 2019 , compared to $ 315 . 0 million as of December 31 , 2018 . ▪ The weighted average interest rate and term of our debt was 4 . 72 % and 4 . 14 years at March 31 , 2019 . A reconciliation of non - GAAP financial measures for Funds from Operations and Adjusted Funds from Operations is included on page 8 within this document. 4 1Q - 2019| Earnings Results and Operating Information
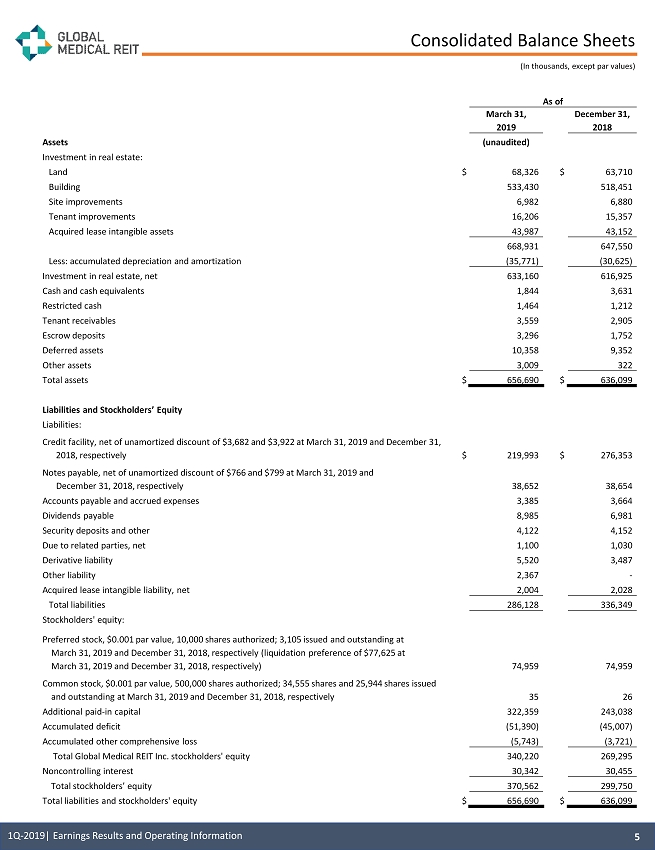
Consolidated Balance Sheets (In thousands, except par values) As of March 31, 2019 December 31, 2018 Assets (unaudited) Investment in real estate: Land $ 68,326 $ 63,710 Building 533,430 518,451 Site improvements 6,982 6,880 Tenant improvements 16,206 15,357 Acquired lease intangible assets 43,987 43,152 668,931 647,550 Less: accumulated depreciation and amortization (35,771) (30,625) Investment in real estate, net 633,160 616,925 Cash and cash equivalents 1,844 3,631 Restricted cash 1,464 1,212 Tenant receivables 3,559 2,905 Escrow deposits 3,296 1,752 Deferred assets 10,358 9,352 Other assets 3,009 322 Total assets $ 656,690 $ 636,099 Liabilities and Stockholders’ Equity Liabilities: Credit facility, net of unamortized discount of $3,682 and $3,922 at March 31, 2019 and December 31, 2018, respectively $ 219,993 $ 276,353 Notes payable, net of unamortized discount of $766 and $799 at March 31, 2019 and December 31, 2018, respectively 38,652 38,654 Accounts payable and accrued expenses 3,385 3,664 Dividends payable 8,985 6,981 Security deposits and other 4,122 4,152 Due to related parties, net 1,100 1,030 Derivative liability 5,520 3,487 Other liability 2,367 - Acquired lease intangible liability, net 2,004 2,028 Total liabilities 286,128 336,349 Stockholders' equity: Preferred stock, $0.001 par value, 10,000 shares authorized; 3,105 issued and outstanding at March 31, 2019 and December 31, 2018, respectively (liquidation preference of $77,625 at March 31, 2019 and December 31, 2018, respectively) 74,959 74,959 Common stock, $0.001 par value, 500,000 shares authorized; 34,555 shares and 25,944 shares issued and outstanding at March 31, 2019 and December 31, 2018, respectively 35 26 Additional paid - in capital 322,359 243,038 Accumulated deficit (51,390) (45,007) Accumulated other comprehensive loss (5,743) (3,721) Total Global Medical REIT Inc. stockholders' equity 340,220 269,295 Noncontrolling interest 30,342 30,455 Total stockholders’ equity 370,562 299,750 Total liabilities and stockholders' equity $ 656,690 $ 636,099 5 1Q - 2019| Earnings Results and Operating Information
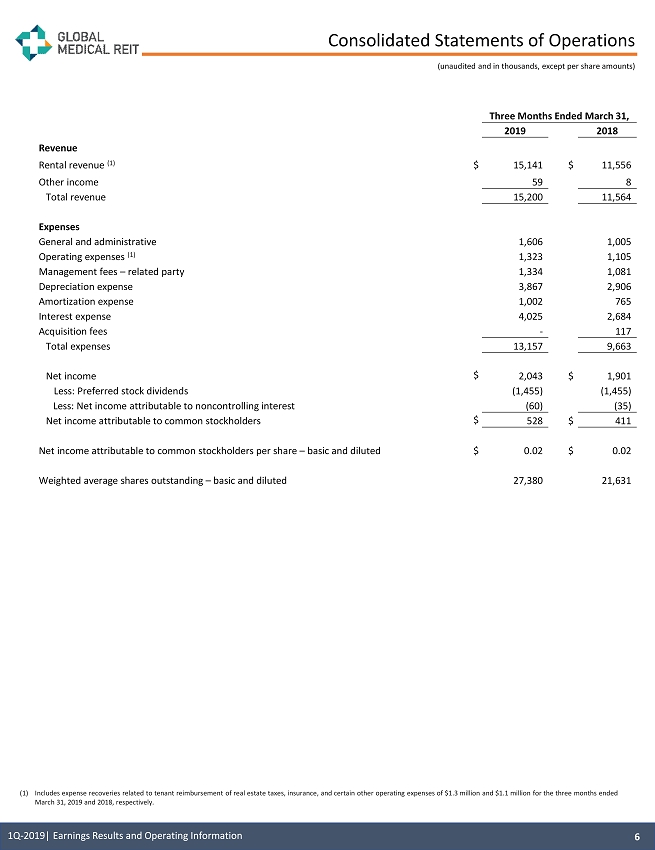
Consolidated Statements of Operations (unaudited and in thousands, except per share amounts) Three Months Ended March 31, 2019 2018 Revenue Rental revenue (1) $ 15,141 $ 11,556 Other income 59 8 Total revenue 15,200 11,564 Expenses General and administrative 1,606 1,005 Operating expenses (1) 1,323 1,105 Management fees – related party 1,334 1,081 Depreciation expense 3,867 2,906 Amortization expense 1,002 765 Interest expense 4,025 2,684 Acquisition fees - 117 Total expenses 13,157 9,663 Net income $ 2,043 $ 1,901 Less: Preferred stock dividends (1,455) (1,455) Less: Net income attributable to noncontrolling interest (60) (35) Net income attributable to common stockholders $ 528 $ 411 Net income attributable to common stockholders per share – basic and diluted $ 0.02 $ 0.02 Weighted average shares outstanding – basic and diluted 27,380 21,631 6 1Q - 2019| Earnings Results and Operating Information (1) Includes expense recoveries related to tenant reimbursement of real estate taxes, insurance, and certain other operating exp enses of $1.3 million and $1.1 million for the three months ended March 31, 2019 and 2018, respectively.
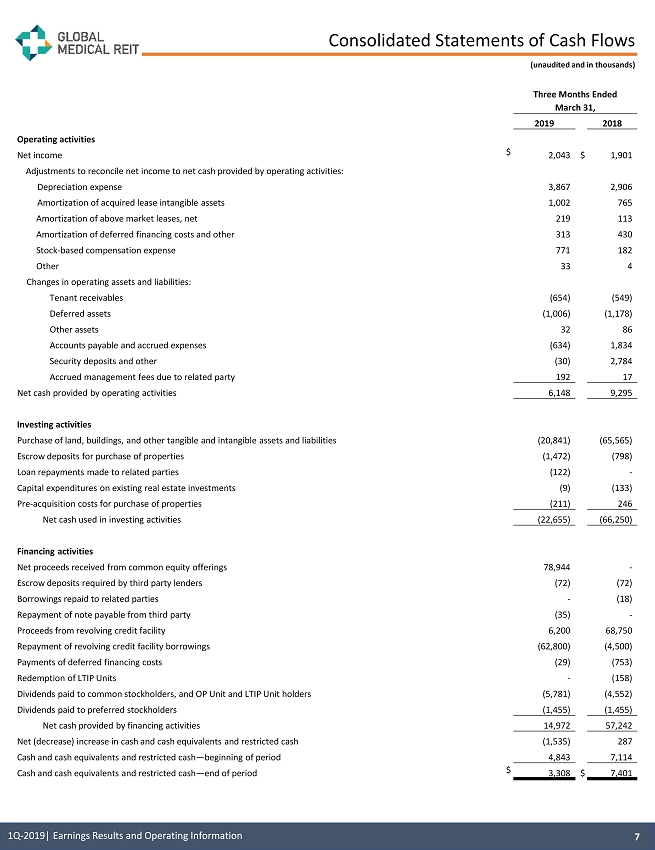
Consolidated Statements of Cash Flows (unaudited and in thousands) Three Months Ended March 31, 2019 2018 Operating activities Net income $ 2,043 $ 1,901 Adjustments to reconcile net income to net cash provided by operating activities: Depreciation expense 3,867 2,906 Amortization of acquired lease intangible assets 1,002 765 Amortization of above market leases, net 219 113 Amortization of deferred financing costs and other 313 430 Stock - based compensation expense 771 182 Other 33 4 Changes in operating assets and liabilities: Tenant receivables (654) (549) Deferred assets (1,006) (1,178) Other assets 32 86 Accounts payable and accrued expenses (634) 1,834 Security deposits and other (30) 2,784 Accrued management fees due to related party 192 17 Net cash provided by operating activities 6,148 9,295 Investing activities Purchase of land, buildings, and other tangible and intangible assets and liabilities (20,841) (65,565) Escrow deposits for purchase of properties (1,472) (798) Loan repayments made to related parties (122) - Capital expenditures on existing real estate investments (9) (133) Pre - acquisition costs for purchase of properties (211) 246 Net cash used in investing activities (22,655) (66,250) Financing activities Net proceeds received from common equity offerings 78,944 - Escrow deposits required by third party lenders (72) (72) Borrowings repaid to related parties - (18) Repayment of note payable from third party (35) - Proceeds from revolving credit facility 6,200 68,750 Repayment of revolving credit facility borrowings (62,800) (4,500) Payments of deferred financing costs (29) (753) Redemption of LTIP Units - (158) Dividends paid to common stockholders, and OP Unit and LTIP Unit holders (5,781) (4,552) Dividends paid to preferred stockholders (1,455) (1,455) Net cash provided by financing activities 14,972 57,242 Net (decrease) increase in cash and cash equivalents and restricted cash (1,535) 287 Cash and cash equivalents and restricted cash — beginning of period 4,843 7,114 Cash and cash equivalents and restricted cash — end of period $ 3,308 $ 7,401 7 1Q - 2019| Earnings Results and Operating Information
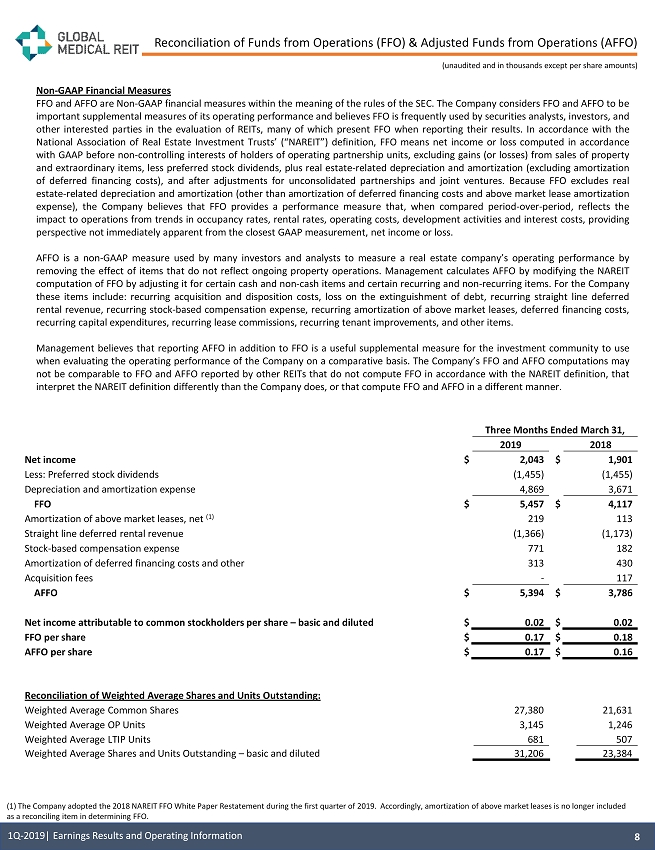
Reconciliation of Funds from Operations (FFO) & Adjusted Funds from Operations (AFFO) (unaudited and in thousands except per share amounts) Non - GAAP Financial Measures FFO and AFFO are Non - GAAP financial measures within the meaning of the rules of the SEC . The Company considers FFO and AFFO to be important supplemental measures of its operating performance and believes FFO is frequently used by securities analysts, investors, and other interested parties in the evaluation of REITs, many of which present FFO when reporting their results . In accordance with the National Association of Real Estate Investment Trusts’ (“NAREIT”) definition, FFO means net income or loss computed in accordance with GAAP before non - controlling interests of holders of operating partnership units, excluding gains (or losses) from sales of property and extraordinary items, less preferred stock dividends, plus real estate - related depreciation and amortization (excluding amortization of deferred financing costs), and after adjustments for unconsolidated partnerships and joint ventures . Because FFO excludes real estate - related depreciation and amortization (other than amortization of deferred financing costs and above market lease amortization expense), the Company believes that FFO provides a performance measure that, when compared period - over - period, reflects the impact to operations from trends in occupancy rates, rental rates, operating costs, development activities and interest costs, providing perspective not immediately apparent from the closest GAAP measurement, net income or loss . AFFO is a non - GAAP measure used by many investors and analysts to measure a real estate company’s operating performance by removing the effect of items that do not reflect ongoing property operations . Management calculates AFFO by modifying the NAREIT computation of FFO by adjusting it for certain cash and non - cash items and certain recurring and non - recurring items . For the Company these items include : recurring acquisition and disposition costs, loss on the extinguishment of debt, recurring straight line deferred rental revenue, recurring stock - based compensation expense, recurring amortization of above market leases, deferred financing costs, recurring capital expenditures, recurring lease commissions, recurring tenant improvements, and other items . Management believes that reporting AFFO in addition to FFO is a useful supplemental measure for the investment community to use when evaluating the operating performance of the Company on a comparative basis . The Company’s FFO and AFFO computations may not be comparable to FFO and AFFO reported by other REITs that do not compute FFO in accordance with the NAREIT definition, that interpret the NAREIT definition differently than the Company does, or that compute FFO and AFFO in a different manner . Reconciliation of Weighted Average Shares and Units Outstanding: Weighted Average Common Shares 27,380 21,631 Weighted Average OP Units 3,145 1,246 Weighted Average LTIP Units 681 507 Weighted Average Shares and Units Outstanding – basic and diluted 31,206 23,384 Three Months Ended March 31, 2019 2018 Net income $ 2,043 $ 1,901 Less: Preferred stock dividends (1,455) (1,455) Depreciation and amortization expense 4,869 3,671 FFO $ 5,457 $ 4,117 Amortization of above market leases, net (1) 219 113 Straight line deferred rental revenue (1,366) (1,173) Stock - based compensation expense 771 182 Amortization of deferred financing costs and other 313 430 Acquisition fees - 117 AFFO $ 5,394 $ 3,786 Net income attributable to common stockholders per share – basic and diluted $ 0.02 $ 0.02 FFO per share $ 0.17 $ 0.18 AFFO per share $ 0.17 $ 0.16 8 1Q - 2019| Earnings Results and Operating Information (1) The Company adopted the 2018 NAREIT FFO White Paper Restatement during the first quarter of 2019. Accordingly, amortizat ion of above market leases is no longer included as a reconciling item in determining FFO.
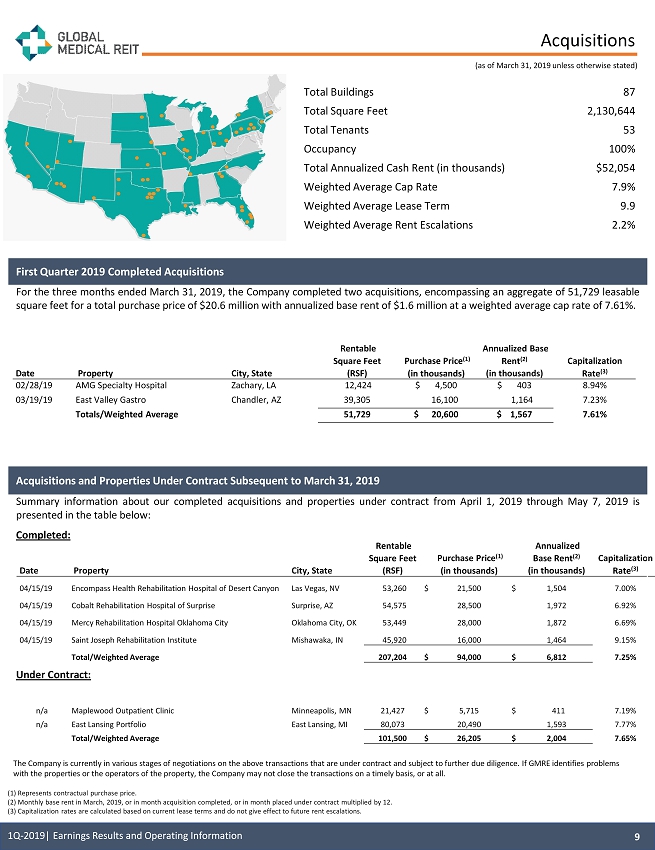
Date Property City, State Rentable Square Feet (RSF) Purchase Price (1) (in thousands) Annualized Base Rent (2) (in thousands) Capitalization Rate (3) 04/15/19 Encompass Health Rehabilitation Hospital of Desert Canyon Las Vegas, NV 53,260 $ 21,500 $ 1,504 7.00% 04/15/19 Cobalt Rehabilitation Hospital of Surprise Surprise, AZ 54,575 28,500 1,972 6.92% 04/15/19 Mercy Rehabilitation Hospital Oklahoma City Oklahoma City, OK 53,449 28,000 1,872 6.69% 04/15/19 Saint Joseph Rehabilitation Institute Mishawaka, IN 45,920 16,000 1,464 9.15% Total/Weighted Average 207,204 $ 94,000 $ 6,812 7.25% n/a Maplewood Outpatient Clinic Minneapolis, MN 21,427 $ 5,715 $ 411 7.19% n/a East Lansing Portfolio East Lansing, MI 80,073 20,490 1,593 7.77% Total/Weighted Average 101,500 $ 26,205 $ 2,004 7.65% Acquisitions and Properties Under Contract Subsequent to March 31 , 2019 Summary information about our completed acquisitions and properties under contract from April 1 , 2019 through May 7 , 2019 is presented in the table below : Completed : Under Contract : (1) Represents contractual purchase price. (2) Monthly base rent in March, 2019, or in month acquisition completed, or in month placed under contract multiplied by 12. (3) Capitalization rates are calculated based on current lease terms and do not give effect to future rent escalations. Acquisitions The Company is currently in various stages of negotiations on the above transactions that are under contract and subject to f urt her due diligence. If GMRE identifies problems with the properties or the operators of the property, the Company may not close the transactions on a timely basis, or at all . Date Property City, State Rentable Square Feet (RSF) Purchase Price (1) (in thousands) Annualized Base Rent (2) (in thousands) Capitalization Rate (3) 02/28/19 AMG Specialty Hospital Zachary, LA 12,424 $ 4,500 $ 403 8.94% 03/19/19 East Valley Gastro Chandler, AZ 39,305 16,100 1,164 7.23% Totals/Weighted Average 51,729 $ 20,600 $ 1,567 7.61% First Quarter 2019 Completed Acquisitions For the three months ended March 31 , 2019 , the Company completed two acquisitions, encompassing an aggregate of 51 , 729 leasable square feet for a total purchase price of $ 20 . 6 million with annualized base rent of $ 1 . 6 million at a weighted average cap rate of 7 . 61 % . 9 1Q - 2019| Earnings Results and Operating Information Total Buildings 87 Total Square Feet 2,130,644 Total Tenants 53 Occupancy 100% Total Annualized Cash Rent (in thousands) $52,054 Weighted Average Cap Rate 7.9% Weighted Average Lease Term 9.9 Weighted Average Rent Escalations 2.2% (as of March 31, 2019 unless otherwise stated)
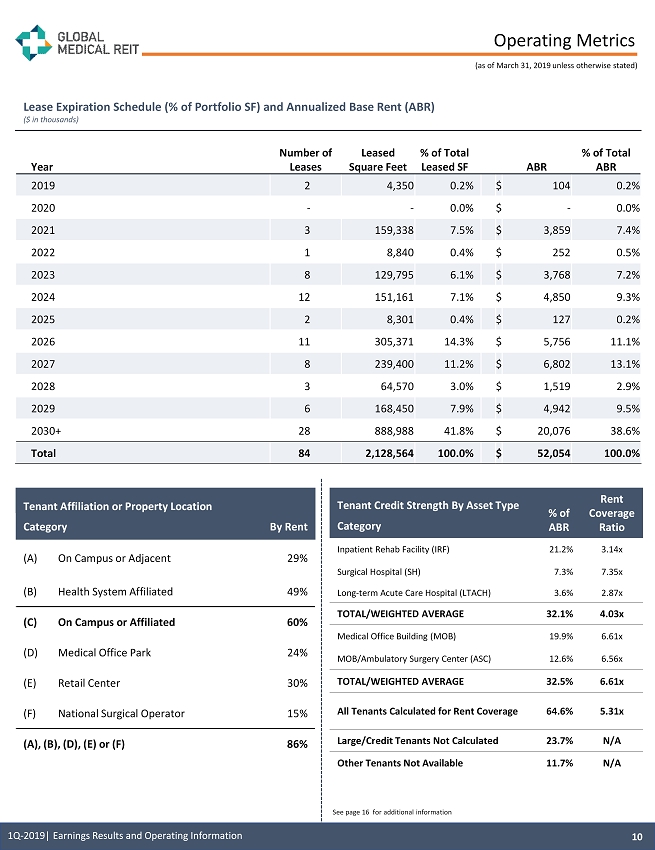
Operating Metrics Tenant Affiliation or Property Location Category By Rent (A) On Campus or Adjacent 29% (B) Health System Affiliated 49% (C) On Campus or Affiliated 60% (D) Medical Office Park 24% (E) Retail Center 30% (F) National Surgical Operator 15% (A), (B), (D), (E) or (F) 86% See page 16 for additional information Year Number of Leases Leased Square Feet % of Total Leased SF ABR % of Total ABR 2019 2 4,350 0.2% $ 104 0.2% 2020 - - 0.0% $ - 0.0% 2021 3 159,338 7.5% $ 3,859 7.4% 2022 1 8,840 0.4% $ 252 0.5% 2023 8 129,795 6.1% $ 3,768 7.2% 2024 12 151,161 7.1% $ 4,850 9.3% 2025 2 8,301 0.4% $ 127 0.2% 2026 11 305,371 14.3% $ 5,756 11.1% 2027 8 239,400 11.2% $ 6,802 13.1% 2028 3 64,570 3.0% $ 1,519 2.9% 2029 6 168,450 7.9% $ 4,942 9.5% 2030+ 28 888,988 41.8% $ 20,076 38.6% Total 84 2,128,564 100.0% $ 52,054 100.0% 10 1Q - 2019| Earnings Results and Operating Information (as of March 31, 2019 unless otherwise stated) Lease Expiration Schedule (% of Portfolio SF) and Annualized Base Rent (ABR) ($ in thousands) Tenant Credit Strength By Asset Type Category % of ABR Rent Coverage Ratio Inpatient Rehab Facility (IRF) 21.2% 3.14x Surgical Hospital (SH) 7.3% 7.35x Long - term Acute Care Hospital (LTACH) 3.6% 2.87x TOTAL/WEIGHTED AVERAGE 32.1% 4.03x Medical Office Building (MOB) 19.9% 6.61x MOB/Ambulatory Surgery Center (ASC) 12.6% 6.56x TOTAL/WEIGHTED AVERAGE 32.5% 6.61x All Tenants Calculated for Rent Coverage 64.6% 5.31x Large/Credit Tenants Not Calculated 23.7% N/A Other Tenants Not Available 11.7% N/A
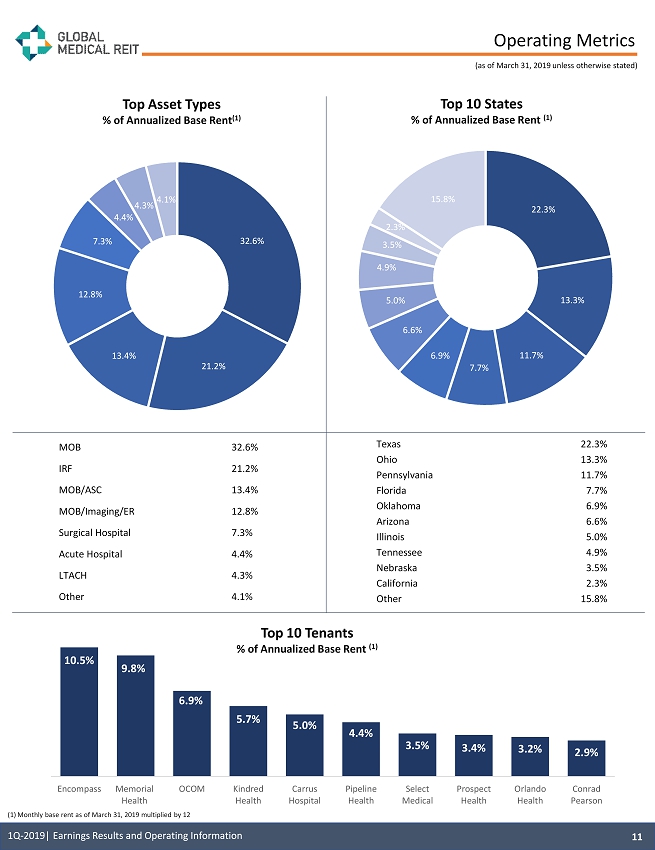
22.3% 13.3% 11.7% 7.7% 6.9% 6.6% 5.0% 4.9% 3.5% 2.3% 15.8% Operating Metrics (1) Monthly base rent as of March 31, 2019 multiplied by 12 Top 10 Tenants % of Annualized Base Rent (1) Top 10 States % of Annualized Base Rent (1) Top Asset Types % of Annualized Base Rent (1) 11 1Q - 2019| Earnings Results and Operating Information (as of March 31, 2019 unless otherwise stated) 32.6% 21.2% 13.4% 12.8% 7.3% 4.4% 4.3% 4.1% MOB 32.6% IRF 21.2% MOB/ASC 13.4% MOB/Imaging/ER 12.8% Surgical Hospital 7.3% Acute Hospital 4.4% LTACH 4.3% Other 4.1% Texas 22.3% Ohio 13.3% Pennsylvania 11.7% Florida 7.7% Oklahoma 6.9% Arizona 6.6% Illinois 5.0% Tennessee 4.9% Nebraska 3.5% California 2.3% Other 15.8% 10.5% 9.8% 6.9% 5.7% 5.0% 4.4% 3.5% 3.4% 3.2% 2.9% Encompass Memorial Health OCOM Kindred Health Carrus Hospital Pipeline Health Select Medical Prospect Health Orlando Health Conrad Pearson
Top 10 Tenant Profiles Encompass Health (Ba 3 ) (NYSE : EHC), headquartered in Birmingham, AL is a national leader in integrated healthcare services offering both facility - based and home - based patient care through its network of inpatient rehabilitation hospitals, home health agencies and hospice agencies . With a national footprint that spans 130 hospitals and 278 home health & hospice locations in 36 states and Puerto Rico, Encompass Health is committed to delivering high - quality, cost - effective care across the post - acute continuum . Encompass Health is ranked as one of Fortune's 100 Best Companies to Work For, as well as Modern Healthcare's Best Places to Work . Marietta Memorial Health System (MMH), (BB - ) is headquartered in Marietta, OH, and is the largest health system in the Parkersburg - Marietta - Vienna MSA . The largest employer in Washington County, MMH comprises (i) two hospitals, Marietta Memorial Hospital ( 154 - bed) and Selby General Hospital ( 25 - bed) critical access hospital ; (ii) the Belpre Campus ; (iii) ten clinic outpatient service sites ; and (iv) five imaging locations, and has over 2 , 500 employees and 211 accredited physicians . Oklahoma Center for Orthopedic & Multi - Specialty Surgery, LLC (OCOM) is based Oklahoma City, OK and affiliated with USPI and INTEGRIS, and is a leading hospital for orthopedic specialists . OCOM operates a surgical hospital with nine operating rooms and a physical therapy department, an ancillary surgery center, and multiple imaging centers in throughout Oklahoma City . Kindred Healthcare, LLC is a healthcare services company based in Louisville, KY with annual revenues of approximately $ 3 . 3 billion . At December 31 , 2018 , Kindred through its subsidiaries had approximately 35 , 700 employees providing healthcare services in 1 , 789 locations in 45 states, including 74 long - term acute care hospitals, 22 inpatient rehabilitation hospitals, 11 sub - acute units, 96 inpatient rehabilitation units (hospital - based) and contract rehabilitation service businesses which served 1 , 586 non - affiliated sites of service . Kindred is ranked as one of Fortune magazine’s Most Admired Healthcare Companies for nine years . Carrus Hospital is located in Sherman, TX and provides acute rehabilitative care and long term acute care . Accredited with The Joint Commission’s Gold Seal of Approval, Carrus Hospital serves Sherman, Durant, Denison, Gainesville, Denton, McKinney, Plano, Bonham, Lewisville, Carrollton, Fort Worth, Dallas, Oklahoma City and beyond . Pipeline Health is a privately-held, community-based hospital ownership and management company based in Los Angeles . The principals of Pipeline Health have more than 250 years of collective experience in clinical medicine, finance, hospital operations and acquisitions . Pipeline’s growing business, through its affiliates, includes : Emergent Medical Associates, a leading provider of ER serving 20 + hospital sites and 900 , 000 patients annually ; Integrated Anesthesia Medical Group, with 100 providers performing 15 , 000 procedures annually ; Avanti Hospitals, a Los Angeles health system with four hospitals, 400 + beds and 55 , 000 ER visits annually ; Cloudbreak , a telemedicine company with 75 , 000 monthly encounters in 700 hospitals ; Pacific Healthworks, a physician practice management company ; Benchmark Hospitalists ; four community hospitals in Chicago and Dallas, and a recent addition of 22 freestanding EDs upon a merger with Adaptus Health . Select Medical (B 1 ) is headquartered in Mechanicsburg, PA and one of the largest operators of critical illness recovery hospitals (previously referred to as long term acute care hospitals), rehabilitation hospitals (previously referred to as inpatient rehabilitation facilities), outpatient rehabilitation clinics, and occupational health centers in the U . S . based on the number of facilities . As of December 31 , 2018 , Select Medical operated 96 critical illness recovery hospitals in 27 states, 26 rehabilitation hospitals in 11 states, and 1 , 662 outpatient rehabilitation clinics in 41 states . Select Medical’s joint venture subsidiary Concentra operated 524 occupational health centers in 41 states . Prospect Medical Holdings (B 3 ) was Established in 1996 , and has grown into a significant provider of coordinated regional healthcare services in Southern California, Connecticut, New Jersey, Pennsylvania, Rhode Island and South Central Texas . In addition to their medical groups, they also own 20 acute and behavioral hospitals that are located in diverse areas within Southern California, Connecticut, New Jersey, Pennsylvania, Rhode Island and South Central Texas and maintain competitive market positions in the areas they serve . All of their facilities aim to provide a comprehensive range of services tailored to their specific communities, including partnerships with other area hospitals, physicians and health plans . Orlando Health (A 2 ) is based in Central Florida, Orlando and is a $ 3 . 8 billion not - for - profit healthcare organization and a community - based network of hospitals, physician practices and outpatient care centers across Central Florida . The organization is home to the area’s only Level One Trauma Centers for adults and pediatrics and is a statutory teaching hospital system that offers both specialty and community hospitals . More than 3 , 000 physicians have privileges across the system, which is also one of the area’s largest employers with more than 23 , 000 employees who serve nearly 155 , 000 inpatients, more than 3 million outpatients, and more than 10 , 000 international patients each year . Additionally, Orlando Health provides more than $ 345 million in support of community health needs . The Conrad Pearson Clinic is the largest and most experienced urology group in the Mid - South, providing a full range of diagnostic and therapeutic services . Since 1996 , they have provided cutting - edge urological care to patients in the greater Memphis area . 12 1Q - 2019| Earnings Results and Operating Information (as of March 31, 2019 unless otherwise stated)
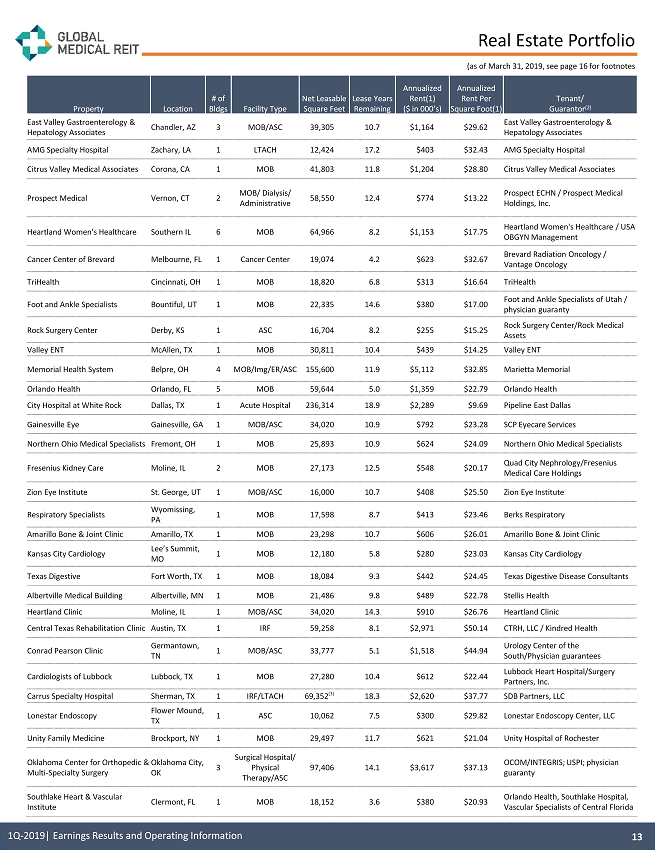
Real Estate Portfolio (as of March 31, 2019, see page 16 for footnotes 13 1Q - 2019| Earnings Results and Operating Information Property Location # of Bldgs Facility Type Net Leasable Square Feet Lease Years Remaining Annualized Rent(1) ($ in 000’s) Annualized Rent Per Square Foot(1) Tenant/ Guarantor (2) East Valley Gastroenterology & Hepatology Associates Chandler, AZ 3 MOB/ASC 39,305 10.7 $1,164 $29.62 East Valley Gastroenterology & Hepatology Associates AMG Specialty Hospital Zachary, LA 1 LTACH 12,424 17.2 $403 $32.43 AMG Specialty Hospital Citrus Valley Medical Associates Corona, CA 1 MOB 41,803 11.8 $1,204 $28.80 Citrus Valley Medical Associates Prospect Medical Vernon, CT 2 MOB/ Dialysis/ Administrative 58,550 12.4 $774 $13.22 Prospect ECHN / Prospect Medical Holdings, Inc. Heartland Women's Healthcare Southern IL 6 MOB 64,966 8.2 $1,153 $17.75 Heartland Women's Healthcare / USA OBGYN Management Cancer Center of Brevard Melbourne, FL 1 Cancer Center 19,074 4.2 $623 $32.67 Brevard Radiation Oncology / Vantage Oncology TriHealth Cincinnati, OH 1 MOB 18,820 6.8 $313 $16.64 TriHealth Foot and Ankle Specialists Bountiful, UT 1 MOB 22,335 14.6 $380 $17.00 Foot and Ankle Specialists of Utah / physician guaranty Rock Surgery Center Derby, KS 1 ASC 16,704 8.2 $255 $15.25 Rock Surgery Center/Rock Medical Assets Valley ENT McAllen, TX 1 MOB 30,811 10.4 $439 $14.25 Valley ENT Memorial Health System Belpre, OH 4 MOB/ Img /ER/ASC 155,600 11.9 $5,112 $32.85 Marietta Memorial Orlando Health Orlando, FL 5 MOB 59,644 5.0 $1,359 $22.79 Orlando Health City Hospital at White Rock Dallas, TX 1 Acute Hospital 236,314 18.9 $2,289 $9.69 Pipeline East Dallas Gainesville Eye Gainesville, GA 1 MOB/ASC 34,020 10.9 $792 $23.28 SCP Eyecare Services Northern Ohio Medical Specialists Fremont, OH 1 MOB 25,893 10.9 $624 $24.09 Northern Ohio Medical Specialists Fresenius Kidney Care Moline, IL 2 MOB 27,173 12.5 $548 $20.17 Quad City Nephrology/Fresenius Medical Care Holdings Zion Eye Institute St. George, UT 1 MOB/ASC 16,000 10.7 $408 $25.50 Zion Eye Institute Respiratory Specialists Wyomissing, PA 1 MOB 17,598 8.7 $413 $23.46 Berks Respiratory Amarillo Bone & Joint Clinic Amarillo, TX 1 MOB 23,298 10.7 $606 $26.01 Amarillo Bone & Joint Clinic Kansas City Cardiology Lee’s Summit, MO 1 MOB 12,180 5.8 $280 $23.03 Kansas City Cardiology Texas Digestive Fort Worth, TX 1 MOB 18,084 9.3 $442 $24.45 Texas Digestive Disease Consultants Albertville Medical Building Albertville, MN 1 MOB 21,486 9.8 $489 $22.78 Stellis Health Heartland Clinic Moline, IL 1 MOB/ASC 34,020 14.3 $910 $26.76 Heartland Clinic Central Texas Rehabilitation Clinic Austin, TX 1 IRF 59,258 8.1 $2,971 $50.14 CTRH, LLC / Kindred Health Conrad Pearson Clinic Germantown, TN 1 MOB/ASC 33,777 5.1 $1,518 $44.94 Urology Center of the South/Physician guarantees Cardiologists of Lubbock Lubbock, TX 1 MOB 27,280 10.4 $612 $22.44 Lubbock Heart Hospital/Surgery Partners, Inc. Carrus Specialty Hospital Sherman, TX 1 IRF/LTACH 69,352 (3) 18.3 $2,620 $37.77 SDB Partners, LLC Lonestar Endoscopy Flower Mound, TX 1 ASC 10,062 7.5 $300 $29.82 Lonestar Endoscopy Center, LLC Unity Family Medicine Brockport, NY 1 MOB 29,497 11.7 $621 $21.04 Unity Hospital of Rochester Oklahoma Center for Orthopedic & Multi - Specialty Surgery Oklahoma City, OK 3 Surgical Hospital/ Physical Therapy/ASC 97,406 14.1 $3,617 $37.13 OCOM/INTEGRIS; USPI; physician guaranty Southlake Heart & Vascular Institute Clermont, FL 1 MOB 18,152 3.6 $380 $20.93 Orlando Health, Southlake Hospital, Vascular Specialists of Central Florida
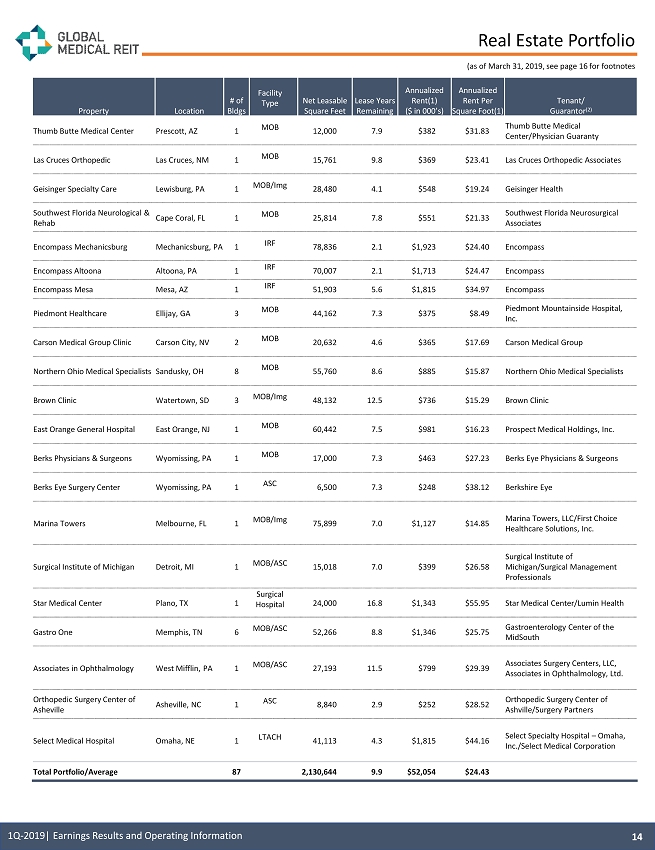
Real Estate Portfolio 14 1Q - 2019| Earnings Results and Operating Information Property Location # of Bldgs Facility Type Net Leasable Square Feet Lease Years Remaining Annualized Rent(1) ($ in 000’s) Annualized Rent Per Square Foot(1) Tenant/ Guarantor (2) Thumb Butte Medical Center Prescott, AZ 1 MOB 12,000 7.9 $382 $31.83 Thumb Butte Medical Center/Physician Guaranty Las Cruces Orthopedic Las Cruces, NM 1 MOB 15,761 9.8 $369 $23.41 Las Cruces Orthopedic Associates Geisinger Specialty Care Lewisburg, PA 1 MOB/ Img 28,480 4.1 $548 $19.24 Geisinger Health Southwest Florida Neurological & Rehab Cape Coral, FL 1 MOB 25,814 7.8 $551 $21.33 Southwest Florida Neurosurgical Associates Encompass Mechanicsburg Mechanicsburg, PA 1 IRF 78,836 2.1 $1,923 $24.40 Encompass Encompass Altoona Altoona, PA 1 IRF 70,007 2.1 $1,713 $24.47 Encompass Encompass Mesa Mesa, AZ 1 IRF 51,903 5.6 $1,815 $34.97 Encompass Piedmont Healthcare Ellijay, GA 3 MOB 44,162 7.3 $375 $8.49 Piedmont Mountainside Hospital, Inc. Carson Medical Group Clinic Carson City, NV 2 MOB 20,632 4.6 $365 $17.69 Carson Medical Group Northern Ohio Medical Specialists Sandusky, OH 8 MOB 55,760 8.6 $885 $15.87 Northern Ohio Medical Specialists Brown Clinic Watertown, SD 3 MOB/ Img 48,132 12.5 $736 $15.29 Brown Clinic East Orange General Hospital East Orange, NJ 1 MOB 60,442 7.5 $981 $16.23 Prospect Medical Holdings, Inc. Berks Physicians & Surgeons Wyomissing, PA 1 MOB 17,000 7.3 $463 $27.23 Berks Eye Physicians & Surgeons Berks Eye Surgery Center Wyomissing, PA 1 ASC 6,500 7.3 $248 $38.12 Berkshire Eye Marina Towers Melbourne, FL 1 MOB/ Img 75,899 7.0 $1,127 $14.85 Marina Towers, LLC/First Choice Healthcare Solutions, Inc. Surgical Institute of Michigan Detroit, MI 1 MOB/ASC 15,018 7.0 $399 $26.58 Surgical Institute of Michigan/Surgical Management Professionals Star Medical Center Plano, TX 1 Surgical Hospital 24,000 16.8 $1,343 $55.95 Star Medical Center/ Lumin Health Gastro One Memphis, TN 6 MOB/ASC 52,266 8.8 $1,346 $25.75 Gastroenterology Center of the MidSouth Associates in Ophthalmology West Mifflin, PA 1 MOB/ASC 27,193 11.5 $799 $29.39 Associates Surgery Centers, LLC, Associates in Ophthalmology, Ltd. Orthopedic Surgery Center of Asheville Asheville, NC 1 ASC 8,840 2.9 $252 $28.52 Orthopedic Surgery Center of Ashville/Surgery Partners Select Medical Hospital Omaha, NE 1 LTACH 41,113 4.3 $1,815 $44.16 Select Specialty Hospital – Omaha, Inc./Select Medical Corporation Total Portfolio/Average 87 2,130,644 9.9 $52,054 $24.43 (as of March 31, 2019, see page 16 for footnotes
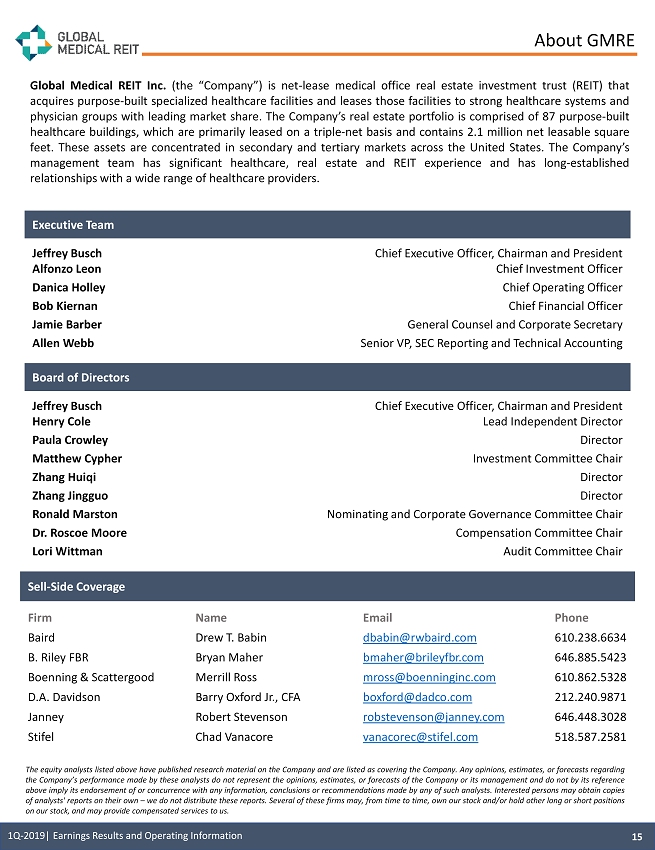
About GMRE Executive Team Jeffrey Busch Chief Executive Officer, Chairman and President Alfonzo Leon Chief Investment Officer Danica Holley Chief Operating Officer Bob Kiernan Chief Financial Officer Jamie Barber General Counsel and Corporate Secretary Allen Webb Senior VP, SEC Reporting and Technical Accounting Board of Directors Jeffrey Busch Chief Executive Officer, Chairman and President Henry Cole Lead Independent Director Paula Crowley Director Matthew Cypher Investment Committee Chair Zhang Huiqi Director Zhang Jingguo Director Ronald Marston Nominating and Corporate Governance Committee Chair Dr. Roscoe Moore Compensation Committee Chair Lori Wittman Audit Committee Chair Sell - Side Coverage Firm Name Email Phone Baird Drew T. Babin dbabin@rwbaird.com 610.238.6634 B. Riley FBR Bryan Maher bmaher@brileyfbr.com 646.885.5423 Boenning & Scattergood Merrill Ross mross@boenninginc.com 610.862.5328 D.A. Davidson Barry Oxford Jr., CFA boxford@dadco.com 212.240.9871 Janney Robert Stevenson robstevenson@janney.com 646.448.3028 Stifel Chad Vanacore vanacorec@stifel.com 518.587.2581 The equity analysts listed above have published research material on the Company and are listed as covering the Company . Any opinions, estimates, or forecasts regarding the Company’s performance made by these analysts do not represent the opinions, estimates, or forecasts of the Company or its management and do not by its reference above imply its endorsement of or concurrence with any information, conclusions or recommendations made by any of such analysts . Interested persons may obtain copies of analysts' reports on their own – we do not distribute these reports . Several of these firms may, from time to time, own our stock and/or hold other long or short positions on our stock, and may provide compensated services to us . Global Medical REIT Inc . (the “Company”) is net - lease medical office real estate investment trust (REIT) that acquires purpose - built specialized healthcare facilities and leases those facilities to strong healthcare systems and physician groups with leading market share . The Company’s real estate portfolio is comprised of 87 purpose - built healthcare buildings, which are primarily leased on a triple - net basis and contains 2 . 1 million net leasable square feet . These assets are concentrated in secondary and tertiary markets across the United States . The Company’s management team has significant healthcare, real estate and REIT experience and has long - established relationships with a wide range of healthcare providers . 15 1Q - 2019| Earnings Results and Operating Information
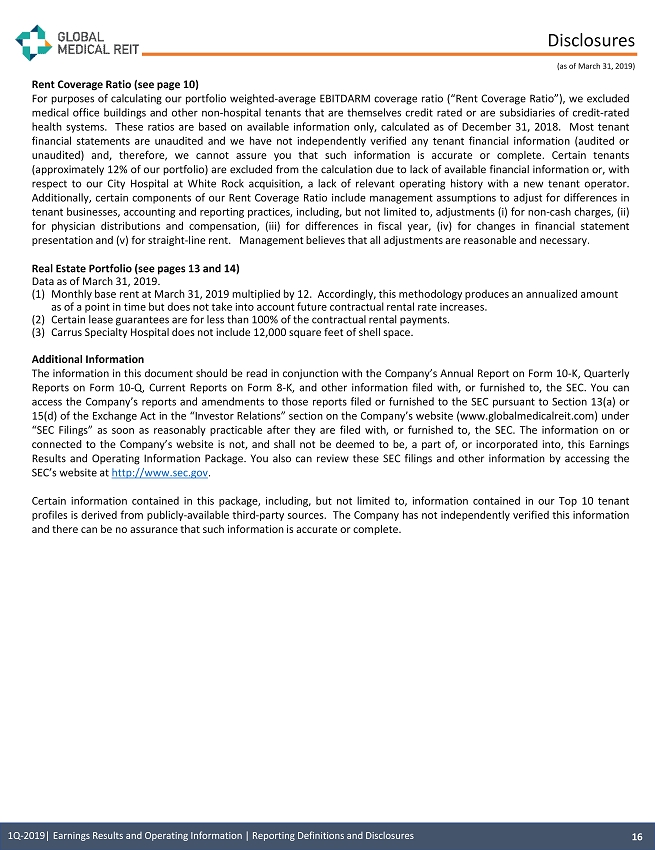
Disclosures Rent Coverage Ratio (see page 10 ) For purposes of calculating our portfolio weighted - average EBITDARM coverage ratio (“Rent Coverage Ratio”), we excluded medical office buildings and other non - hospital tenants that are themselves credit rated or are subsidiaries of credit - rated health systems . These ratios are based on available information only, calculated as of December 31 , 2018 . Most tenant financial statements are unaudited and we have not independently verified any tenant financial information (audited or unaudited) and, therefore, we cannot assure you that such information is accurate or complete . Certain tenants (approximately 12 % of our portfolio) are excluded from the calculation due to lack of available financial information or, with respect to our City Hospital at White Rock acquisition, a lack of relevant operating history with a new tenant operator . Additionally, certain components of our Rent Coverage Ratio include management assumptions to adjust for differences in tenant businesses, accounting and reporting practices, including, but not limited to, adjustments ( i ) for non - cash charges, (ii) for physician distributions and compensation, (iii) for differences in fiscal year, (iv) for changes in financial statement presentation and (v) for straight - line rent . Management believes that all adjustments are reasonable and necessary . Real Estate Portfolio (see pages 13 and 14 ) Data as of March 31, 2019. (1) Monthly base rent at March 31, 2019 multiplied by 12 . Accordingly, this methodology produces an annualized amount as of a point in time but does not take into account future contractual rental rate increases. (2) Certain lease guarantees are for less than 100% of the contractual rental payments. (3) Carrus Specialty Hospital does not include 12,000 square feet of shell space. Additional Information The information in this document should be read in conjunction with the Company’s Annual Report on Form 10 - K, Quarterly Reports on Form 10 - Q, Current Reports on Form 8 - K, and other information filed with, or furnished to, the SEC . You can access the Company’s reports and amendments to those reports filed or furnished to the SEC pursuant to Section 13 (a) or 15 (d) of the Exchange Act in the “Investor Relations” section on the Company’s website (www . globalmedicalreit . com) under “SEC Filings” as soon as reasonably practicable after they are filed with, or furnished to, the SEC . The information on or connected to the Company’s website is not, and shall not be deemed to be, a part of, or incorporated into, this Earnings Results and Operating Information Package . You also can review these SEC filings and other information by accessing the SEC’s website at http : //www . sec . gov . Certain information contained in this package, including, but not limited to, information contained in our Top 10 tenant profiles is derived from publicly - available third - party sources . The Company has not independently verified this information and there can be no assurance that such information is accurate or complete . 1Q - 2019| Earnings Results and Operating Information | Reporting Definitions and Disclosures 16 (as of March 31, 2019)
2 Bethesda Metro Center, Suite 440 | Bethesda, MD 20814 (202) 524 - 6851 www.globalmedicalreit.com NYSE: GMRE Investor Contact Mary Jensen maryj@globalmedicalreit.com 202.524.6869 – Office 310.526.1707 – Cell